Journal of Advanced Research in Ocean Engineering 4(4) (2018) 204-216
http://dx.doi.org/10.5574/JAROE.2018.4.4.204
A Comparative Study on the Prediction of Bow Flare Slamming
load using CFD and Prescript Formula for the Container Ship
†Dae-Won Seo
1*, Gi-Young Jeon
1, and Kang-Hyun Song
1 1Korean Register of Shipping, Busan, Korea(Manuscript Received October 18 2018; Revised November 15, 2018; Accepted December 20, 2018)
Abstract
A ship repeatedly face free surface under rough sea conditions owing to relative motion with wave encounter. The impact pressure is transferred to the hull structure and causes structural damage. In this study, the bow flare slamming load of a container ship is estimated using computations fluid dynamics (CFD) and prescript formula according to various classifications. It is found that the bow flare slamming load calculated by the formulas of the common structural rule and ABS tends to be similar to the CFD results.
Keywords: Bow flare slamming; Container Ship; Finite Volume Method; Finite Element Method; Strain Rate Effects
1. Introduction
A ship repeatedly face free surface under rough sea conditions owing to relative motion with wave en-counter. In the process of entering into water, the ship structure is temporarily subjected to the impact pres-sure. The impact pressures are categorized into bow flare slamming, bottom slamming, stern slamming, and green water loading depending on the position where the impact occurs, and various studies have been car-ried out using calculations and model experiments. In general, bow flare slamming occurs often in large container ships with a large flare angle, stern slamming frequently occurs on LNGCs since they have a relatively wide stern, and bottom slamming occurs in tankers because they have blunt stems. Repeatedly applied impact pressure causes structural damage and affects the stability of the vessel.
It is important to estimate the impact load of the slamming phenomenon. Von Karman (1929) and Wagner (1932) tried to find an asymptotic solution to the slamming pressure on a 2D circular cylinder and wedge shapes long ago. Since then, studies based on the potential flow have been conducted to predict the slam-ming impact pressure by Dobrovol’skaya (1969), Zhao and Faltinsen (1998). However, there is a difficulty in simulating the breaking wave using the potential code when the free surface hits the hull structure. Since then, many studies have been conducted to estimate the slamming impact pressure including the breaking wave by model experiments and computational fluid dynamics (CFD). Wang et al. (1996) measured the slamming pressure through a model experiment on the drop test of a wedge and tried to investigate the rela-tionship between slamming pressure and dead rise angle. Various studies have been conducted recently, and Hong et al. (2008) examined a model experiment of the drop test on the 2D wedge section and the 2D
† *
Corresponding author. E-mail address: [email protected] Copyright © KSOE 2018.
Table 1. Principal parameters of the container ship Ship Model Scale ratio 1 31.599 Lpp [m] 230 7.2786 B [m] 32.2 1.019 T [m] 10.8 0.3418 Δ [m3] 52030 1.649 LCG 111.6 3.532 VCG [m], from keel 14.322 0.453 Kxx/B 0.4 Kyy/Lpp, Kzz/Lpp 0.25
bow section in particular. Hong et al. (2014) also conducted a model experiment to measure bow flare slamming on container ships in regular and irregular waves. Wang and Guedes Soares (2012, 2013) con-firmed that numerical results on slamming pressure agreed well with those of drop tests of the wedge through a model experiment. Lee and Lew (2015) and Kim et al. (2008) conducted the calculation using CFD on an LNG C and container ship. However, it is still difficult to accurately estimate the impact pres-sure through numerical simulations, because the slamming prespres-sure occurs suddenly and disappears in a matter of seconds. In particular, it is necessary to keep the delta time of CFD sufficiently small, and the total calculation time increases significantly.
A significant motion of the vessel and intense free water surface have to be measured accurately to esti-mate the slamming load reliably. Although studies, which predicted the slamming pressure, were conducted often under irregular wave conditions in the real ship scale [Chen and Chen (2014), Wang and Soares (2016)], this is deemed impractical to be applied to the design phase considering the calculation time for simulation. Therefore, simplifications of irregular waves to regular waves under head sea conditions and simplified interpretations using incident waves have become common [ABS, 2002].
The subject vessel of this study is a KCS container ship with various experimental data. Recently, experi-mental results of additional resistance in regular waves were published at a CFD workshop held in Japan in 2015, and they were widely used for the verification of numerical simulations. Unfortunately, experiments on measuring the slamming pressure have not been performed yet, and the results of this numerical study are expected to be the basis of comparable data in terms of prediction of slamming load.
The slamming pressure from the numerical simulation was directly compared with the formula proposed by various classification society rules. These results are expected to be the data base for the revision of slamming load formulas in the future.
2. Numerical Setup and Calculation Conditions
The target vessel is a container with a length of 230 m. Numerical simulations were performed on a 1/31.599 scale ratio. The longitudinal center of gravity (LCG) is 111.6 m based on AP and the vertical cen-ter (VCG) of gravity is 14.322 m from the keel (Table 1).
A grid generation and a numerical simulation were carried out using STAR-CCM+ Version 11.06 in the commercial code. The trimmed mesh method has the advantage because the mesh size can be set either relatively small for complex flow ranges or large in cases of simple flow ranges through the configuration control of the mesh density in accordance with each flow characteristic used.
The calculation of the spatial gradient of the physical amount in a polyhedral grid made according to a trimmed mesh uses the least square method for second order accuracy. Moreover, to simulate the boundary layer flow on the surface of the ship relatively accurately, we used the prism layer technique to grid layers with 4.4 million grids from the hull surface by the half-width model ship, as shown in Fig. 1.
The generation of the incident wave is an important factor in estimating the slamming pressure accurately. Abdussamie et al. (2014a, 2014b) studied the grid dependency on the wave generation and found that more than 30 grids for the wave height and 80 grids for the wave length were needed to generate the waves well numerically. Therefore, 50 grids for the wave height and around 100 grids for the wave length were used in the numerical simulations.
The numerical calculation used the Stokes fifth order considering the wave height and period. The Euler overlay method (EOM) was also applied to simulate waves accurately without numerical damping. The wave that passes through the ship is naturally damped from the rear in the analysis domain to minimize the impact of reflection from the rear boundary.
A symmetric condition was applied to the free surface position (Z = 0) and the side of the calculation do-main, while the wall condition was applied to the surface of the ship. The volume of fluid method was used to reflect the free surface.
A dynamic fluid body interaction (DFBI) scheme was applied to simulate the motion of the ship by the wave. Except for the heave and pitch motion, all other motions were fixed. An overset grid system was also used to simulate accurately a large ship motion by waves. An overset mesh allows complex motion and moving parts to be easily set up and simulated. An overset mesh typically containing a body of interest, such as boat, is superimposed on a background mesh containing the surrounding geometry, and data are interpolated between the two. Many researchers use the overset mesh system for slamming phenomena or ship motion due to waves [Ock (2014)].
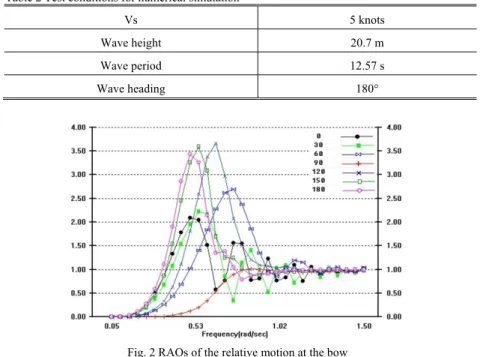
An equivalent design wave method was used to select the target wave height, and the target wave period was considered as relative motion (Fig. 2). Six degrees of freedom motion of the KCS container ship used KR3D, the motion analysis program based on the potential theory, owned by the KRS. Based on the calcu-lated motion of the ship, the response amplitude operators (RAOs) were derived for relative motion of the FP and incident wave. The wave that had the greatest impact on the slamming at the bow flare was limited as the incident wave (180°), and the target wavelength was set by the wavelength with the greatest relative motion. To determine the wave height of the incident wave, North Atlantic Standard Wave Data (IACS Rec. No. 34) and PM Spectrum were used to calculate the long term with a probability level of 10−8and then
Table 2 Test conditions for numerical simulation
Vs 5 knots
Wave height 20.7 m
Wave period 12.57 s
Wave heading 180°
Fig. 2 RAOs of the relative motion at the bow
The numerical calculation was carried out under the condition of a wave period of 12.57 s and a wave height of 20.7 m, as shown in Table 2.
3. Validation of the Numerical Setup
Impact pressure prediction through the CFD analysis is generally known to be most influenced by the time step (dt) and the grid resolution (Peric and Zorn (2005)). The time step is known to be the most dominant factor affecting the impact pressure prediction through the CFD analysis in general. In this study, prior to estimating the slamming pressure on the 3D vessel, the validity of the numerical calculation was investigat-ed in order to improve the accuracy of the impact pressure estimation on the free fall of a winvestigat-edge-shapinvestigat-ed body with reliable experimental results.
3.1 Target Object
A wedge-shaped body was selected to examine the validity of the numerical setup. The length and breadth of the wedge-shaped body are 800 mm and 600 mm, respectively. The wedge angle is 30°, as shown in Fig. 3. For the measuring point and further detailed information, refer to Kim et al. (2014).
Table 3 Test conditions of the various grid systems
△x, △y [m] B/Ycell dt [s]
Coarse 0.01 60
5×10⁻⁵
Medium 0.005 120
Fine 0.0025 240
3.2 Influence of the Grid Size
A numerical simulation was carried out to investigate the effect of the grid size on the prediction of the impact pressure, as shown in Fig. 4. The grid size is defined as B/Ycell. B/Ycellof the coarse mesh, medium
mesh, and fine mesh are 60, 120, and 240, respectively, as shown in Table 3. B is the breadth of the wedge-shaped body, and Ycellis the minimum grid size in the direction of the breadth. The time step of the
numer-ical simulation is fixed at 5 × 10⁻⁵(20 kHz), which is the same value as the measured velocity of the sensor
used in the model test.
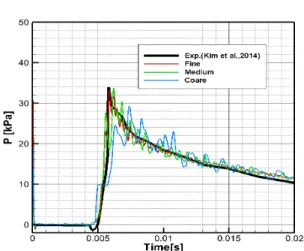
The influence of the grid size on the estimation of the impact pressure is shown in Fig. 5. As shown in the figure, the results of the numerical simulation show that the maximum pressure and characteristics are simi-lar to the experimental results. In all cases of the numerical calculations, pressure oscillations were generat-ed as compargenerat-ed to the experiment, but this was because the experimental results were processgenerat-ed through a filter. Above the medium grid size, the peak pressure value was found to match that of the experimental values within a range of approximately 3%. However, the point of occurrence of the peak pressure and the absolute value in the case of the coarse mesh were found to be significantly different from those of the ex-perimental results. Based on the results of this analysis, the grid size was constructed to be greater than 120 of B/Ycellwhen calculating the slamming impact pressure of a 3D vessel in this study.
(a) Coarse (b) Medium (c) Fine
Fig. 4 Grid system for various numbers of cells
Table 4 Test conditions for various time steps (dt)
dt [s] Courant No. △x, △y [m]
1 × 10⁻⁵ 0.006
0.005
5 × 10⁻⁵ 0.03
1 × 10⁻⁴ 0.06
1 × 10⁻³ 0.6
3.3 Influence of the Time Step
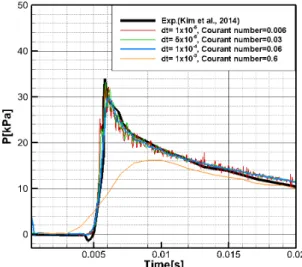
It is known that the estimation of the impact pressure acting on the hull for an extremely short period of time is greatly affected by the time step conditions in numerical calculations. Therefore, numerical simula-tions for four cases were additionally carried out to examine the influence of the time step on the size and aspect of the impact pressure. From the study on the free fall experiment of a wedge-shaped body by Kim et al. (2014), the Courant number is 0.006 when the time step is the smallest with approximately 1 × 10⁻⁵s.
As such, we performed the calculation under four conditions of the Courant number = 0.006, which divided the rise time by 100, Courant number = 0.03, which divided the time step by 20, Courant number = 0.06 which divided the time step by 10, and Courant number = 0.6, which was the time step, as shown in Table 4.
Fig. 6 shows the estimated calculated results of the impact pressure measured over time in the experiment and from the numerical simulation. As seen in the figure, the predicted maximum pressure value was con-siderably lower than the experimental results when the Courant number = 0.06. However, the impact pres-sure pattern tends to be similar to the results of the model test in all cases except for this case. In particular, when the Courant number was lower than 0.03, the maximum impact pressure from the numerical results was in good agreement with the experimental results quantitatively. When the Courant number was 0.06, the maximum peak pressure was about 30k Pa and 10% lower compared to that of the model test, but the rise time and the duration of pressure from the numerical results were shown to be almost the same as the experimental ones. From the perspective of the efficiency of the numerical calculation, it was decided that the results of the numerical calculation were also meaningful even when the Courant number was 0.06. As we determined that the case when the Courant number = 0.06 was also significant for the efficiency of the numerical analysis, we used 0.06 for the Courant number to calculate the slamming of the ship.
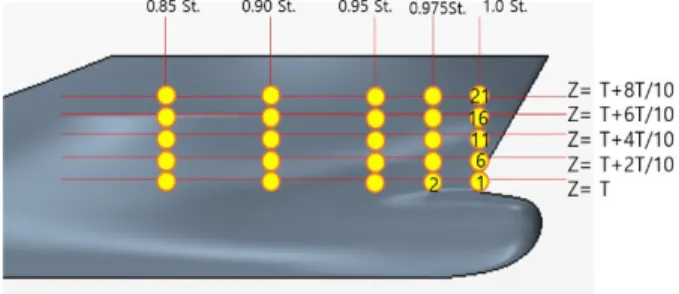
Fig. 9 Pressure measuring points of the numerical simulation
4. Results of the Numerical Calculations 4.1 Incident Wave and Ship Motion
In ships operating under rough sea conditions, the impact pressure is applied on the hull because of the rel-ative motion with incident waves. Hence, it is necessary to implement accurate incident waves for numerical simulations of slamming phenomena. Fig. 7 compares the wave elevation measured by the CFD and that obtained by a theoretical method at a 0.5 L distance away from the FP, in the direction of the entrance of the vessel towards the stern. As shown in this figure, it can be confirmed that the incident wave to be generated is properly implemented in the numerical simulation. This is because the waveform compensation using the EOM method and the generated grid system has the sufficient grid density per wave length and height.
In this study, motions of the vessel caused by 180° incident waves were performed in heave and pitch mo-tion as free condimo-tion in head sea, as shown in Fig. 8. For the stability of the numerical solumo-tion, the momo-tion of the ship was virtually forced for about 2 s. The pitch angle and heave motion of the ship change from −6.3° to 7.6° and from −0.103 m to 0.046 m with regular waves, respectively.
4.2 Bow Pressure
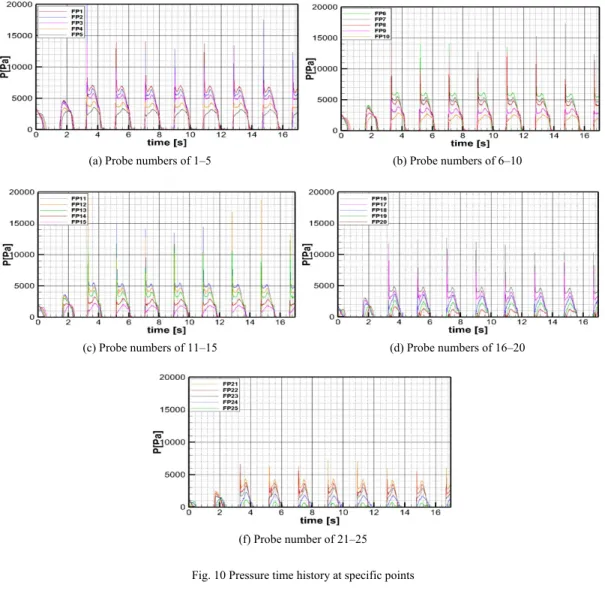
As shown in Fig. 9, it was divided into five sections from FP to 0.85 St. and into five sections based on the draft to measure the impact pressure. The bow impact pressure was measured at a total of 25 measuring points.
Fig. 10 shows the slamming pressure acting on the 25 points as described above. A high impact pressure of 10 kPa was mainly observed near the free surface, as shown in Figs. 10 (a–c). In the upper region, the im-pact pressure was not high, as shown in Figs. 10(d) and 10(f). The highest peak pressure was measured at FP 12 point around 14.75 s.
Fig. 8 Time history of the heave and pitch motion on the KCS ship (Vs = 5 knots, H = 20.7 m and T = 12.57 s)
Fig. 7 Comparison of the wave height generated by the CFD and theory methods (Vs = 5 knots, H = 20.7 m, and T = 12.57 s)
(a) Probe numbers of 1–5 (b) Probe numbers of 6–10
(c) Probe numbers of 11–15 (d) Probe numbers of 16–20
(f) Probe number of 21–25
Fig. 10 Pressure time history at specific points
Fig. 11 Pressure time history at FP12
Fig. 11 shows the time history of the pressure at the FP12 point where the maximum peak pressure is ob-served. As shown in the figure, the impact pressure temporarily increases and then disappears in region A.
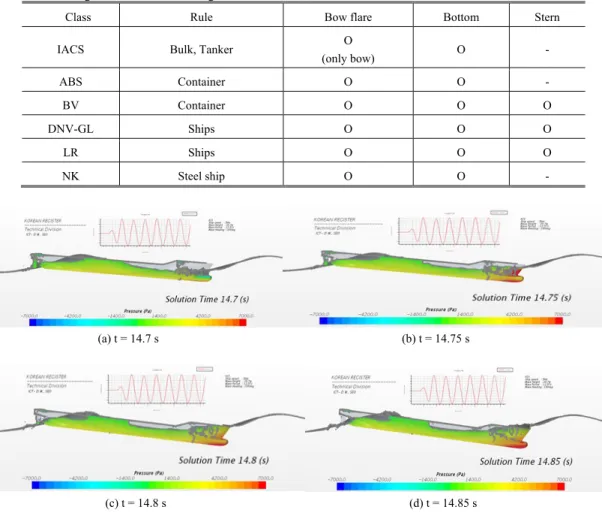
Table 5 Categorization of the slamming formulas in the classification
Class Rule Bow flare Bottom Stern
IACS Bulk, Tanker O
(only bow) O -ABS Container O O -BV Container O O O DNV-GL Ships O O O LR Ships O O O NK Steel ship O O -(a) t = 14.7 s (b) t = 14.75 s (c) t = 14.8 s (d) t = 14.85 s
Fig. 12 Pressure distributions and free surface
In region B, the static pressure is constantly maintained after the impact pressure has passed. The total du-ration time of the impact pressure is expressed as the sum of the rise time (trise) and drop time (tdrop), which
is about 0.023 s (0.13 s in the full scale). The duration time of the B region due to the static pressure is proximately 0.93 s (5.23 s in the full scale). The maximum peak pressure acting on the FP12 point is ap-proximately 18.75 kPa and is apap-proximately 592 kPa in the full scale.
5. Classification Rules
5.1 Slamming Pressure Formula for Each Classification
As shown in Table 5, each classification has proposed a formula of the slamming pressure acting on the hull. All formulas of the classification adequately take into account the water-entry impact pressure due to vertical relative motion and the breaking wave impact pressure due to the velocity component in the for-ward direction. In this study, the results of the predicated slamming pressure by IACS, ABS, BV, DNV, LR, and NK, which applied the rules for various classifications, were compared and reviewed.
The common structural rule (CSR) in the international classification society defines the bow slamming pressure equation, as shown in Eq (1). The CSR is a common rule developed to be applied to cargo ships and tankers, but it was also applied to container ships, the objects of this study, for relative comparison and
analysis. 2 im wl 1.025 sin FB FB FB P = f C V g (1)
where fFBis the coefficient of the impact pressure distribution in the longitudinal direction and Vim repre-sents the impact velocity, which is a function of LBP, Vs, and waterline angle. γwlmeans the flare an-gle(IACS, 2014).
The rule of the ABS classification provides an empirical formula of the bow slamming pressure due to the wave, and also provides the bow flare slamming pressure, as shown in Eq. (2) (ABS, 2016).
[
]
{
}
2 1/ 2 1 2 3 2 or (9 ) 1 ij oij bij oij Ri ij bij ij Vi ni P P P P k M h P k k C K M E = = -= + + (2)where MViis a function of LBP, Vs, and Cb; Kijis a function of the waterline angle and flare angle.
Un-like other classification rules, the breadth at the considered point is reflected, and this uniquely requires the breadth of the bow shape.
The rule of the BV classification provides an empirical formula of the bow flare slamming pressure, as shown in Eq. (3).
2
(0.22 0.15tan ) (0.4 sin )
FI S L Z
P =C C C + a ´ V b+ L (3)
The feature of this formula is that the characteristics of a structural part (Cs) are considered when calculat-ing the bow flare slammcalculat-ing pressure, but the length, direction, and location have no relation to the pressure (BV, 2017). The coefficient (Cz) that reflects the upward position is applied to consider relative motion, but the vessels of this study have all constant values.
Equation 4 is the empirical formula of the bow flare slamming pressure in the DNV-GL classification and is similar to the rule of BV.
(
)
(
)
22.2 0.4 sin 0.6
sl f
P =C +C ´ V b+ L (4)
where Cfis the factor that reflects the roll and pitch motion of the ship, and the design load of the rule should be referred to DNV-GL (2016).
In the LR classification, the empirical formula of the bow flare slamming pressure is provided, as shown in Eq. (5). The formula is a function of the coefficient considering the bow shape and the relative vertical velocity (LR, 2017)
(
2 2)
0.5
bf bf bf rv rv rv
IP = K V +K H V (5)
The empirical formula of the bow slamming pressure in the NK classification is defined, as shown in Eq. (6) (NK, 2016). 2 0 1 2 cos n e P v P rC K b æ ö = ç ÷ è ø (6)
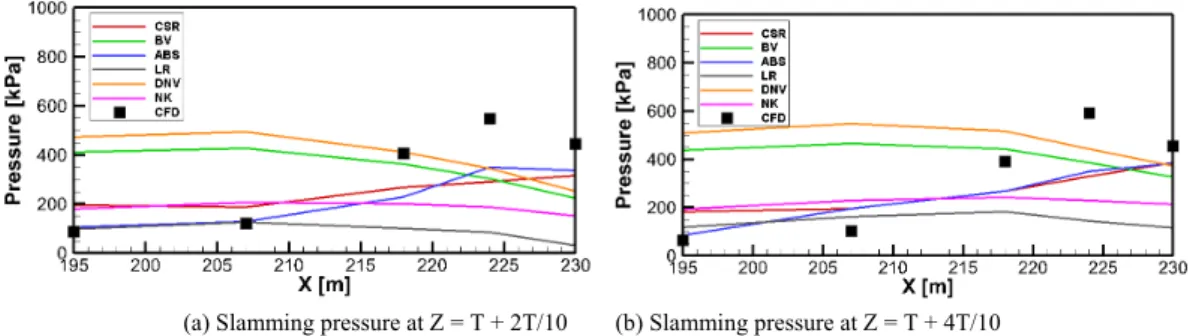
(a) Slamming pressure at Z = T + 2T/10 (b) Slamming pressure at Z = T + 4T/10
Fig. 13 Comparison of the slamming pressure calculated using various formulas of the classifications
5.1 Comparison of the Bow Flare Slamming Pressures
The empirical formulas in various classifications provide the quasi-static pressures without impact pres-sure. Hence, it is unreasonable to compare the maximum impact pressure calculated in CFD with the quasi-static pressure calculated using the prescript formula. Though it is decided insignificant to make the direct comparison of the absolute value of the quasi-static pressure proposed by a classification with the maxi-mum value of the dynamic pressure derived from numerical calculations, the maximaxi-mum value of the dy-namic pressure from the numerical calculations and the slamming pressure are shown in Fig. 13, to observe qualitative characteristics in investigating the tendency of the slamming pressure on the hull.
The numerical results show that the bow flare slamming pressure increases from 0.9 St. (X = 207 m) to FP (X = 230 m) and the maximum impact pressure is generated at 0.975 St. (X = 225 m). The tendency of the pressure to increase towards the forward direction was similar to the results of ABS and CSR. Except for other results of the ABS and CSR rules, it is found that the slamming pressure is rather decreased in the direction of the FP, which demonstrated a relatively different tendency from the results of the numerical calculations.
6. Conclusion
Prior to a numerical simulation on a container ship, a numerical calculation was conducted to examine the validities of the numerical code on a reliable model test. A numerical simulation was performed to predict the bow slamming pressure on the container ship under extreme wave conditions (H = 20.47 m and T = 12.57 s), and these results were compared to the empirical formulas of different classifications.
1) In order to obtain relatively quantitative numerical calculation results, the grid density (B/Ycell) should
be 120 or greater, and the Courant number should be 0.06 or smaller.
2) The position that generated the maximum impact pressure is around 0.95 St., and the maximum impact pressure is measured momentarily at FP12 near the bow region. The maximum peak pressure acting on the FP12 point is approximately 18.75 kPa and is approximately 592 kPa in the full scale. The duration time of the impact pressure is 0.13 sin the full scale. The static pressure continues to act as the bow descends below the free surface by pitch motion.
3) Though it is unreasonable to directly compare the absolute value of the quasi-static pressure proposed by a classification with the maximum value of the dynamic pressure derived from numerical calculations, from the point of view of qualitative tendency, the results of the ABS and CSR classifications showed that the impact pressure was significantly increased in the FP direction similar to the results of the numerical simulation.
Acknowledgements
This work was supported by the Industrial Strategic Technology Development Program (10073164) fund-ed by the Ministry of Trade, Industry & Energy.
References
Abdussamie, N., Amin, W., Ojeda, R., Thomas, G., and Drobyshevski, Y., 2014(a). Vertical Wave-in-Deck Loading and Pressure Distribution on Fixed Horizontal Decks of Offshore Platforms. The 24th
Interna-tional Offshore and Polar Engineering, Busan, South Korea.
Abdussamie, N., Ojeda, R., Amin, W., Thomas, G., and Drobyshevski, Y., 2014(b). Prediction of Wave-in-Deck Loads on Offshore Structures Using CFD. The 19th Australasian Fluid Mechanics Conference, Melbourne, Australia, 8–11.
ABS, 2016. Rules for building and classing Steel Vessels, Part 5C, Section 3.
ABS, 2002. A Direct Calculation Approach for Designing a ship-shaped FPSO’s Bow Against Wave
Slamming Load, Technical Report.
BV, 2017. Structure Rules for Container ships, Chapter 4, Section 5.
Chen, C.R. and Chen, H.C., 2014. CFD simulation of Extreme Slamming on a Containership in Random Waves. The 24thInternational Ocean and Polar Engineering Conference, Korea.
DNV-GL, 2016. Rule for Classificaion of Ships- Hull structural design Ships with length 100 meters and
above, Part.3 Chapter 1, Section 7.
Dobrovol'skaya, Z.N., 1969. On some problems of similarity flow of fluids with a free surface. Journal of Fluid Mechanics. 36, 805–829.
Hong, S.Y., Kyoung, J.H., Kim, Y.S., Song, K.-H., Kim, S., Malenica, S., Lindergren, M., Rathje, H., and Ge, C., 2008. Validation of wave loads on a large container ship in oblique waves. The 6th Osaka
Collo-quium on Seakeeping and stability of ships, Osaka, 109–117.
Hong, S.Y., Kim, K.H., Kim, B.W., and Kim, Y.S., 2014. Experimental Study on the Bow-Flare Slamming of a 10,000 TEU Containership. Proc. the 24th Int. Ocean and Polar Engineering Conference, Busan, Korea.
IACS, 2014. Common Structural Rules for Bulk Carriers and Oil Tankers, Part 1, Chapter 4, Section 5. Kim, K., Shin, Y.S., and Wang, W., 2008. A Stern Slamming Analysis Using Three-Dimensional CFD
Simulation. The 27th International Conference on Offshore Mechanics and Arctic Engineering, Estoril Portugal.
Kim, K.H., Lee, D.Y., Hong, S.Y., Kim, B.W., Kim, Y.S. and Nam, B.W., 2014. Experimental study on the water impact load on symmetric and asymmetric wedges, The 24th international Ocean and Polar
Engineering Conference, 15-20 June, Busan, Korea, 2014, ISOPE-I-14-336.
Lee, S. and Lew, J., 2015. Numerical Computations of Impact Forces Acting on Breakwater Plate of Bow Deck of Container Carrier. Journal of the Society of Naval Architects of Korea, 52(3), 198–205.
LR, 2017. Rules and Regulations for the classification of Naval Ships, Part 4, Chapter 2, Section 4.
Muzaferija, S., Peric M.P., Sames, P., and Schellin, T., 1998. A Two Fluid Navier-Stokes Solver to Simu-late WAter Entry, The 22nd Symposium on Naval Hydrodynamics, Washington D.C., USA, 638–651. NK, 2016. Rules for the Survey and Construction of Steel Ships, Part C, Chapter 6.
Ock, Y.B., 2014. Numerical Simulations of Added Resistance around Ships in Regular Head Waves using
Overset Grids, Master’s thesis, Department of Naval Architecture and Ocean Engineering, Pusan
Na-tional University.
Peric, M. and Zorn, T.: Simulation of sloshing loads on moving tanks, 2005. 24thInternational Conference
on Offshore Mechanics and Artic Engineering, 12-17 June, Halkidiki, Greece, 2005, OMAE2005-67581.
Von Kármàn, T., 1929. The impact on sea plane floats during landing. National Advisory Committee for
Aeronautics. Technical Note No 321, 309–313.
Wagner, H., 1932. Uber Stossund Gleitvergange an der Oberflache von Flussigkeiten. Z. Angew.
Mathe-matik and Mechanik. 12, 193–215.
Wang, S. and Guedes Soares, C., 2012. Analysis of the water impact of symmetric wedges with a multi-material eulerian formulation. International Journal of Maritime Engineering, 154 (A4), 191–206. Wang, S. and Guedes Soares, C., 2013. Slam induced loads on bow-flared sections with various roll angles.
Ocean Engineering, 67, 45–57.
Wang S. and Soares, C.G., 2016. Stern slamming of chemical tanker in irregular head waves, Ocean
Engi-neering, 122, 322–332.
Wang, R., Faltinsen, O.M., and Aarsnes, J.V., 1996. Water entry of arbitrary two-dimensional sections with and without flow separation, The 21stSymposium on Naval Hydrodynamics, 408–423.
Zhao, R. and Faltisen, O., 1998. Water Entry of Arbitrary Axisymmetric Bodies With and Without Flow Separation. The 22nd Symposium on Naval Hydrodynamics, Washington D.C., USA, 652–664.
![Table 1. Principal parameters of the container ship Ship Model Scale ratio 1 31.599 Lpp [m] 230 7.2786 B [m] 32.2 1.019 T [m] 10.8 0.3418 Δ [m3] 52030 1.649 LCG 111.6 3.532 VCG [m], from keel 14.322 0.453 Kxx/B 0.4 Kyy/Lpp, Kzz/Lpp 0.25](https://thumb-ap.123doks.com/thumbv2/123dokinfo/4885570.35819/2.799.122.680.122.356/table-principal-parameters-container-ship-model-scale-ratio.webp)