R E S E A R C H
Open Access
The relationship between visit-to-visit
variability in blood pressure and incidence
of metabolic syndrome: a general
population-based cohort study in Korea
Hyung Tak Lee
1, June Namgung
2, Young-Hyo Lim
3, Hwan-Cheol Park
3, Jin-Kyu Park
3and Jinho Shin
3*Abstract
Background: Previous studies demonstrated that visit-to-visit variability of blood pressure (BP) has significant relationship with cardiovascular disease. Visit-to-visit variability in BP might have prognostic value for cardiovascular disease. The aim of this study is to evaluate the effect of visit-to-visit variability in BP on development of metabolic syndrome in general population without cardiovascular disease, diabetes mellitus, metabolic syndrome, and BP medication.
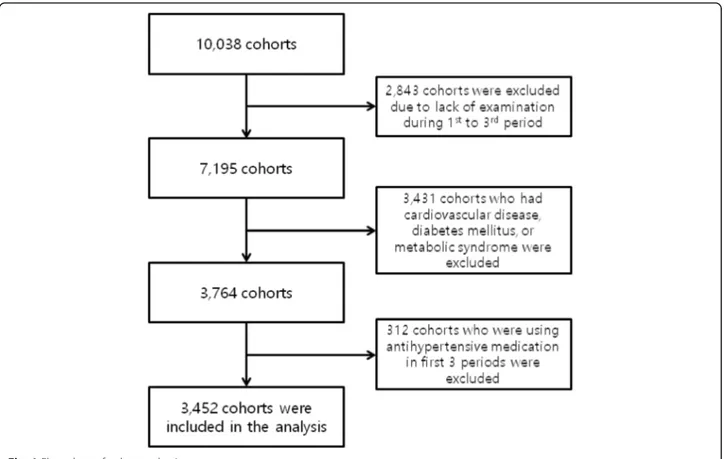
Method: We used data from the Korean Genome Epidemiology Study conducted by the Korean Centers for Disease Control and Prevention. All cohorts who were followed first 3 periods formed the basis of the study sample, which consisted of 7195 people. Of these samples, 3431 subjects who had cardiovascular disease, diabetes mellitus, or metabolic syndrome were excluded, and 312 subjects who were using antihypertensive medication in first 3 periods were excluded. Our final study sample consisted of 3452 cohorts.
Results: The mean age was 53.5 (8.25) years. The proportion of male was 50.2%. Average follow-up duration was 5.91 (0.17) years. In generalized estimating equation, the development of metabolic syndrome was associated with mean systolic BP (SBP) (Odd ratio (OR) 1.042, 95% confidence interval (CI) 1.035–1.048, p < 0.001), mean diastolic BP (DBP) (OR 1.058, 95% CI 1.049–1.069, p < 0.001), standard deviation (SD) of SBP (OR 1.036, 95% CI 1.017–1.055, p < 0.001), SD of DBP (OR 1.053, 95% CI 1.027–1.080, p < 0.001), and coefficient of variation (CV) of DBP (OR 1.025, 95% CI 1.005–1.046, p = 0.016) after adjusted for age, sex, and metabolic syndrome component. When mean SBP, mean DBP, SBP variability, and DBP variability were entered all together in the analysis model, SD of DBP (OR 1.033, 95% CI 1.003–1.063, p = 0.030) and CV of DBP (OR 1.027, 95% CI 1.004–1.051, p = 0.020) were significantly associated with the development of metabolic syndrome.
Conclusion: In general population without cardiovascular disease, diabetes mellitus, metabolic syndrome, and BP medication, SD of DBP and CV of DBP was associated with the development of metabolic syndrome. Visit-to-visit variability in DBP might be helpful for the prediction of future metabolic syndrome development. Keywords: Metabolic syndrome, Visit-to-visit variability, Blood pressure3
© The Author(s). 2019 Open Access This article is distributed under the terms of the Creative Commons Attribution 4.0 International License (http://creativecommons.org/licenses/by/4.0/), which permits unrestricted use, distribution, and reproduction in any medium, provided you give appropriate credit to the original author(s) and the source, provide a link to the Creative Commons license, and indicate if changes were made. The Creative Commons Public Domain Dedication waiver (http://creativecommons.org/publicdomain/zero/1.0/) applies to the data made available in this article, unless otherwise stated. * Correspondence:[email protected]
3Division of Cardiology, Departments of Internal Medicine, Hanyang
University, College of Medicine, 222 Wangsimni-ro Sungdong-gu, 133-792 Seoul, Republic of Korea
Background
The impact of increased blood pressure (BP) on cardio-vascular disease is well established. In a clinical setting, the prognostic value of BP is generally estimated by measuring mean BP. On the other hand, previous stud-ies demonstrated that visit-to-visit variability in BP also has significant relationship with cardiovascular disease [1–3]. In 1997, Suchy-Dicey et al. showed that higher visit-to-visit variability in BP is associated with increased risk for coronary artery disease during 11.6 years of follow-up [4]. In 2010, Rothwell et al., showed that in-creased visit-to-visit variability in BP is significant pre-dictor of stroke [5,6]. More recent studies showed that visit-to-visit variability in BP is associated with all-cause mortality [7]. However, exact mechanism by which visit-to-visit variability in BP is related with cardiovascu-lar risk remains unclear.
Previous studies showed that metabolic syndrome is pre-cursor of cardiovascular disease. A previous meta-analysis documented that metabolic syndrome is associated with in-creased risk for cardiovascular mortality, myocardial infarc-tion, and stroke [8]. Another meta-analysis study, in which analyzed longitudinal studies, revealed that metabolic syn-drome is significantly related to the cardiovascular event, coronary heart disease, and cardiovascular death [9]. There-fore, metabolic syndrome would be prodrome of cardiovas-cular disease. In this study, we hypothesized that the relationship between visit-to-visit variability in BP and car-diovascular disease is mediated by metabolic syndrome.
The aim of this study is to evaluate the effect of visit-to-visit variability in BP on development of meta-bolic syndrome in general population without cardiovas-cular disease, diabetes mellitus, metabolic syndrome, and BP medication.
Methods Cohorts
We used data from the Korean Genome Epidemiology Study (KoGES) conducted by the Korean Centers for Disease Control and Prevention. KoGES started in 2001 in two cities, and is an ongoing prospective study involv-ing a biennial examination. Ansung city and Ansan city represented rural and urban communities, respectively. Until now, KoGES has six periods. In first period, a total 10,038 cohorts were recruited. In Ansan, a total of 5020 subjects were recruited by telephone calls. The tele-phone calls were made to 10,957 randomly selected local telephone numbers requesting cohort participation. In Ansung, a total of 5018 subjects were recruited by using mailing, door-to-door visits, and telephone solicitations within five randomly selected local government regions (termed Myons in Korea) of the 11 divisions in the dis-trict. All cohorts who were followed first 3 periods with-out omission of examination formed the basis of the
study sample, which consisted of 7195 people. Of these samples, 3431 subjects who had cardiovascular disease, diabetes mellitus, or metabolic syndrome were excluded, and 312 subjects who were using antihypertensive medi-cation in first 3 periods were excluded. Our final study sample consisted of 3452 cohorts (Fig.1).
Follow-up
The cohort examinations were performed approximately 2 years interval. The first period, second period, third period, fourth period, fifth period, and sixth period were conducted from 2001 to 2003, 2003–2005, 2005–2006, 2007–2009, 2009–2010, and 2011–2012, respectively. We divided study time into two parts. From first period to third period, mean BP and visit-to-visit variability were taken, and from fourth to sixth period, subsequent follow-up was obtained. Average follow-up duration was 5.91 (0.17) years.
Measurements
Health examination at third period was used as baseline examination. Participants were seated for at least 5 min before BP measurement. BP measurements were re-peated after a 5 min interval. The arithmetic mean value of the two readings was used for analysis. Mercurial sphygmomanometers were used (CK-101, CHIN KOU Medical Instrument Co. Ltd., Taipei, Taiwan). The use of antihypertensive medication was assessed by an interviewer-administered questionnaire at baseline and at every visit in both the Ansan and Ansung cohorts. Blood samples of all participants were collected from the antecubital vein after at least 8 h of fasting. Enzymatic methods were applied to measure total cholesterol, high-density lipoprotein cholesterol, triglycerides, cre-atinine, and glucose (ADVIA 1650, Bayer Diagnostics, Tarrytown, NY, USA).
The metabolic syndrome was defined as subjects with three or more of the following criteria: 1) Waist circum-ference≥ 90 cm in men and ≥ 80 cm in women; 2) Serum triglycerides levels of ≥150 mg/dL or undergoing drug treatment for elevated serum triglycerides levels; 3) High-density lipoprotein cholesterol levels of < 40 mg/dL in men and < 50 mg/dL in women or undergoing drug treatment for low High-density lipoprotein cholesterol; 4) BP of at least 130/85 mmHg or undergoing antihyper-tensive drug treatment due to a history of hypertension; or 5) fasting blood glucose level of ≥100 mg/dL or undergoing drug treatment for elevated fasting blood glucose level [10].
Statistical analysis
All continuous variables were reported as mean values with standard deviations (SD) and categorical variables were presented as numbers and percentages. Visit-to-visit
variability in BP was quantified using the standard devi-ation (SD) and coefficient of varidevi-ation (CV). Logistic re-gression with generalized estimating equation models were used to test for the influence of BP variability on the prevalence of metabolic syndrome during follow-up. Base-line covariates used to obtain adjusted odds ratios in gen-eralized estimating equation models were age, sex, region, body mass index, creatinine, waist circumference, total cholesterol, triglyceride, high-density lipoprotein choles-terol, fasting glucose and smoking. Statistical analysis was performed using PASW 18.0 (SPSS, Chicago, IL, USA). A p < 0.05 (two-tailed) was considered to indicate a statisti-cally significant result.
Results
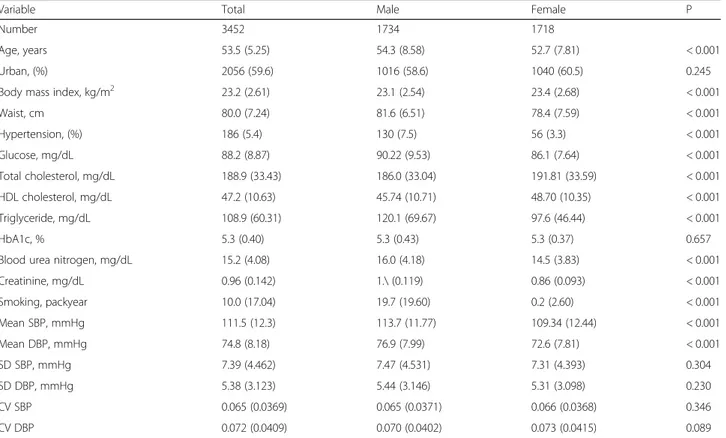
The mean age of the subjects was 53.5 (5.25) years, and the proportion of males was 50.2%. Of the total 3452 subjects, 2056 subjects were urban residents. The mean systolic BP (SBP) was 111.5 (12.3) mmHg, and the mean diastolic BP (DBP) were 74.8 (8.18) mmHg. The SD of SBP (SD SBP) and SD of DBP (SD DBP) were 7.39 (4.462) mmHg and 5.38 (3.123) mmHg, respectively. The CV of SBP (CV SBP) and CV of DBP (CV DBP) were 0.065 (0.0369) and 0.072 (0.0409). Further descrip-tive data are displayed in Table1.
Table2summarizes adjusted odds ratios for the devel-opment of metabolic syndrome from the multivariable generalized estimating equation models. The analysis models were adjusted baseline covariates as described above, but not adjusted for the other BP variables. When unadjusted for other BP variables, mean SBP, mean DBP, SD SBP, SD DBP, and CV DBP have significant positive correlation with the prevalence of metabolic syndrome.
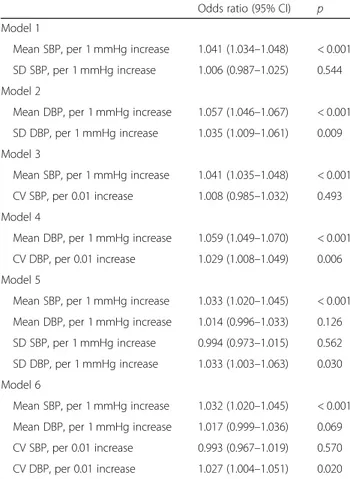
Table 3 shows the odds ratios for the development of metabolic syndrome from generalized estimating equa-tion models adjusted for other blood pressure variables. After adjustment for mean BP and other BP variables, SD DBP and CV DBP have positive relationship with the prevalence of metabolic syndrome. However, the rela-tionships of SD SBP and CV SBP with the prevalence of metabolic syndrome were not significant.
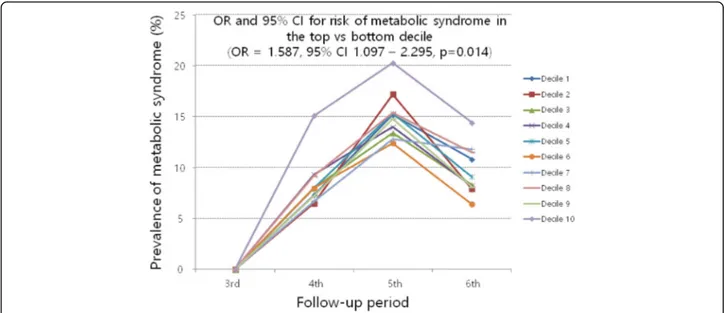
Figure 2 and Fig. 3 show the change in prevalence of metabolic syndrome during follow-up by decile of SD DBP and CV DBP. The overall prevalence of metabolic syndrome during fourth period, fifth period, and sixth period were 8.0, 14.7, and 9.5%, respectively. The preva-lence of metabolic syndrome decreased after fifth period. This result might be caused by cohort effect. SD DBP and CV DBP were split into deciles, and odds ratios of top deciles were calculated in relation to the bottom deciles. Top deciles of SD DBP and CV DBP have Fig. 1 Flow chart of cohorts selection
significantly higher odds ratios for the development of metabolic syndrome than bottom deciles.
Discussion
This study shows that in healthy subjects, visit-to-visit variability in DBP is associated with a development of metabolic syndrome. The association was independent
of mean BP value and other metabolic syndrome component.
Several studies demonstrated that in at risk population, visit-to-visit variability in SBP is significantly associated with future cardiovascular morbidity and mortality. Hsieh et al. study, in which 2161 type 2 diabetes mellitus sub-jects were followed for 5 years, showed that visit-to-visit
Table 1 General characteristics of cohorts
Variable Total Male Female P
Number 3452 1734 1718
Age, years 53.5 (5.25) 54.3 (8.58) 52.7 (7.81) < 0.001
Urban, (%) 2056 (59.6) 1016 (58.6) 1040 (60.5) 0.245
Body mass index, kg/m2 23.2 (2.61) 23.1 (2.54) 23.4 (2.68) < 0.001
Waist, cm 80.0 (7.24) 81.6 (6.51) 78.4 (7.59) < 0.001 Hypertension, (%) 186 (5.4) 130 (7.5) 56 (3.3) < 0.001 Glucose, mg/dL 88.2 (8.87) 90.22 (9.53) 86.1 (7.64) < 0.001 Total cholesterol, mg/dL 188.9 (33.43) 186.0 (33.04) 191.81 (33.59) < 0.001 HDL cholesterol, mg/dL 47.2 (10.63) 45.74 (10.71) 48.70 (10.35) < 0.001 Triglyceride, mg/dL 108.9 (60.31) 120.1 (69.67) 97.6 (46.44) < 0.001 HbA1c, % 5.3 (0.40) 5.3 (0.43) 5.3 (0.37) 0.657
Blood urea nitrogen, mg/dL 15.2 (4.08) 16.0 (4.18) 14.5 (3.83) < 0.001
Creatinine, mg/dL 0.96 (0.142) 1.\ (0.119) 0.86 (0.093) < 0.001 Smoking, packyear 10.0 (17.04) 19.7 (19.60) 0.2 (2.60) < 0.001 Mean SBP, mmHg 111.5 (12.3) 113.7 (11.77) 109.34 (12.44) < 0.001 Mean DBP, mmHg 74.8 (8.18) 76.9 (7.99) 72.6 (7.81) < 0.001 SD SBP, mmHg 7.39 (4.462) 7.47 (4.531) 7.31 (4.393) 0.304 SD DBP, mmHg 5.38 (3.123) 5.44 (3.146) 5.31 (3.098) 0.230 CV SBP 0.065 (0.0369) 0.065 (0.0371) 0.066 (0.0368) 0.346 CV DBP 0.072 (0.0409) 0.070 (0.0402) 0.073 (0.0415) 0.089
Values are presented as mean (SD) or numbers (percentages)
HDL high density lipoprotein, HbA1c glycosylated hemoglobin, SBP systolic blood pressure, DBP diastolic blood pressure, SD standard deviation, CV coefficient of variation
Table 2 Multivariable adjusted odds ratios for the development of metabolic syndrome from generalized estimating equation models unadjusted for other blood pressure variables
Odds ratio (95% CI) p
Model 1 Mean SBP, per 1 mmHg increase 1.042 (1.035–1.048) < 0.001
Model 2 Mean DBP, per 1 mmHg increase 1.059 (1.049–1.069) < 0.001
Model 3 SD SBP, per 1 mmHg increase 1.036 (1.017–1.055) < 0.001
Model 4 SD DBP, per 1 mmHg increase 1.053 (1.027–1.080) < 0.001
Model 5 CV SBP, per 0.01 increase 1.022 (0.998–1.047) 0.075
Model 6 CV DBP, per 0.01 increase 1.025 (1.005–1.046) 0.016
Baseline covariates are age, sex, region, body mass index, waist circumference, total cholesterol, triglyceride, high-density lipoprotein cholesterol, fasting glucose, and smoking
Model 1 included mean SBP and baseline covariates Model 2 included mean DBP and baseline covariates Model 3 included SD SBP and baseline covariates Model 4 included SD DBP and baseline covariates Model 5 included CV SBP and baseline covariates Model 6 included CV DBP and baseline covariates
variability in SBP, visit-to-visit variability in DBP, and visit-to-visit variability in mean BP are significantly associ-ated with all-cause mortality independent of mean BP [11]. Similarly, Okada et al. found that visit-to-visit vari-ability in SBP is positively correlated with diabetic ne-phropathy and atherosclerosis in patients with type 2 diabetes mellitus [12, 13]. In contrast, our study showed that visit-to-visit variability in DBP is significantly associ-ated with future development of metabolic syndrome in healthy population independent of mean BP, whereas, visit-to-visit variability in SBP is not associated with devel-opment of metabolic syndrome. Such differences between our study and other previous studies might be caused by different population. Our study population is free from
metabolic syndrome, diabetes mellitus, and cardiovascular disease. These results suggest that in healthy population, visit-to-visit variability in DBP might have more important role than visit-to-visit variability in SBP. However, the mechanisms for why only visit-to-visit variability in DBP should be related with the development of metabolic syn-drome in healthy population remain unclear.
There are some potential explanations for the relation-ship between visit-to-visit variability in DBP and devel-opment of metabolic syndrome. Franklin et al. study, which is based on the Framingham Heart Study, sug-gested that obesity is more strongly related with increase in DBP than increase in SBP [14]. Similarly, Liu et al. showed that increasing body mass index is associated with increase in DBP [15]. These previous studies sug-gest that metabolic syndrome is related with DBP, and we can hypothesize that metabolic syndrome is related with visit-to-visit variability in DBP. In addition, our study population is relatively young. Old people have lar-ger pulse pressure and lower diastolic pressure than young people [16]. In other word, young people have higher DBP than old people. A previous study suggested that high DBP is more prominent risk factor in younger people than older people [17]. Furthermore, high mean values have larger standard deviation than low mean values, and younger people may have higher mean DBP and larger visit-to-visit variability in DBP than older people. Therefore, in young population, visit-to-visit vari-ability in DBP might have potent effect on the develop-ment of metabolic syndrome. In predominantly younger populations compared to previous studies, significant as-sociations were present between visit-to-visit variability in DBP and metabolic syndrome.
This study excluded subjects who using BP medication. Recent studies suggested that the use of calcium-channel blockers lead to less visit-to-visit variability in BP than the use of angiotensin converting enzyme inhibitors, angioten-sin 2 receptor antagonists, and beta-blocker [5,6]. There-fore, our study shows the relationship between BP variability of unaffected by BP medication and develop-ment of metabolic syndrome. Because most of our study population is not hypertensive patient, we can hypothesize that the relationship between BP variability and develop-ment of metabolic syndrome is established in normal BP range. Previous studies suggested that increased arterial stiffness is associated with increased pulse pressure and increased BP variability [18, 19], and diabetes mellitus is related with increased arterial stiffness [20, 21]. In this viewpoint, increased arterial stiffness or increased BP vari-ability might be not only product of metabolic syndrome but also cause of metabolic syndrome.
The present study should be interpreted in context of some limitations. The major limitation of this study is number of BP measurement. As the number of BP
Table 3 Multivariable adjusted odds ratios for the development of metabolic syndrome from generalized estimating equation models adjusted for other blood pressure variables
Odds ratio (95% CI) p Model 1
Mean SBP, per 1 mmHg increase 1.041 (1.034–1.048) < 0.001 SD SBP, per 1 mmHg increase 1.006 (0.987–1.025) 0.544 Model 2
Mean DBP, per 1 mmHg increase 1.057 (1.046–1.067) < 0.001 SD DBP, per 1 mmHg increase 1.035 (1.009–1.061) 0.009 Model 3
Mean SBP, per 1 mmHg increase 1.041 (1.035–1.048) < 0.001 CV SBP, per 0.01 increase 1.008 (0.985–1.032) 0.493 Model 4
Mean DBP, per 1 mmHg increase 1.059 (1.049–1.070) < 0.001 CV DBP, per 0.01 increase 1.029 (1.008–1.049) 0.006 Model 5
Mean SBP, per 1 mmHg increase 1.033 (1.020–1.045) < 0.001 Mean DBP, per 1 mmHg increase 1.014 (0.996–1.033) 0.126 SD SBP, per 1 mmHg increase 0.994 (0.973–1.015) 0.562 SD DBP, per 1 mmHg increase 1.033 (1.003–1.063) 0.030 Model 6
Mean SBP, per 1 mmHg increase 1.032 (1.020–1.045) < 0.001 Mean DBP, per 1 mmHg increase 1.017 (0.999–1.036) 0.069 CV SBP, per 0.01 increase 0.993 (0.967–1.019) 0.570 CV DBP, per 0.01 increase 1.027 (1.004–1.051) 0.020
Baseline covariates are age, sex, region, body mass index, waist circumference, total cholesterol, triglyceride, high-density lipoprotein cholesterol, fasting glucose, and smoking
Model 1 included mean SBP, SD SBP, and baseline covariates Model 2 included mean DBP, SD DBP, and baseline covariates Model 3 included mean SBP, CV SBP, and baseline covariates Model 4 included mean DBP, CV DBP, and baseline covariates Model 5 included mean SBP, mean DBP, SD SBP, SD DBP, and baseline covariates
Model 6 included mean SBP, mean DBP, CV SBP, CV DBP, and baseline covariates
CI confidence interval, SBP systolic blood pressure, DBP diastolic blood pressure,SD standard deviation, CV coefficient of variation
measurement increase, so do the reliability of visit-to-vi-sit variability in BP [22, 23]. Moreover, the effect of visit-to-visit variability in BP on clinical outcome is in-crease as the number of BP measurement is inin-crease [23]. In this study, visit-to-visit variability in BP was cal-culated from three measurement of BP. Although our sample size is relatively large, the effect of visit-to-visit variability in BP on clinical outcome might be underesti-mated. In addition, the present study only shows the
association between visit-to-visit variability in BP and fu-ture development of metabolic syndrome. Underlying mechanism of the relationship between visit-to-visit vari-ability in BP and the development of metabolic syn-drome is not clear. Obesity and physical inactivity might be a part of the mechanism. Faramawi et al. suggested that obesity is related with increase in visit-to-visit vari-ability in BP [24]. However, in this study, the relation-ships of visit-to-visit variability in DBP with change in Fig. 2 Prevalence of metabolic syndrome during follow-up by decile of SD DBP. Statistical values were derived from generalized estimating equation adjusted for age, sex, region, body mass index, waist circumference, total cholesterol, triglyceride, high-density lipoprotein cholesterol, fasting glucose, smoking, mean SBP, mean DBP, and SD SBP. OR, odds ratio; CI, confidence interval; SD, standard deviation; DBP, diastolic blood pressure; SBP, systolic blood pressure
Fig. 3 Prevalence of metabolic syndrome during follow-up by decile of CV DBP. Statistical values were derived from generalized estimating equation adjusted for age, sex, region, body mass index, waist circumference, total cholesterol, triglyceride, high-density lipoprotein cholesterol, fasting glucose, smoking, mean SBP, mean DBP, and CV SBP. OR, odds ratio; CI, confidence interval; CV, coefficient of variation; DBP, diastolic blood pressure; SBP, systolic blood pressure
BMI, waist circumference or other individual metabolic syndrome component were not significant (data not shown). BP is itself one component of metabolic syn-drome. Therefore, the statistically insignificant relation-ship between visit-to-visit variability in DBP and change in obesity component might be caused by exclusion of BP component. Because the association is not necessarily causal, further study is warranted to determine the underlying mechanisms.
Conclusion
In general population without cardiovascular disease, dia-betes mellitus, metabolic syndrome, and BP medication, future development of metabolic syndrome is related with visit-to-visit variability in DBP, but not with visit-to-visit variability in SBP. These relationships are independent of mean BP and other metabolic syndrome component. Visit-to-visit variability in DBP might be predictive for fu-ture development of metabolic syndrome.
Abbreviations
BP:Blood pressure; CV DBP: Coefficient of variation of diastolic blood pressure; CV SBP: Coefficient of variation of systolic blood pressure; CV: Coefficient of variation; DBP: Diastolic blood pressure; KoGES: Korean Genome Epidemiology Study; SBP: Systolic blood pressure; SD DBP: Standard deviations of diastolic blood pressure; SD SBP: Standard deviations of systolic blood pressure; SD: Standard deviations
Acknowledgements
Data in this study were from the Korean Genome and Epidemiology Study (KoGES; 4851-302). National Research Institute of Health, Centers for Disease Control and Prevention, Ministry for Health and Welfare, Republic of Korea.
Funding Not applicable.
Availability of data and materials Not applicable.
Authors’ contributions
HTL analyzed the data and contributed to the writing of the manuscript. JHS contributed to the interpretation of data and to the writing of the manuscript. JN, Y-HL, H-CP, and J-KP contributed to the analysis of data. All authors read and approved the final manuscript
Ethics approval and consent to participate
The institutional review board of Hanyang University Hospital has approved the current study.
Consent for publication Not applicable.
Competing interests
The authors declare that they have no competing interests.
Publisher’s Note
Springer Nature remains neutral with regard to jurisdictional claims in published maps and institutional affiliations.
Author details
1Departments of Internal Medicine, Gumdan Top General Hospital, Incheon,
Republic of Korea.2Division of Cardiology, Department of Internal Medicine, Inje University Ilsan Paik Hospital, Goyang, Republic of Korea.3Division of
Cardiology, Departments of Internal Medicine, Hanyang University, College of Medicine, 222 Wangsimni-ro Sungdong-gu, 133-792 Seoul, Republic of Korea.
Received: 6 March 2019 Accepted: 18 April 2019
References
1. Suchy-Dicey AM, et al. Blood pressure variability and the risk of all-cause mortality, incident myocardial infarction, and incident stroke in the cardiovascular health study. Am J Hypertens. 2013;26(10):1210–7. 2. Vishram JK, et al. Blood pressure variability predicts cardiovascular events
independently of traditional cardiovascular risk factors and target organ damage: a LIFE substudy. J Hypertens. 2015;33(12):2422–30.
3. Rossignol P, et al. Increased visit-to-visit blood pressure variability is associated with worse cardiovascular outcomes in low ejection fraction heart failure patients: insights from the HEAAL study. Int J Cardiol. 2015;187:183–9. 4. Grove JS, et al. Variability in systolic blood pressure--a risk factor for
coronary heart disease? Am J Epidemiol. 1997;145(9):771–6.
5. Webb AJ, et al. Effects of antihypertensive-drug class on interindividual variation in blood pressure and risk of stroke: a systematic review and meta-analysis. Lancet. 2010;375(9718):906–15.
6. Rothwell PM, et al. Effects of ß blockers and calcium-channel blockers on within-individual variability in blood pressure and risk of stroke. Lancet Neurol. 2010;9(5):469–80.
7. Muntner P, et al. The relationship between visit-to-visit variability in systolic blood pressure and all-cause mortality in the general population findings from NHANES III, 1988 to 1994. Hypertension. 2011;57(2):160–6. 8. Mottillo S, et al. The metabolic syndrome and cardiovascular risk: a
systematic review and meta-analysis. J Am Coll Cardiol. 2010;56(14):1113–32. 9. Gami AS, et al. Metabolic syndrome and risk of incident cardiovascular
events and death: a systematic review and meta-analysis of longitudinal studies. J Am Coll Cardiol. 2007;49(4):403–14.
10. Grundy SM, et al. Diagnosis and management of the metabolic syndrome: an American Heart Association/National Heart, Lung, and Blood Institute scientific statement. Circulation. 2005;112(17):2735–52.
11. Hsieh YT, et al. Visit-to-visit variability in blood pressure strongly predicts all-cause mortality in patients with type 2 diabetes: a 5.5-year prospective analysis. Eur J Clin Investig. 2012;42(3):245–53.
12. Okada H, et al. Visit-to-visit blood pressure variability is a novel risk factor for the development and progression of diabetic nephropathy in patients with type 2 diabetes. Diabetes Care. 2013;36(7):1908–12.
13. Okada H, et al. Visit-to-visit variability in systolic blood pressure is correlated with diabetic nephropathy and atherosclerosis in patients with type 2 diabetes. Atherosclerosis. 2012;220(1):155–9.
14. Franklin SS, et al. Predictors of new-onset diastolic and systolic
hypertension: the Framingham heart study. Circulation. 2005;111(9):1121–7. 15. Liu F, et al. Prevalence of isolated diastolic hypertension and associated risk
factors among different ethnicity groups in Xinjiang, China. PLoS One. 2015; 10(12):e0145325.
16. Franklin SS, et al. Hemodynamic patterns of age-related changes in blood pressure. The Framingham heart study. Circulation. 1997;96(1):308–15. 17. Li Y, et al. Cardiovascular risks associated with diastolic blood pressure and
isolated diastolic hypertension. Curr Hypertens Rep. 2014;16(11):489. 18. Nagai M, et al. Visit-to-visit blood pressure variations: new independent
determinants for carotid artery measures in the elderly at high risk of cardiovascular disease. J Am Soc Hypertens. 2011;5(3):184–92. 19. Shimbo D, et al. Associations of aortic distensibility and arterial elasticity
with long-term visit-to-visit blood pressure variability: the multi-ethnic study of atherosclerosis (MESA). Am J Hypertens. 2013;26(7):896–902.
20. Salomaa V, et al. Non-insulin-dependent diabetes mellitus and fasting glucose and insulin concentrations are associated with arterial stiffness indexes. The ARIC study. Atherosclerosis risk in communities study. Circulation. 1995;91(5):1432–43.
21. Urbina EM, et al. Increased arterial stiffness is found in adolescents with obesity or obesity-related type 2 diabetes mellitus. J Hypertens. 2010;28(8):1692–8. 22. Rothwell PM. Limitations of the usual blood-pressure hypothesis and
importance of variability, instability, and episodic hypertension. Lancet. 2010;375(9718):938–48.
23. Rothwell PM, et al. Prognostic significance of visit-to-visit variability, maximum systolic blood pressure, and episodic hypertension. Lancet. 2010; 375(9718):895–905.
24. Faramawi MF, et al. Obesity is associated with visit-to-visit systolic blood pressure variability in the US adults. J Public Health (Oxf). 2015;37(4):694–700.