Print ISSN: 2288-4637 / Online ISSN 2288-4645 doi:10.13106/jafeb.2021.vol8.no6.0809
Determinants of Firm Value: An Empirical Study
of Listed Trading Companies in Vietnam
Lan NGUYEN1, Thi Khanh Phuong TAN2, Thu Ha NGUYEN3
Received: March 10, 2021 Revised: May 08, 2021 Accepted: May 15, 2021
Abstract
This study aims to investigate the importance of firm value and the factors that affect the firm value of trading companies listed on the Vietnamese stock exchange, thereby enhancing the current literature related to this topic in our country. The factors that affect firm value include firm size, capital structure, profitability, sales, and liquidity whereas firm value is represented by the value of equity. This work employed a data set with 925 observations, which are trading firms listed on the Vietnam Stock Exchange over a nine-year period from 2011 to 2019 with the support of STATA version 2016. Applying the quantitative method, we first find that firm size is of the greatest importance to firm value. It refers that the value of a large company is of a higher rank than a small company. On the other hand, capital structure is found to have a negative impact on firm value. Furthermore, we find that the other independent variables (profitability, sales, and liquidity) are statistically insignificant in the regression model. This means that those mentioned factors do not affect firm value. More importantly, the research also suggests that both firm size and capital structure are crucial for firm value in the trading industry in Vietnam.
Keywords: Firm Value, Profitability, Capital Structure, Firm Size, Listed Trading Firms JEL Classification Code: G29, G39, L25
Therefore, understanding what factors influence firm value and to what extent is this relationship is a crucial question.
To date, there has been a great number of studies addressing these questions (Endri & Fathony, 2020; Nguyen & Bui, 2020; Aggarwal & Padhan, 2017; Adenugba et al., 2016; Chen & Chen, 2011; Dang et al., 2019; Sudiyatno let al., 2020; Burgstahler & Dichev, 1997). For example, Sudiyatno et al. (2020) found that there are both internal and external factors influencing firm value. The internal factors include capital structure, profitability, free cash flow, firm size, liquidity, ownership structure whereas external factors comprise interest rates, inflation, and other macro-indicators. However, several arguments have been arising due to the different research findings on the correlation between those variables. For example, Aggarwal and Padhan (2017) and Dang et al. (2019) showed that firm size significantly influences firm value while several authors suggest a reverse pattern (Endri & Fathony, 2020). Chen and Chen (2011) believed that capital structure is negatively associated with firm value whereas Adenugba et al. (2016) witness a positivity. To address this argument, this study will provide more evidence on the determinants of firm value in Vietnam.
In this study, we analyze the correlation between five independent variables and firm value, which is measured
1 First Author and Corresponding Author. Faculty of Accounting and
Auditing, Van Lang University, Ho Chi Minh City, Vietnam [Postal Address: 45 Nguyen Khac Nhu street, Co Giang Ward, District 1, Ho Chi Minh city, 700000, Vietnam] Email: [email protected]
2 Faculty of Finance, University of Economics, The University of
Danang, Danang, Vietnam.
3 Faculty of Planning and Development, National Economics
University, Hanoi, Vietnam. © Copyright: The Author(s)
This is an Open Access article distributed under the terms of the Creative Commons Attribution Non-Commercial License (https://creativecommons.org/licenses/by-nc/4.0/) which permits unrestricted non-commercial use, distribution, and reproduction in any medium, provided the original work is properly cited.
1. Introduction
Firm value has attracted great attention of prior and current researchers in the world (Endri & Fathony, 2020; Nguyen & Bui, 2020; Aggarwal & Padhan, 2017; Burgstahler & Dichev, 1997) as it can tell a lot about the effectiveness of an organization and reflect the growth of that organization in the long-term (Sampurna & Romawati, 2020; Shah & Khalidi, 2020). Rational investors look at this indicator as a signal for making investment decisions because of the significant correlation between firm value and earnings (Collins et al., 1997; Burgstahler & Dichev, 1997).
by the book value of equity. These independent variables are firm size (Saona & Martín, 2016; Aggarwal & Padhan, 2017; Dang et al., 2019; Hirdinis, 2019), profitability (Endri & Fathony, 2020; Rizqia & Sumiati, 2013; Dang et al., 2019; Muhammad et al., 2015), liquidity (Nguyen & Bui, 2020; Anton, 2016; Aggarwal & Padhan, 2017), firm sales (Himmelberg et al., 1999; Mule et al., 2015), and capital structure (Rizqia & Sumiati, 2013; Hirdinis, 2019; Jong et al., 2011; Pérez-González & Yun, 2013). Subsequently, we measured to what extent these variables can affect the value of listed trading firms in Vietnam. We find that firm size is positively related to firm value while capital structure witnesses a reverse pattern. The other independent variables, including profitability, liquidity, and sales are not statistically significant. Based on the results, it can be said that to increase firm value, the organization should expand the business by increasing firm size while lowering the leverage ratio.
Our study is organized as follows. Section 2 presents a brief review of literature related to the research questions. Section 3 develops hypotheses, describes variables that are used in the empirical model, and describes our data collection process. The results are presented in Section 4, while Section 5 concludes the study and gives some implications on further research.
2. Literature Review and Hypotheses
2.1. Previous StudiesThere are several arguments about how firm value can be measured. Firm value is reflected in stock price (Endri & Fathony, 2020; Shah & Khalidi, 2020), in the market value of equity (Surjandari et al., 2019; Nguyen & Bui, 2020), or book market of equity (Saona & Martín, 2016). In this research, we use the book value of equity to measure firm value since this value usually remains constant over time while market value or stock price fluctuates significantly.
Book value of equity or equity value is one of the most important indicators for investors assessing the market value of a company to make investment decisions. This is because the firm value is a signal of growing opportunities in the future (Sampurna & Romawati, 2020; Shah & Khalidi, 2020) and could reflect the organizational effectiveness. However, several criticisms have been arising because academics and practitioners have been being concerned about the profit manipulation and diminishing value relevance of accounting information (Dechow et al., 1995; Filip & Raffournier, 2010). Particularly, empirical evidence shows that the criticisms about the relevance of earnings have some elements of truths, but academics and practitioners sometimes exaggerate the problems as firm value is positively correlated with earnings (Basu, 1997; Amir & Lev, 1996; Elliott & Hanna, 1996).
Collin et al. (1997) suggested that the value relevance of earnings has declined over time while that of book value has constantly increased.
About the determinants of firm value, Anton (2016), Aggarwal and Padhan (2017), Dang et al. (2019), and Sampurna and Romawati (2020) demonstrated that firm size strongly and positively impacts firm value, whereas some other authors have rejected that finding (Mule et al., 2015; Endri & Fathony, 2020). Besides the company’s size, the capital structure also directly and significantly influences firm value, however, they are negatively correlated (Dang et al., 2019; Sampurna & Romawati, 2020; Shah & Khalidi, 2020). Furthermore, profitability is also considered as the factor that significantly impacts firm value, such as the research of Aggarwal and Padhan (2017) and Rizqia and Sumiati (2013). In contrast, Hirdinis (2019) and Anton (2016) believed that profitability is not correlated with firm value. Moreover, the sale is demonstrated to positively impact firm value (Niresh & Velnampy, 2014; Nguyen & Bui, 2020; Mule et al., 2015). Similarly, liquidity is closely correlated with firm value, as cited by Nguyen and Bui (2020).
In conclusion, this study will identify the impact of five factors on firm value, comprising firm size, capital structure, firm sales, profitability, and liquidity (Figure 1).
2.2. Hypotheses
We use the natural logarithm of total assets to measure the firm size, based on the studies of Saona and Martín (2016), and Aggarwal and Padhan (2017). Some studies recently have shown that size and the value of a company are significantly and positively correlated (Dang et al., 2019; Aggarwal & Padhan, 2017; Sampurna & Romawati, 2020; Anton, 2016). To support this opinion, Hirdinis (2019) stated that the bigger the company’s size will indirectly lead to an increase in firm value. However, the studies of Obradovich and Gill (2013), Saona and Martín (2016), and Shah and Khalidi (2020) have argued that firm size has a negative influence on firm value. In contrast, research by Mule et al. (2015) and Endri and Fathony (2019) indicated that the
Firm size Capital structure Firm sales Profitability Liquidity Firm value
company’s size does not have a significant impact on firm value. The hypothesis is as below:
H1: Firm size is positively correlated with firm value. Capital structure is one of the most predominant tools that reflects an organization’s effectiveness in using debt (Endri & Fathony, 2020). This structure is determined by the ratio between the book value of total debt and equity. Many authors have previously researched the connection between capital structure and a company’s value; however, those authors’ results are contradictory. On one side, it is shown that capital structure has a beneficial effect on firm value (Rizqia & Sumiati, 2013; Hirdinis, 2019; Jong et al., 2011; Pérez-González & Yun, 2013), others conclude that this relationship has a negative correlation (Dang et al., 2019; Shah & Khalidi, 2020; Sampurna & Romawati, 2020). However, according to trade-off theory, once the debt is utilized appropriately, the higher amount of debt will lead to a higher firm value (Hirdinis, 2019; Myers, 1977). As stated by Durand (1952), the company is likely to use more debt to gain firm value. The hypothesis is as below:
H2: Capital structure is positively correlated with firm value.
Profitability is calculated as net profit divided by total assets (Anton, 2016; Rizqia & Sumiati, 2013; Endri & Fathony, 2020). The previous papers identified that a higher level of profitability results in greater firm value (Aggarwal & Padhan, 2017; Rizqia & Sumiati, 2013; Dang et al., 2019). According to Endri and Fathony (2020), when the firm has high profitability, which reflects its business status as good, investors will be more interested in the firm’s share to increase firm value. However, Hirdinis (2019) and Anton (2016) have pointed out that profitability does not affect firm value. The hypothesis is as below:
H3: Profitability is positively correlated with firm value. Firm sales’ value is measured as the natural logarithm of total sales revenue (Himmelberg et al., 1999; Mule et al., 2015; Nguyen & Nguyen, 2020). Many prior authors point that besides total assets, total sales are also the indicator of the firm size (Niresh & Velnampy, 2014; Nguyen & Bui, 2020; Mule et al., 2015).The hypothesis is as below:
H4: Firm sales are positively correlated with firm value. According to Nguyen and Bui (2020), liquidity is defined as the firm’s ability to pay short-term debts. To calculate liquidity value, divide current assets by current liabilities
(Anton, 2016; Machmuddah et al., 2020). Previous studies have adverse conclusions about the relationship between firm value and liquidity. While Anton (2016) indicated that liquidity has no significant impact on firm value. Aggarwal and Padhan (2017) showed that liquidity positively affects firm value. It can be argued a higher current ratio correlates with the firm’s ability to pay debts quicker and increases the firm’s value (Nguyen & Bui, 2020). Therefore, the hypothesis is as below:
H5: Liquidity is positively correlated with firm value.
3. Research Methods
3.1. Data
To collect data, the first step was accessing the Vietstock. finance website to define Vietnamese listed companies. Based on the criteria for the classification of trading of firms in the stock market in HOSE, we choose financials, consumer staples, real estate, industrials, materials, consumer discretionary, utilities, energy, health care, and information technology. Next, we collected and synthesized data from the financial annual reports of those listed firms and imported the data into Excel 2016. However, to ensure the accuracy of data, we compared those data with data that was announced on HNX and HOSE, over the period 2011–2019.
After the data was collected, we calculated the indicators that are related to research, such as firm size, capital structure, firm sales, profitability, and liquidity. Because some observations do not have enough values to calculate those indicators, we removed those observations from the data. As a result, our final data included 925 observations of 239 listed companies.
After finishing data processing, 925 observations are imported into STATA version 16 for descriptive statistics and regression analysis. More specifically, through descriptive statistics, we can know the max value, min value, and medium value. Besides, regression analysis fixed-effect model and random-effect model in STATA is realized to choose the model that is the most suitable for research. Simultaneously, through regression analysis’s result, we can know the factors that impact firm value.
3.2. Empirical Models
In this study, the authors will follow the method of quantitative research (with the assistance of STATA version 2015): Firm size (SIZE), capital structure (CS), profitability (ROA), revenue (SALES), and liquidity (LIQUID) as independent variables, firm value (VAL) as a dependent variable.
To test the hypotheses mentioned in Section 2, the regression model can be built as below:
VAL = α + β1 × Size + β2 × CS + β3 × ROA
+ β4 × Sales + β5 × Liquid + µ
Where, α, β1, β2, β3, β4, β5 are coefficients and µ is
random error.
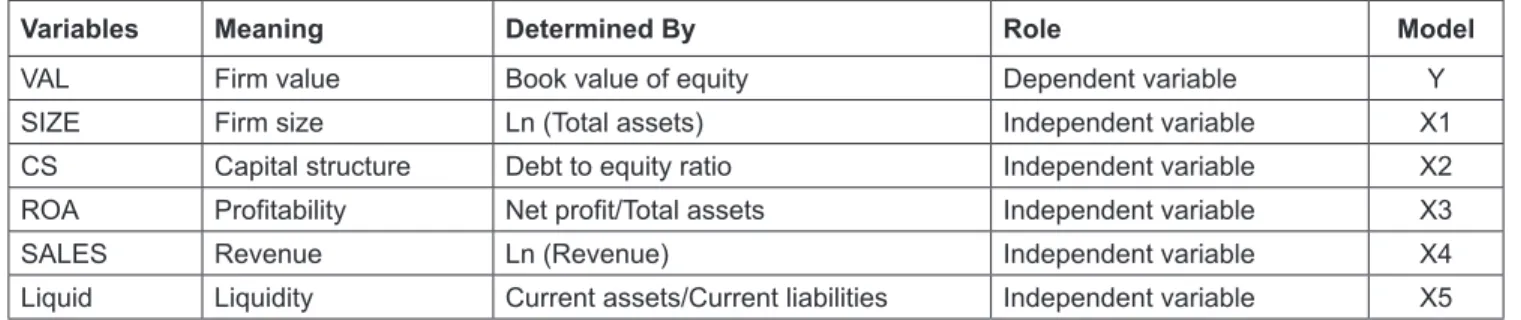
Table 1 illustrates the meaning and the role of different variables.
4. Results
In Table 2, we can see that the value of R-square is 0.3784, indicating that 37.84 of the change in firm value is
explained by firm size, capital structure, profitability, sales, and liquidity in the random-effect model. The value of prob is 0.000, which indicates that the model has a statistical significance.
Considering the coefficient’s values, we can find the relation between independent variables and dependent variables. More specifically, these coefficient values show that SIZE, ROA, and Liquidity have a positive effect on equity, while CS and SALE have a negative effect on equity. Next, with a reliability of 95%, there are only two variables that are statistically significant in the random-effect model, SIZE, and CS, as their p-values are less than 0.05. In contrast, ROA, SALE, and Liquidity have no statistical significance since their p-values are 0.751, 0.546, and 0.985 respectively, which are all more than 0.05.
Table 1: List of Dependent and Independent Variables of the Regression Models
Variables Meaning Determined By Role Model
VAL Firm value Book value of equity Dependent variable Y
SIZE Firm size Ln (Total assets) Independent variable X1
CS Capital structure Debt to equity ratio Independent variable X2 ROA Profitability Net profit/Total assets Independent variable X3
SALES Revenue Ln (Revenue) Independent variable X4
Liquid Liquidity Current assets/Current liabilities Independent variable X5
Table 2: REM Result
. xtreg Equity SIZE CS ROA SALE Liquid, re Random-effects GLS regression Group variable: STT R-sq: Within = 0.0534 Between = 0.3860 Overall = 0.3784 corr (u_i, x) = 0 (assumed)
Number of obs = 925 Number of groups = 239 Obs per group:
min = 1 avg = 3.9 max = 4 Wald χ2 (5) = 110.37
Prob > χ2 = 0.000
Equity Coef. Std. Err. z P > |z| [95% Conf. Interval]
SIZE 388613.6 41100.43 9.46 0.000 308058.3 496169 CS −5014.927 1909.088 −2.63 0.009 −8756.671 −1273.183 ROA 47558.41 149685.8 0.32 0.751 −245820.4 34937.2 SALE −14583.67 24169.04 −0.6 0.546 −61954.13 32786.78 Liquid 4.588347 236.2718 0.02 0.985 −458.496 467.6727 _cons −4050767 489252.6 −8.28 0.000 −5009685 −3091850 sigma_u 1898626.3 sigma_e 353214.22
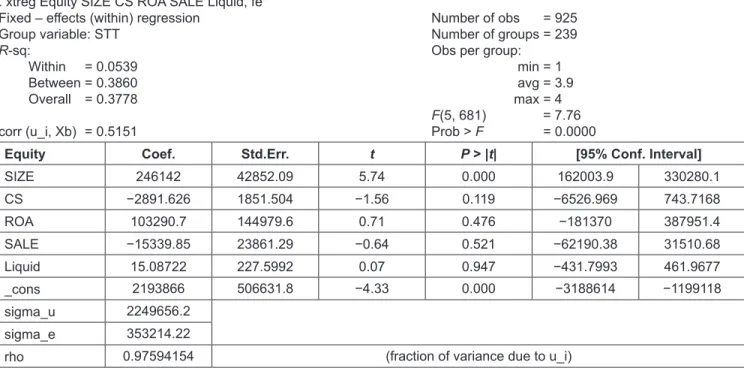
In Table 3, it can be seen that the value of R-square is 0.3778, which indicates that independent variables (SIZE, CS, ROA, SALE, Liquid) in the fixed-effect model explain 37.78 percent of the change in the EQUITY variable. Besides, the value of prob is 0.000 > F, meaning that the model has a statistical significance.
Considering the coefficient’s values, we can find the relation between independent variables and dependent variable. In detail, the coefficient values indicate that SIZE, ROA, and Liquid positively affect EQUITY; however, CS (Capital structure) and SALE are negatively associated with EQUITY. More importantly, with a reliability of 95%, only SIZE is statistically significant in the model because its P-value is less than 0.05. On the other hand, CS, ROA, SALE, and Liquidity have no statistical significance as their -values are 0.119, 0.476, 0.521, 0.947 respectively, which are all higher than 0.05 (Table 4).
From the Heteroskedasticity test (Table 5) and auto-correlation test (Table 6), it is clear that the fixed effect model has two disabilities, which are, error variance is non-constant and first-order autocorrelation, therefore we use adjusted fixed model (FEM*)
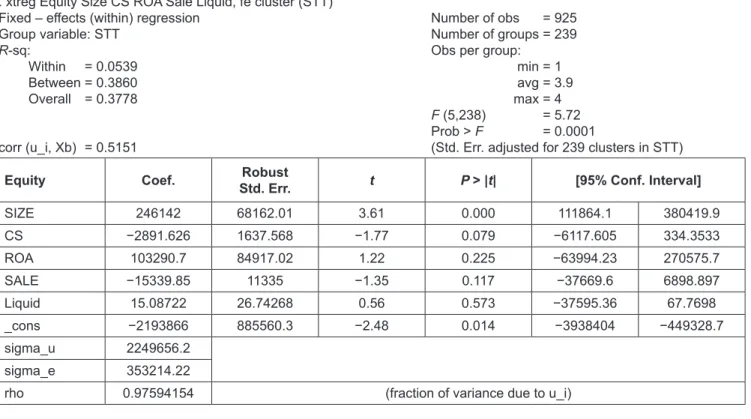
From Table 7, it can be seen that the value of R-square is 0.3778, indicating that all of the independent variables in the fixed-effect model explain 37.78 percent of the change in the dependent variable EQUITY. Also, the value of prob
is 0.0001, which means that the model has a statistical significance.
The coefficient values reflect the relation between five independent variables and dependent variables. As can be seen from the table above, SIZE, ROA, and Liquidity are the independent variables that have a positive impact on EQUITY. The variables CS and SALE are negatively correlated with equity. More importantly, with a reliability of 95%, only SIZE is statistically significant in this model because its p-values is less than 0.05. On the other hand, CS, ROA, SALE, and Liquidity have no statistical significance because their p-values are more than 0.05.
Table 8 shows the correlation and regression results in REM, FEM, and FEM* models. First, the regression result in REM has shown that firm’s size and capital structure significantly impact firm value at the reliability of 99%, while other variables like ROA, SALE and Liquidity are not statistically significant in the REM model. Especially, SIZE has a positive correlation with firm value. This finding is consistent with a few previous studies such as Dang et al. (2019), Aggarwal and Padhan (2017), Sampurna and Romawati (2020), and Anton (2016). On the other hand, capital structure and firm value are negatively correlated. This finding is consistent with a few previous studies such as Dang et al. (2019), Shah and Khalidi (2020), and Sampurna and Romawati (2020).
Table 3: FEM Result
. xtreg Equity SIZE CS ROA SALE Liquid, fe Fixed – effects (within) regression
Group variable: STT R-sq: Within = 0.0539 Between = 0.3860 Overall = 0.3778 corr (u_i, Xb) = 0.5151 Number of obs = 925 Number of groups = 239 Obs per group:
min = 1 avg = 3.9 max = 4
F(5, 681) = 7.76
Prob > F = 0.0000
Equity Coef. Std.Err. t P > |t| [95% Conf. Interval]
SIZE 246142 42852.09 5.74 0.000 162003.9 330280.1 CS −2891.626 1851.504 −1.56 0.119 −6526.969 743.7168 ROA 103290.7 144979.6 0.71 0.476 −181370 387951.4 SALE −15339.85 23861.29 −0.64 0.521 −62190.38 31510.68 Liquid 15.08722 227.5992 0.07 0.947 −431.7993 461.9677 _cons 2193866 506631.8 −4.33 0.000 −3188614 −1199118 sigma_u 2249656.2 sigma_e 353214.22
rho 0.97594154 (fraction of variance due to u_i)
Table 5: Heteroskedasticity Test . xttest3
Modified Wald test for groupwise heteroskedasticity In fixed effect regression model
H0: sigma (i)^2 = sigma^2 for all i
χ2 (239) = 2.9e+10
Prob > χ2 = 0.0000
Supposition:
H0: The error variance is constant; H1: The error variance is nonconstant; As we can see, p-value = 0.0000 < 0.05. Hence, the fixed effect model has a disability, which is, the error variance is non-constant.
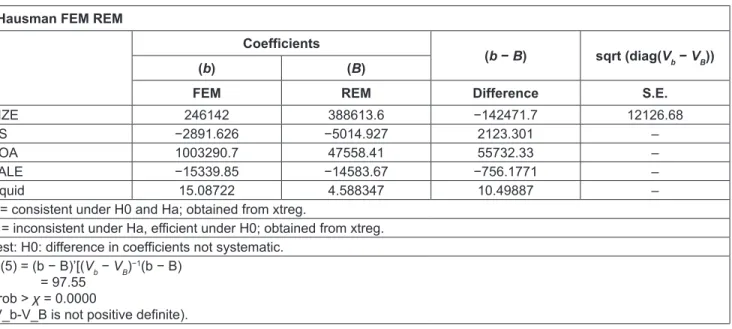
Table 4: Hausman Test . Hausman FEM REM
Coefficients
(b − B) sqrt (diag(Vb − VB))
(b) (B)
FEM REM Difference S.E.
SIZE 246142 388613.6 −142471.7 12126.68
CS −2891.626 −5014.927 2123.301 –
ROA 1003290.7 47558.41 55732.33 –
SALE −15339.85 −14583.67 −756.1771 –
Liquid 15.08722 4.588347 10.49887 –
b = consistent under H0 and Ha; obtained from xtreg.
B = inconsistent under Ha, efficient under H0; obtained from xtreg.
Test: H0: difference in coefficients not systematic.
χ2(5) = (b − B)’[(V
b − VB)−1(b − B)
= 97.55 Prob > χ = 0.0000
(V_b-V_B is not positive definite).
Supposition:
H0: εi and independent variables are not correlated; H1: εi and independent variables are correlated; We have: Prob = 0.0000 < 0.05.
Hence, we reject H0 and accept H1. In other words, εi is correlated with independent
variables. Therefore, we choose the fixed effect model (FEM).
Table 6: Autocorrelation Test
. xtserial Equity Size CS ROA Sale Liquid
Woooldrildge test for autocorrelation in panel data H0: no first-order autocorrelation
F(1,225) = 22.800
Prob > F = 0.0000
Supposition:
H0: no first-order autocorrelation; H1: first-order autocorrelation. Because the p-value is 0.0000 which is less than 0.05, the fixed effect model has a disability which is the first-order autocorrelation.
Second, with the FEM model, we have only one factor that has an effect on the company’s value, which is SIZE. With the correlation of 246,142, SIZE strongly and positively affects firm value at the reliability of 99%. However, when considering the adjusted fixed-effects model (FEM*), besides the SIZE variable, the capital structure also has an effect on company value. Similarly, the results of the REM and FEM models show that firm size has a strong and positive effect on the firm’s value. Simultaneously, the relationship between capital structure and firm value is negative at the reliability of 90%. Other variables comprising profitability, sales, and liquidity are not statistically significant in the FEM* model.
5. Conclusion and Limitations
Firm value reflects the present value of the cash flows of a company in the future, and it will directly affect investment decisions. Hence, researching firm value is important and necessary. More specifically, the goal of the research is to identify the determinants of firm value. Especially, the purpose of this study is to find the factors that impact the firm value of Vietnamese listed corporations in HNX and HOSE over 9 years, from 2011 to 2019. Basically, the study’s result contributed to resolving all hypotheses and research questions. However, the regression analysis’s result has shown that the impact of factors is different compared to expectation in hypotheses. A piece of evidence for this
Table 7: FEM Cluster Result
. xtreg Equity Size CS ROA Sale Liquid, fe cluster (STT) Fixed – effects (within) regression
Group variable: STT R-sq: Within = 0.0539 Between = 0.3860 Overall = 0.3778 corr (u_i, Xb) = 0.5151 Number of obs = 925 Number of groups = 239 Obs per group:
min = 1 avg = 3.9 max = 4
F (5,238) = 5.72
Prob > F = 0.0001
(Std. Err. adjusted for 239 clusters in STT)
Equity Coef. Std. Err.Robust t P > |t| [95% Conf. Interval]
SIZE 246142 68162.01 3.61 0.000 111864.1 380419.9 CS −2891.626 1637.568 −1.77 0.079 −6117.605 334.3533 ROA 103290.7 84917.02 1.22 0.225 −63994.23 270575.7 SALE −15339.85 11335 −1.35 0.117 −37669.6 6898.897 Liquid 15.08722 26.74268 0.56 0.573 −37595.36 67.7698 _cons −2193866 885560.3 −2.48 0.014 −3938404 −449328.7 sigma_u 2249656.2 sigma_e 353214.22
rho 0.97594154 (fraction of variance due to u_i)
Table 8: Regression Result
Variables (1) (2) (3)
REM FEM FEM*
SIZE 388.614*** (41.100) 246.142*** (42.852) 246.142*** (68.162) CS −5.015*** (1.909) −2.892 (1.852) −2.892* (1.638) ROA 47.558 (149.686) 103.291 (144.980) 103.291 (84.917) SALE −14.584 (24.169) −15.340 (23.861) −15.340 (11.335) Liquid 4.588 (236.3) 15.09 (227.6) 15.09 (26.74) Constant −4.051e+06*** (489.253) −2.194e+06*** (506.632) −2.194e+06** (885.560)
Observations 925 925 925
Number of STT 239 239 239
0.054 0.054
Standard errors in parentheses. ***p < 0.01, **p < 0.05, *p < 0.1. difference is capital structure is negatively correlated with firm value, whereas we expected the impact to be positive. In contrast, firm size has a positive and significant impact on firm value as expected. Besides, through this study, we identify that profitability, firm sales, and liquidity are not statistically significant in the regression model. In other
words, the factors comprising profitability, sales, and liquidity do not impact firm value. Although this is not the same as the expectation in hypotheses, previous papers also have similar results.
Based on the results of this study, we give some recommendations for trading firms listed on the Vietnam
stock exchange from 2011 to 2020. Those firms should expand their size by having more assets. Moreover, they should use their equity to buy assets instead of using debt. In other words, the companies can make some suggestions so that their shareholders should invest more in the firms instead of taking out loans from banks or any other financial institutions. Instead of making efforts to improve profitability, sales, and liquidity, trading companies in Vietnam should attempt to increase their owners’ equity and stop raising more loans. These recommendations are better tools for improving the firm value of listed trading companies in our country.
Even though this study makes some contributions to the current literature, it has the following limitations. First, this research focuses on the trading industry; therefore, this work only determines factors that affect the value of trading firms in Vietnam. Our research cannot explain all companies because each industry has unique characteristics. Second, we used a data set from 2011 to 2019, and this means that data is not updated until 2020. Consequently, the findings of the research may not reflect the current situation of listed trading firms in Vietnam. Nonetheless, these limitations may be overcome in the future. For instance, the latest data for all listed firms in Vietnam may be collected in subsequent research studies.
References
Adenugba, A., Ige, A., & Kesinro, O. (2016). Financial leverage and firms’ value: A study of selected firms in Nigeria. European
Journal of Research and Reflection in Management Sciences, 4(1), 14–32.
Aggarwal, D., & Padhan, P. C. (2017). Impact of capital structure on firm value: Evidence from the Indian hospitality industry.
Theoretical Economics Letters, 7(4), 982–1000. https://doi.
org/10.4236/tel.2017.74067
Anton, S. G. (2016). The impact of dividend policy on firm value. A panel data analysis of Romanian listed firms. Journal of Public
Administration, Finance and Law, 10, 107–112.
Amir, E., & Lev, B. (1996). Value-relevance of nonfinancial information: The wireless communication industry. Journal
of Accounting and Economics, 22(1–3), 3–30. https://doi.
org/10.1016/S0165-4101(96)00430-2
Basu, S. (1997). The conservatism principle and the asymmetric timeliness of earnings. Journal of Accounting and Economics,
24(1), 3–37. https://doi.org/10.1016/S0165-4101(97)00014-1
Burgstahler, D. C., & Dichev, I. D. (1997). Earnings, adaptation, and equity value. The Accounting Review, 72(2), 187–215. https://www.jstor.org/stable/248552
Chen, L. J., & Chen, S. Y. (2011). The influence of profitability on firm value with capital structure as the mediator and firm size and industry as moderators. Investment Management and Financial
Innovations, 8(3), 121–129. https://businessperspectives.
org/images/pdf/applications/publishing/templates/article/ assets/4210/imfi_en_2011_03_Chen.pdf
Collins, D. W., Maydew, E. L., & Weiss, I. S. (1997). Changes in the value relevance of earnings and book values over the past forty years. Journal of Accounting and Economics, 24(1), 39–67. https://doi.org/10.1016/S0165-4101(97)00015-3 Dang, H. N., Vu, V. T., Ngo, X. T., & Hoang, H. T. (2019). Study
of the impact of growth, firm size, capital structure, and profitability on firm value: Evidence of firms in Vietnam. The
Journal of Corporate Accounting & Finance, 30(1), 144–160.
https://doi.org/10.1002/jcaf.22371
Dechow, P. M., Sloan, R. G., & Sweeney, A. P. (1995). Detecting earnings management. The Accounting Review, 70(2), 193–225. https://www.jstor.org/stable/248303
Durand, D. (1952). Costs of debt and equity funds for business: trends and problems of measurement. Conference on Research
in Business Finance, 19(5), 215–262. https://www.nber.org/
system/files/chapters/c4790/c4790.pdf
Elliott, J. A., & Hanna, J. D. (1996). Repeated accounting write-offs and the information content of earnings. Journal of Accounting
Research, 34, 135–155.
Endri, E., & Fathony, M. (2020). Determinants of firm’s value: Evidence from the financial industry. Management
Science Letters, 10(1), 111–120. https://doi.org/10.5267/
j.msl.2019.8.011
Filip, A., & Raffournier, B. (2010). The value relevance of earnings in a transition economy: The case of Romania. The
International Journal of Accounting, 45, 77–103. https://doi.
org/10.1016/j.intacc.2010.01.004
Himmelberg, C. P., Hubbard, R. G., & Palia, D. (1999). Understanding the determinants of managerial ownership and the link between ownership and performance. Journal of
Financial Economics, 53(3), 353–384. https://doi.org/10.1016/
S0304-405X(99)00025-2
Hirdinis, M. (2019). Capital structure and firm size on firm value moderated by profitability. International Journal of Economics
and Business Administration, 7(1), 174–191. https://doi.
org/10.35808/ijeba/204
Jong, A. D., Verbeek, M., & Verwijmeren, P. (2011). Firms’ debt-equity decisions when the static tradeoff theory and the pecking order theory disagree. Journal of Banking & Finance, 35(5), 1303–1314. https://doi.org/10.1016/j.jbankfin.2010.10.006 Machmuddah, Z., Sari, D. W., & Utomo, S. D. (2020). Corporate
social responsibility, profitability, and firm value: Evidence from Indonesia. The Journal of Asian Finance, Economics, and
Business, 7(9), 631–638. https://doi.org/10.13106/jafeb.2020.
vol7.no9.631
Mule, R. K., Mukras, M. S., & Nzioka, O. M. (2015). Corporate size, profitability, and market value: an econometric panel analysis of listed firms in Kenya. European Scientific Journal,
11(13), 376–396. https://eujournal.org/index.php/esj/article/
view/5659
Muhammad, H., Rehman, A. U., & Waqas, M. (2016). The relationship between working capital management and profitability: A case study of the tobacco industry of Pakistan.
The Journal of Asian Finance, Economics, and Business, 3(2),
13–20. https://doi.org/10.13106/jafeb.2016.vol3.no2.13 Myers, S. C. (1977). Determinants of corporate borrowing.
Journal of Financial Economics, 5(2), 147–176. https://doi.
org/10.1016/0304-405X(77)90015-0
Nguyen, H. T., & Bui, M. T. (2020). Determinants of firm value in Vietnam: A research framework. International Journal of
Science and Research, 9(1), 626–631. https://www.ijsr.net/
get_abstract.php?paper_id=ART20204002
Nguyen, T. N. L., & Nguyen, V. C. (2020). The determinants of profitability in listed enterprises: A study from Vietnamese stock exchange. The Journal of Asian Finance, Economics, and
Business, 7(1), 47–58. https://doi.org/10.13106/jafeb.2020.
vol7.no1.47
Niresh, J. A., & Velnampy, T. (2014). Firm size and profitability: A study of listed manufacturing firms in Sri Lanka. Inter
national Journal of Business and Management, 9(4), 57–64.
https://doi.org/10.5539/ijbm.v9n4p57
Obradovich, J. D., & Gill, A. (2013). The impact of corporate governance and financial leverage on the value of American firms. International Research Journal of Finance and
Economics, (91). https://digitalcommons.liberty.edu/busi_fac_
pubs/25/
Pérez-González , F., & Yun, H. (2013). Risk management and firm value: Evidence from weather derivatives. The Journal
of Finance, 68(5), 2143–2176. https://doi.org/10.1111/
jofi.12061
Rizqia, D. A., & Sumiati, S. A. (2013). Effect of managerial ownership, financial leverage, profitability, firm size, and investment opportunity on dividend policy and firm value.
Research Journal of Finance and Accounting, 4(11), 120–130.
https://iiste.org/Journals/index.php/RJFA/article/view/7168 Sampurna, D. S., & Romawati, E. (2020). Determinants
of firm value: Evidence in Indonesia Stock Exchange.
Advances in Economics, Business and Management Research, 132, 12–15. http://repository.stei.ac.id/511/1/
Proceeding%20Atlantis.pdf
Saona, P., & Martín, P. S. (2016). Determinants of firm value in Latin America: an analysis of firm attributes and institutional factors. Review of Managerial Science, 12(1), 65–112. https:// doi.org/10.1007/s11846-016-0213
Shah, F. M., & Khalidi, M. A. (2020). Determinants of firm value in shariah-compliant companies. Market Forces, 15(1), 86–100. https://www.pafkiet.edu.pk/marketforces/index.php/ marketforces/article/view/409
Sudiyatno, B., Puspitasari, E., Suwarti, T., & Asyif, M. (2020). Determinants of firm value and profitability: Evidence from Indonesia. Journal of Asian Finance, Economics, and Business,
7(11), 769–778. https://doi.org/10.13106/jafeb.2020.vol7.
no11.769
Surjandari, D. A., Anggraeni, D., Arlita, D. P., & Purba, R. M. (2019). Analysis of non-financial determinants of company value in manufacturing companies in Indonesia. Jurnal Akuntansi,