Introduction
Motivation for vascular permeability imaging
Literature survey for vascular permeability imaging
Purpose
Outline
Abbreviations
Theoretical backgound
Basic contrasts of MRI and MR contrast agent
MRI is one of the non-invasive medical imaging techniques for acquiring anatomical and physiological information from the body. One of the most widely used MRI types in clinics is 1H MRI, which spatially visualizes the signal from protons in tissue.
Pharmacokinetic model for vascular permeability
CA reduces T1 and T2* (or T2 for spin-echo) of water close to CA and provides additional contrast. For CA effect on T1 relaxation, the unpaired electrons of CA must be close enough to the proton of water (for Gd3+ the distance is 3.1 [26]).
DCE-MRI
In general, the estimation of Cp(t) from Equation 5 requires an assumption that is determined by the characteristics of the MR technique. As described in Equation 5, the accuracy of the Cp function is crucial for the calculation of Ktrans values, so DCE-MRI is preferred for the assessment of cerebrovascular permeability in clinics.
DSC-MRI
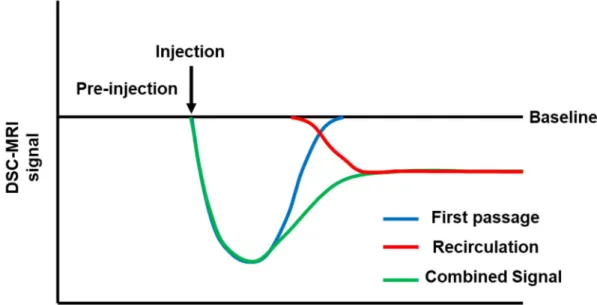
After bolus injection, the ΔR2* curve shows mixed first-pass and second-pass CA concentration curves, as shown in Figure 3. Therefore, to estimate CBV, the first-pass ΔR2* curve must be extracted from the mixed ΔR2* curve. Therefore, if the injected CA is not extravasated from the blood, three perfusion parameters can be evaluated from the ΔR2* DSC-MRI curve.
However, if CA is extravasated, Eq.9 is rewritten as follows, taking into account the T1 effect of the extravasated CA. Assuming that the spread of CA is the same for all voxels, the ΔR2* curve for an intact BBB region can represent Cp(t) function.
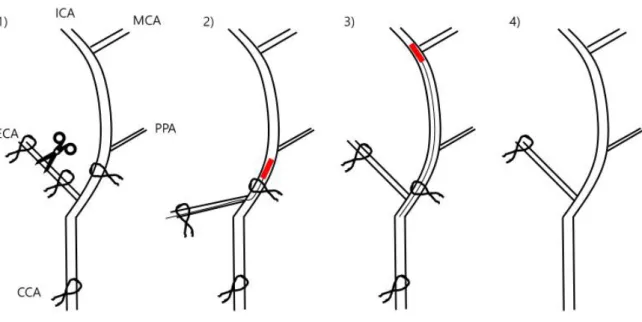
Transient middle carotid artery occlusion model
In this study, cNMF was applied to the ΔR2* curve of DSC-MRI and normal areas were determined automatically. This implies that the ΔR2* curve of preloaded DSC-MRI is not affected by CA extravasation. Therefore, the ΔR2* curve of preloaded DSC-MRI of each voxel could be considered as a reference input function.
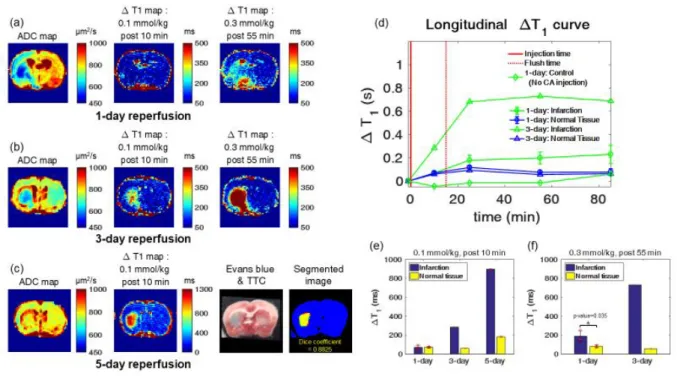
In Chapter 4, it is shown that the ΔR2* curve for DSC-MRI is more sensitive to CA leakage than the ΔR1 curve for DCE-MRI. Furthermore, DSC-MRI responds faster to CA extravasation than DCE-MRI for 1-hour MCAO and 1-day reperfusion model.
CA leakage effects on DSC-MRI
Introduction
DSC-MRI provides MR perfusion information by monitoring the CA concentration curves and extracting the blood flow, blood volume, and mean transit time information based on pharmacokinetic models [ 34 , 36 ]. The pharmacokinetic models of DSC-MRI typically assume that a bolus-injected CA does not extravasate from the vessels. However, when the BBB is disrupted by certain diseases, such as tumors, strokes, and neurodegeneration, gadolinium chelates can leak through the vessels.
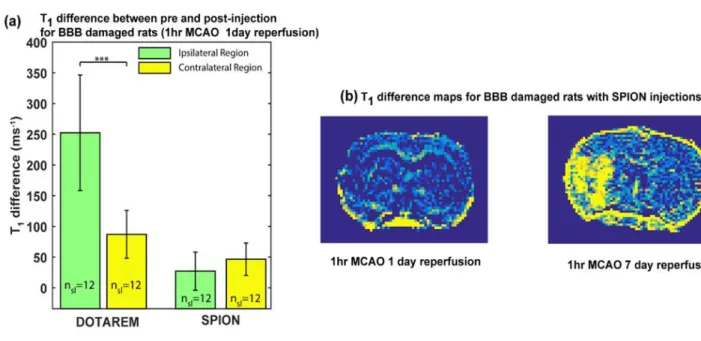
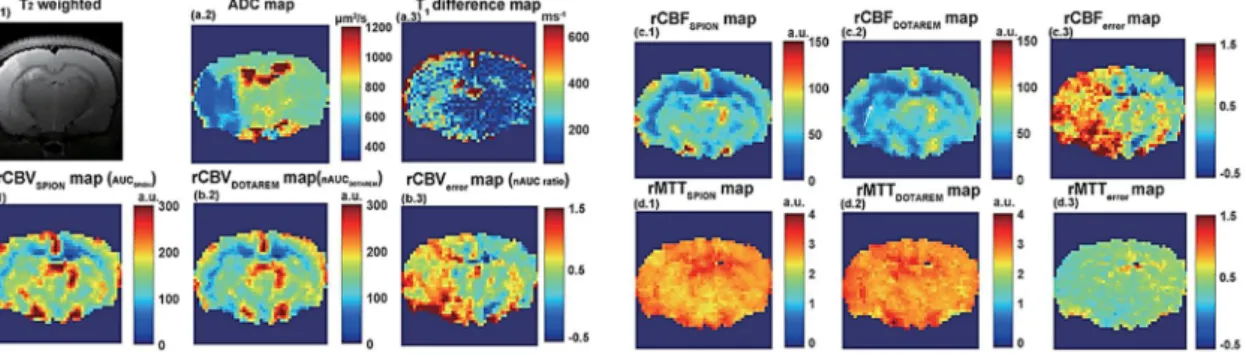
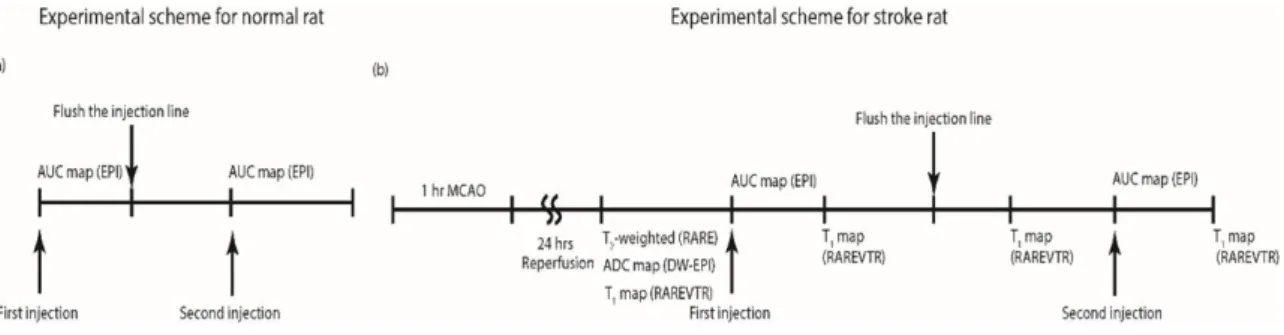
Therefore, in the case of damaged BBBs, the initial (<6s) DSC-MRI signal may be significantly biased. In this study, CA extravasation effects on baseline dynamic MRI measurements are investigated by comparing two different DSC-MRI curves for Dotarem and SPION, for both normal rats and rats that underwent tMCAO surgery.
Methods
Then, the error caused by CA extravasation effects is quantified and compared with the T1 difference map reflecting the damaged level of BBB. Note that this comparison method does not require advanced pharmacokinetic modeling or input function assumption to evaluate the CA extravasation effects. The difference between the first CA-injected AUC map (rCBVFirst) and the second CA-injected AUC map (rCBVSecond) was compensated by a normalization process.
The ratio was calculated by linear fit (y=ax) between rCBVFirst and rCBVSecond value in the contralateral hemisphere. Therefore, after the normalization process, the ratio of rCBVFirst and rCBVSecond values in the contralateral hemisphere is close to 1.
Results
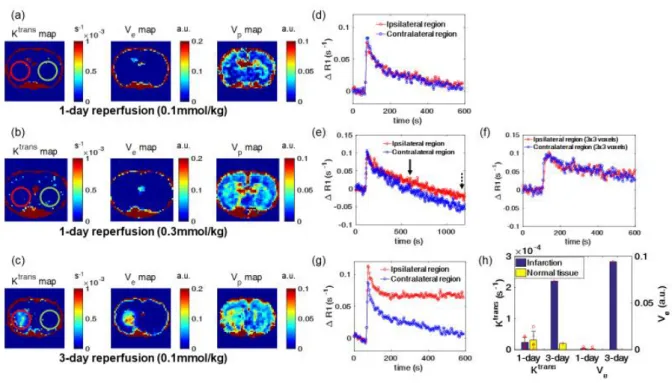
For DSC-MRI and DCE-MRI, Dotarem injection was 0.3 mmol/kg and 0.1 mmol/kg, respectively. However, high dose DSC-MRI successfully evaluates vascular permeability of 1-hour MCAO with 1-day reperfusion model. Prior knowledge of the BBB-intact area is a prerequisite to determine vascular permeability in DSC-MRI.
However, DSC-MRI guided pattern recognition successfully classifies the intact BBB region without any other information. In conclusion, DSC-MRI guided by pattern recognition is more sensitive to vascular permeability than DCE-MRI and reduces the error that comes from incorrectly defined intact BBB region. Therefore, pattern recognition-guided DSC-MRI is more suitable for assessing the vascular permeability of the delicate damaged region of the BBB than conventional DSC-MRI and DCE-MRI.
The second assumption is that extravasation of CA reduces the ΔR2* curve of DSC-MRI and provides additional contrast. Furthermore, the leakage index is only based on the relationship between the first and second DSC-MRI without a pharmacokinetic model. Then, the vascular permeability of the subtle BBB damaged area was successfully evaluated by DSC-MRI and it was shown that DSC-MRI is more sensitive to CA extravasation than DCE-MRI.

Discussions and Conclusions
Introduction
The extravasated CAs affect DSC-MRI by reducing the T1 time and the skewed signal causes a significant underestimation of the CBV as described in Chapter 3. This means that prior knowledge is required for K2 values, and generally the voxels which have non-enhanced DSC-MR signal, is considered an intact BBB tissue. However, the assumption may not be ideal for mild BBB damaged diseases if the CAs are extravasated, but the post-injection signal from DSC-MRI is not improved than pre-injection.
Therefore, pattern recognition may be possible to segment a region with intact BBB from DSC-MRI without any prior knowledge. By comparing perfusion parameters (K1, K2) derived from automatic ROI with other regions (infarction, ventricle, manual ROI, large vessel), cNMF-based segmentation successfully classified a region with intact BBB.
Methods
To compare the K1 and K2 maps derived from the manually drawn ROI and the automatic ROI, DSC-MRI was performed in the tMCAO group (n=4). For the case k = 2, the cNMF weighting map was computed by subtracting a fast model matrix into a slow model matrix. Regions whose k = 1 cNMF weighting value is higher than 1 are segmented as a large vessel region.
The regions where the k = 2 cNMF weighting map is higher than 0.1 are defined as BBB-disrupted region or ventricle. The other regions whose cNMF weighting map for k =2 is lower than 0 are defined as region with intact BBB.
Results
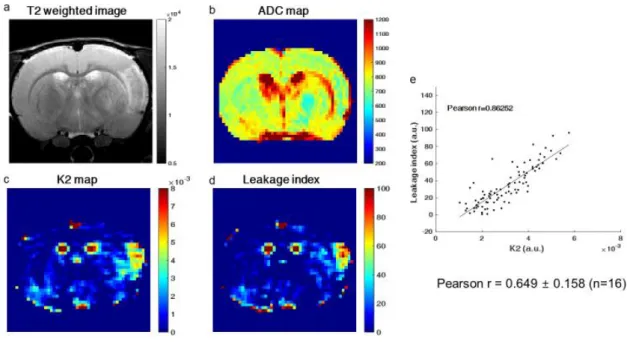
Therefore, CA extravasated effects on DSC-MRI are larger than DCE-MRI, making K2map of DSC-MRI more sensitive than Ktransmap of DCE-MRI. K2 and leakage index values on BBB damaged region have strong correlation (Pearson's r = 0.8625) as shown in Figure 18.e. Hyper-intensity regions of leakage index map and ΔT1.5min-30minmap were mismatched as shown in Figure 20.e (Dice correlation = 0.1301).
However, the masks of the leakage index map and the ΔT1.0min-5min map overlapped as shown in Figure 20.f (dice correlation = 0.6897). The correlation between the flow index map and the Evans blue stained region was shown in Figure 21. In addition, the ΔR2* curve of DSC-MRI shows that the time at which the difference between the ipsilateral and contralateral regions begins to occur is earlier than the curve ΔR1 of DCE-MRI.
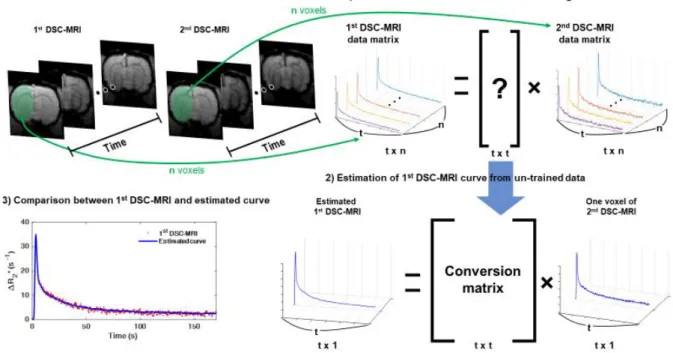
In conclusion, the feasibility of estimating a non-extravasated ΔR2* curve from the second DSC-MRI was demonstrated and the leakage index was calculated by comparing the non-extravasated and extravasated ΔR2*.
Discussion and Conclusions
Introduction
DSC-MRI assumes that CA is not extravasated from blood, but many papers have used the K1,K2 model to study the CA extravasation effects on the DSC-MRI signal in the BBB damaged area [ 43 -45]. To solve this problem, the shape of the ΔR2* curve of the reference region is usually adjusted using a time scale factor and a time shift [20]. Therefore, if the reference input features of each voxel can be measured directly, the dependence on the reference region will be reduced.
The use of MR CA or preloaded DSC-MRI are well-known methods to directly measure the undistorted ΔR2* curve of the BBB-disrupted region [54-55]. Several articles have shown that CA-preloaded MRs prevent signal enhancement of the damaged BBB region during second-injected DSC-MRI, and there is no significant difference in cerebral blood volume between DSC-MRI using whole blood CA and preloaded DSC-MRI [54-55 ].
Methods
MRI has a basic assumption that CA is not extravasated from blood, but many papers have used the K1,K2 model to study the CA extravasation effects on DSC-MRI signal in BBB damaged region [ 43 – 45 ]. It suggests that the ΔR2* curve of preloaded DSC-MRI is not affected by extravasation of CA. Therefore, each voxel's ΔR2* curve of preloaded DSC-MRI could be considered as a reference input function. To evaluate vascular permeability (K2) from DSC-MRI, each voxel of ΔR2*curve was fitted based on.
To study the effects of delineating intact BBB regions on K2 or flow index maps, 4 different ROIs (contralateral hemisphere, contralateral cortex, contralateral striatum, contralateral corpus callosum) were used. To show the correlation between the flow map and the ΔT1 map depending on the time points acquired, two different ΔT1 maps (ΔT1 map between pre-injection and 5 minutes after flushing the injection line (ΔT1.0min-5minmap), ΔT1 Map between 5min and 30min after flushing the injection line (ΔT1.5min-30minmap)) were compared with the leakage index map.
Results
Brain perfusion imaging methodology. Journal of Magnetic Resonance Imaging: An Official Journal of the International Society for Magnetic Resonance in Medicine. Dynamic susceptibility contrast-enhanced MR imaging of plaque development in multiple sclerosis: Application of a prolonged blood-barrier flow correction to the brain. Journal of Magnetic Resonance Imaging. Method for quantitative mapping of dynamic MRI contrast agent uptake in human tumors.Journal of Magnetic Resonance Imaging: An Official Journal of the International Society for Magnetic Resonance in Medicine.
Measuring cerebral blood flow using magnetic resonance imaging techniques.Journal of cerebral blood flow &. Principles of cerebral perfusion imaging by bolus tracking. Journal of Magnetic Resonance Imaging: an official journal of the International Society for Magnetic Resonance in Medicine. Automating pattern recognition analysis of dynamic contrast-enhanced MRI data to characterize intratumoral vascular heterogeneity. Magnetic resonance in medicine.
Use of dynamic contrast-enhanced MRI to measure subtle blood-brain barrier abnormalities. Magnetic resonance imaging.
Discussion and Conclusions
Summary
In this thesis, a systematic comparative study using Gd-DOTA and MION demonstrated the feasibility of evaluating the vascular permeability of the subtle damaged region of the BBB using the DSC-MRI technique. Although most studies focus on improving the sensitivity of DCE-MRI, this is difficult due to the fundamental limitations of the T1-weighted signal, and the T2*-weighted signal may be a good alternative, especially for the subtly damaged region of the BBB.
Limitations and Future works
34;Correlation of volume transfer coefficient Ktrans with histopathological grades of gliomas." Journal of Magnetic Resonance Imaging. Mapping water exchange across the blood-brain barrier using 3D diffusion-prepared arterial spin-labeled perfusion MRI. Magnetic resonance in medicine. In vivo quantification of transvascular water replacement during the acute phase of permanent stroke.Magnetic Resonance in Medicine: An Official Journal of the International Society for Magnetic Resonance in Medicine.
A comparative study on the robustness of compartmental modeling and model-free analysis in DCE MRI studies. Journal of Magnetic Resonance Imaging: An Official Journal of the International Society for Magnetic Resonance in Medicine. Pattern recognition analysis of dynamic susceptibility contrast (DSC) MRI curves automatically segments tissue regions with an intact blood-brain barrier in a rat stroke model: a feasibility study and comparison. Journal of Magnetic Resonance Imaging.
![Figure 1. T 1 , T 2 and proton density weighted images of the human brain [23].](https://thumb-ap.123doks.com/thumbv2/123dokinfo/10499050.0/14.892.125.781.691.986/figure-t-proton-density-weighted-images-human-brain.webp)