Index terms Breast Cancer MRI
Diffusion-Weight Image
Positron Emission Tomography/CT Peak Standardized Uptake Value Apparent Diffusion Coefficient
서론
유방암의 진단에 대표적으로 사용되는 검사 방법은 유방촬영 술, 초음파, 자기공명영상(magnetic resonance imaging; 이하 MRI)이다. 이들 검사 방법 중 유방의 역동적 조영증강 MRI는 유방 병변을 진단하는 데 가장 민감도가 높은 검사이지만, 유방 촬영술이나 유방 초음파에 비해서 상대적으로 특이도가 낮은
단점이 있다(1-4). 최근에는 MRI의 확산강조영상(diffusion weighted image; 이하 DWI)을 이용하여 유방 악성병변의 특이 도가 좀 더 향상되고 있다(5-11). 대부분의 악성 종양은 세포충 실도(cellularity)가 높고 물의 확산을 방해하므로 확산강조영상 에서 높은 신호강도를 보이게 되고, 인체 내의 제한된 물 분자 의 운동을 나타낸 현성확산계수(apparent diffusion coeffi- cient; 이하 ADC)값이 낮아진다. 이러한 병변은 높은 ADC값을
J Korean Soc Radiol 2012;67(3):177-186
Received May 16, 2012; Accepted July 4, 2012 Corresponding author: Keumwon Kim, MD Department of Radiology, Konyang University College of Medicine, 158 Gwanjeodong-ro, Seo-gu, Daejeon 302-718, Korea.
Tel. 82-42-600-9084 Fax. 82-42-600-9193 E-mail: [email protected]
Copyrights © 2012 The Korean Society of Radiology
Purpose: To correlate the apparent diffusion coefficient (ADC) value and peak stan- dardized uptake value (pSUV) with histologic grade and clinical prognostic factors of breast ductal carcinoma.
Materials and Methods: Fifty breast cancers of 49 patients (age range: 37-83 years, mean: 53 years) were studied retrospectively. The breast cancers included 4 ductal carcinoma in situ (DCIS) and 46 invasive ductal carcinomas (IDC). The rela- tionships for both pSUV and ADC values with clinicopathological prognostic factors (age, tumor size, histologic grade, nodal metastasis, hormone receptor and HER-2 neu status) were statistically evaluated.
Results: The histologic type of ductal carcinoma include DCIS (n = 4) and IDC (n = 46, grade 1 = 10, grade 2 = 13, and grade 3 = 23). pSUV was associated with histo- logic grade and tumor size and the ADC value was associated with histologic grade (p < 0.05). As the histologic grade becomes higher, the ADC values decrease, while pSUV and pSUV/ADC increase (p < 0.05). The characterization accuracy of pSUV/
ADC (90.2%) was higher than pSUV (86.7%) and ADC values (25.4%) alone for the diagnosis of breast cancer (p < 0.05).
Conclusion: pSUV and ADC values correlated with histologic grade, and tumor size.
The pSUV/ADC value had a high accuracy for the diagnosis of breast cancer. There- fore, pSUV and ADC values provided additional information for predicting histologic grade and prognosis of breast cancer.
The Predictability for the Prognosis of Breast Cancer Using the Apparent Diffusion Coefficient Value of Diffusion-Weighted 3 T MRI and the Standardized Uptake Value of Positron Emission Tomography/CT: Assessment of Prognostic Factor
1유방암 진단에 있어 3 T 확산강조영상의 현성확산계수값과
양전자방출단층촬영술의 최대표준섭취계수의 유방암 예후 예측 가능성:
유방암 예후인자에 대한 평가
1Seong Joo Lim, MD
1, Keumwon Kim, MD
1, Hye Young Jang, MD
1, Cheol Mog Hwang, MD
1, Dae Ho Kim, MD
1, Jang Sihn Sohn, MD
2, Jin-Suk Kim, MD
3, Jin Yong Lee, MD
4Departments of 1Radiology, 2Pathology, 3Nuclear Medicine, 4Preventive Medicine, Konyang University College of Medicine, Daejeon, Korea
모두 50개의 병변을 대상으로 하였다. 50개의 유방암 병변 중 IDC 46개, DCIS는 4개였다. 대상군의 평균 나이는 53.0세 (범위 37~83세)이고 모두 여자였다.
MRI 장비는 Philips Intera Achieva 3 T MRI system (Philips Medical Systems, Best, Netherlands)을 사용하였다. 엎드린 자 세에서 bilateral four-channel phase array breast coil을 사용하 였다. DWI는 축상면(axial) single shot echo-pannar imaging with sense encoding 기법으로 b-value는 1000 mm2/s을 사용 하였다. 매개변수는 TR/TE = 1825/57, FOV = 350 × 400 mm, matrix size = 116 × 115, 2.0 NEX, section thickness
= 5 mm, intersection gap = 0이었다. ADC값은 관심부위를 병변보다 작은 크기로 설정하여 괴사나 액체 성분을 포함하지 않도록 하였다. MRI는 두 명의 영상의학과 의사가 서로 의견 을 모아(consensus) 판독하였다.
PET/CT 장비는 Gemini TF PET/CT scanner (Philips Medical Systems, Best, Netherlands)를 사용하였으며, 모든 환자는 PET/CT 촬영 전 최소 8시간 동안 금식하였다. 조영증 강은 하지 않았고, FDG를 정맥에 주입하고(0.14 MBq/kg body weight), 50~60분 뒤에 촬영을 시작하였다. CT 촬영은 PET 촬영을 완료한 직후에 시행했으며, 촬영 범위는 정수리에 서 대퇴부까지이다. CT 촬영 범위는 PET와 동일하고, CT 촬 영의 변수는 slice thickness = 4 mm, pitch of 4 mm, 120 kVp, 100 mAs였다. PET/CT 영상을 얻은 뒤에 축상(axial), 관상(coronal)으로 영상을 재구성하였다. 한 명의 핵의학과 전 문의가 PET/CT를 판독하였고, 주변 유방조직과 비교하여 높 은 FDG 섭취를 보이는 경우를 양성으로 판정하였으며, 이들 병변의 위치를 영상의학과 의사가 확인한 후에 pSUV를 측정 하였다.
유방 예후 인자들은 나이는 50세 이전과 50세 이상으로 분 류하였고, 종양 크기는 2 cm 이내와 2 cm 이상으로, 호르몬 수용체는 에스트로겐, 프로게스테론, HER-2 neu 수용체 여 부에 따라 분류하였다. 유방 관상피암의 조직학적 분석은 병리 결과지를 참고하였으며, 유방암 병변의 조직학적 진단을 확인 하였다(DCIS vs. IDC). IDC는 Nottingham modification of Scarff-Bloom-Richardson system에 따라서 관 형성(tubular formation), 핵 다양성(nuclear pleomorphism), 유사분열(mi- tosis)의 여부를 확인하여 1등급에서 3등급까지 나누었고, 각 병변의 pSUV와 ADC값을 기록하여 pSUV, ADC값과 환자 나 이, 종양 크기, 유방암의 조직등급, 호르몬 수용체 여부 등과의 관계를 분석하였다.
통계적 검증은 Statistical Package for the Social Sciences (이하 SPSS), version 18.0 (SPSS Inc., Chicago, IL, USA)을 이용하 보이는 병변에 비해 세포수가 더 많아 물 분자의 확산이 제한을
받는다는 것을 의미하고, 이를 이용하여 유방암을 진단하려는 여러 연구가 있었다(7, 8). 또한 18F-fluorodeoxyglucose (이하 FDG)를 이용한 양전자방출단층촬영술(positron emission to- mography; 이하 PET)의 최대표준섭취계수(peak standard- ized uptake value; 이하 pSUV)를 이용하여 병변의 악성도를 예측하려는 시도가 계속되고 있으며(12), 이는 대부분의 악성 종양이 종양 자체 및 종양의 생화학적 특성과 여러 외적인 요 인에 의해 탄수화물 대사가 증가하여 PET에서 종양의 대사 활 성도가 높게 측정되는 것을 기반으로 한다(13). 이전의 여러 연 구에서 확산강조영상의 ADC값과 PET/CT의 pSUV를 사용 하여 악성과 양성을 구별하는 한계치(cut-off value)를 보고하 였다(7, 11, 14-23).
유방암의 예후를 결정하는 인자들은 나이, 종양 크기, 조직 등급, 림프절 전이 여부와 호르몬 수용체(에스트로겐, 프로게 스테론, HER-2 neu 수용체 여부) 등이 있다. 종양 크기가 클 수록, 조직등급이 높을수록, 림프절 전이가 많을수록, HER-2 neu 수용체가 있고, 에스트로겐, 프로게스테론 수용체가 없을 수록 예후가 나쁘다(19, 24). 유방의 관상피암은 관상피내암 (ductal carcinoma in situ; 이하 DCIS)과 침윤성 관상피암 (invasive ductal carcinoma; 이하 IDC)으로 구분되고 IDC는 Nottingham modification of Scarff-Bloom-Richardson sys- tem을 기반으로 하여 관 형성(tubular formation), 핵 다양성 (nuclear pleomorphism), 유사분열(mitosis) 정도에 따라 1등 급에서 3등급까지 분류하게 되고, 일반적으로 등급이 높아질 수록 나쁜 예후를 보인다고 알려져 있다(25, 26). 이에 본 연구 에서 저자들은 3 T DWI의 ADC값과 PET/CT의 pSUV를 구 하여 유방암의 조직등급과 유방암의 예후 인자들과의 상관관 계를 알아보고자 하였다.
대상과 방법
2010년 2월부터 2011년 2월까지 본원에서 조직검사상 유방 암으로 진단되어 유방 MRI, PET/CT, 수술을 시행한 환자를 대상으로 후향적 연구를 진행하였다. 이 기간 동안 유방 MRI 를 시행 받은 환자는 모두 87명이었다. 그 중 PET/CT를 촬영 하였고 침생검(core needle biopsy) 및 수술 후 조직검사에서 유방 관상피암(ductal carcinoma of breast)이 진단된 환자는 47명이었으며, 침 생검에서 비정형 관상증식증(atypical ductal hyperplasia)이었으나 수술 후에 IDC가 확인된 1명, 침 생검에 서 간질섬유화(stromal fibrosis)로 확인되었으나 수술 후 DCIS가 확인된 1명 및 다발성 2명과 양측성 1명을 포함하여
마지막으로 pSUV와 ADC값의 조직학적 진단의 정확도(accu- racy)를 확인하기 위해서 receiver operating characteristic (이 하 ROC) curve를 구하고 curve의 아래쪽 면적을 측정하였다.
p-value 0.05 미만인 경우를 통계학적으로 유의성이 있는 것 으로 하였다.
결과
50개의 유방 관상피암 병변 중 DCIS는 4개(7.8%), IDC가 였다. Mann Whitney test와 Kruskall Wallis test를 이용해 각
병변들의 ADC값, pSUV의 중앙값과 유방암의 예후 인자들 (나이, 종양크기, 조직등급, 림프절 전이, 에스트로겐 수용체, 프로게스테론 수용체, HER-2 neu 수용체)의 연관성을 분석 하고, 조직등급에 따른 pSUV 및 ADC값의 중앙값의 차이를 검증하였다. 조직학적 진단 및 등급과 pSUV, ADC값의 관계 를 확인하기 위해 Pearson’s correlation analysis를 사용하였 고, 유방암의 조직등급과 ADC값 및 pSUV의 관계를 보기 위 하여 선형회귀분석(linear regression analysis)을 시행하였다.
Table 1. Association of pSUV and ADC Values with Clinicopathological Factors in Breast Cancer
Clinicopathological Factor Number pSUV ADC (× 10-3 mm2/s) pSUV/ADC
Age (years)
≤ 50 23 3.15 (1.50-5.98) 0.78 (0.67-0.89) 4.18 (1.38-8.04)
> 50 27 2.85 (1.63-6.75) 0.68 (0.57-0.80) 8.29 (1.95-9.38)
p-value 0.784 0.086 0.448
Tumor size (cm)
≤ 2.0 32 1.35 (1.35-3.50) 0.76 (0.65-0.95) 2.79 (1.27-5.59)
> 2.0 18 5.40 (3.03-7.43) 0.68 (0.54-0.80) 8.00 (4.04-15.55)
p-value 0.004* 0.080 0.004*
Invasiveness
DCIS 4 1.25 (1.00-1.58) 1.25 (1.13-1.43) 0.96 (0.80-1.26)
IDC 46 3.15 (1.78-6.80) 0.70 (0.60-0.80) 4.70 (2.47-9.05)
p-value 0.011* 0.000* 0.000*
Histologic grade
DCIS 4 1.25 (1.00-1.58) 1.25 (1.13-1.43) 0.96 (0.80-1.26)
Grade 1 10 1.65 (1.00-2.83) 0.80 (0.63-0.88) 2.09 (1.22-4.41)
Grade 2 13 2.80 (1.60-5.40) 0.70 (0.65-0.92) 3.76 (2.12-7.51)
Grade 3 23 5.60 (2.80-7.20) 0.65 (0.54-0.76) 8.00 (4.67-16.20)
p-value 0.001* 0.001* 0.000*
Nodal metastasis
Negative 31 2.40 (1.50-5.70) 0.76 (0.65-0.89) 3.49 (1.25-8.00)
Positive 19 3.50 (1.80-6.90) 0.65 (0.57-0.78) 5.81 (2.83-9.44)
p-value 0.107 0.105 0.058
ER status
Negative 22 3.15 (1.73-6.90) 0.70 (0.60-0.80) 4.98 (2.29-10.80)
Positive 28 2.80 (1.50-4.88) 0.75 (0.61-0.89) 3.63 (1.70-7.46)
p-value 0.304 0.500 0.257
PR status
Negative 30 3.15 (1.50-6.80) 0.75 (0.59-0.82) 4.86 (1.38-9.05)
Positive 20 2.75 (1.53-3.80) 0.72 (0.62-0.84) 3.63 (1.79-5.82)
p-value 0.613 0.913 0.501
HER-2 neu status
Negative 8 3.50 (1.20-10.80) 0.78 (0.65-0.98) 4.18 (1.39-16.57)
Positive 42 2.80 (1.50-5.93) 0.72 (0.60-0.82) 4.51 (1.75-8.22)
p-value 0.524 0.302 0.825
Data are medians, with IQRs in parentheses.
Note.—*Significant difference.
ADC = apparent diffusion coefficient, DCIS = ductal carcinoma in situ, ER = estrogen receptor, HER-2 = human epidermal growth factor receptor 2, IDC = invasive ductal carcinoma, PR = progesterone receptor, pSUV = peak standardized uptake value
나(p = 0.080), pSUV/ADC는 2 cm보다 작은 병변에서 2.79(사분위수, 1.27~5.59)이고, 2 cm보다 큰 병변은 8.00 (사분위수, 4.04~15.55)으로 종양 크기에 따라 유의한 차이 가 있었다(p = 0.004). 림프절 전이 여부에 따른 병변의 ADC 값과 pSUV 및 pSUV/ADC의 유의한 차이는 없었다(p > 0.05). 또한 호르몬 수용체(에스트로겐, 프로게스테론, HER- 2 neu 수용체)에 따른 pSUV, ADC값과 pSUV/ADC도 유의 한 차이를 보이지 않았다(Table 1).
전체 대상군의 pSUV 중앙값은 2.85(사분위수 1.50~6.65) 였고, DCIS는 1.25(사분위수, 1.00~1.58)(Fig. 1), IDC는 3.15(사분위수, 1.78~6.80)였다(Fig. 2). IDC의 조직등급에 따른 pSUV의 중앙값은 1등급에서 1.65(사분위수, 1.00~
2.83), 2등급 2.80(사분위수, 1.60~5.40), 3등급은 5.60(사 분위수, 2.80~7.20)이었으며, 이들 차이는 유의하였다(p < 0.05). 전체 유방암의 ADC값의 중앙값은 0.74 × 10⁻³ mm2/s (사분위수, 0.62~0.83)이었다. DCIS는 1.25 × 10⁻³ mm2/s 46개(90.2%)였다. 모든 IDC에서 Nottingham modification of
Scarff-Bloom-Richardson system에 따른 조직등급을 확인할 수 있었고, 1등급 10개(21.7%), 2등급 13개(28.3%), 3등급이 23개(50%)였다. 유방 관상피암 중에 PET/CT에서 음성으로 판정된 병변(위음성)은 모두 8개(16%)였으며, 수술 후에 2개 는 DCIS, 나머지 6개의 병변은 IDC로 판명되었다. 환자의 나이 는 50세 이하가 23예(46.0%), 50세 이상이 27예(54.0%)였 다. 우측 유방에서 24개(47.1%), 좌측에서 26개(26%)의 병변 이 발견되어 큰 차이가 없었다. 평균 크기는 2.23 cm(범위, 0.6~4.7 cm)였고, 2 cm 이상이 18예(35.3%)였으며, 2 cm 미만이 32예(62.7%)였다. DCIS의 평균 크기는 1.4 cm(범위, 0.1~1.7 cm), IDC는 2.31 cm(범위, 0.6~4.7 cm)였다.
종양 크기가 2 cm보다 작은 병변의 pSUV의 중앙값은 1.35(사분위수, 1.50~5.98), 2 cm보다 큰 병변의 pSUV는 5.40(사분위수, 3.03~7.43)으로 유의한 차이를 보였다(p = 0.004). 크기에 따른 ADC값은 유의한 차이를 보이지 않았으 D
A
E
B C
Fig. 1. A 50-year-old woman having 1.0 cm grade I IDC of the right breast.
A. The axial dynamic-enhanced the T1-weighted gradient-echo subtraction image for the first post-contrast acquisition shows a heterogeneous enhancing irregular mass with a spiculated margin (arrow).
B. On the axial PET/CT fusion image, the mass shows hypermetabolism with a pSUV of 1.5 (arrow).
C. The DWI (b = 1000 mm2/s) shows diffusion restriction with an intermediate signal intensity lesion (arrow).
D. On the ADC map, the ADC value of the mass was 1.47 × 10⁻³ mm2/s (arrow).
E. Most of tumor reveals tubule formation, moderate variation in nuclear size and shape, with rare mitotic figures. According to Nottingham modification of Scarff-Bloom-Richardson system, histologic grade I is given (1 + 2 + 1 = 4) (H&E, × 100).
Note.-ADC = apparent diffusion coefficient, DWI = diffusion weighted image, IDC = invasive ductal carcinoma, PET = positron emission tomog- raphy, pSUV = peak standardized uptake value
D A
E
B C
Fig. 2. A 55-year-old woman having a 2.6 cm IDC of the left breast.
A. The axial dynamic-enhanced T1-weighted gradient-echo subtraction image of the first post-contrast acquisition shows a homogeneously en- hancing mass with stronger enhancement at its rim with a spiculated margin (arrow).
B. On the axial PET/CT fusion image, the mass shows hypermetabolism with a pSUV of 11.9 (arrow).
C. The DWI (b = 1000 mm2/s) shows diffusion restriction with bright signal intensity of the mass (arrow).
D. The ADC value of the mass was 0.54 x 10⁻³ mm2/s (arrow).
E. Microscopical findings reveals rare tubule formation, marked variation of nuclear size and shape, and frequent mitotic figures with atypical mitosis. According to Nottingham modification of Scarff-Bloom-Richardson system, histologic grade III is given (3 + 3 + 3 = 9) (H&E, × 200).
Note.-ADC = apparent diffusion coefficient, DWI = diffusion weighted image, IDC = invasive ductal carcinoma, PET = positron emission tomog- raphy, pSUV = peak standardized uptake value
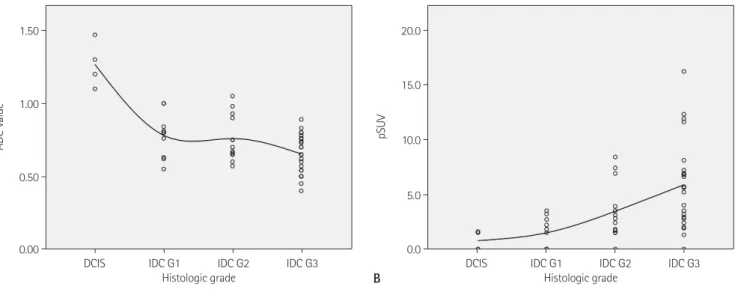
Fig. 3. Distribution of ADC value and pSUV for DCIS and grade 1, 2 and 3 of IDC.
A. ADC value shows a negative correlation with histologic grade (Pearson’s correlation coefficient = -0.710, p < 0.05).
B. pSUV was correlated with histologic grade (Pearson’s correlation coefficient = 0.530, p < 0.05).
Note.-ADC = apparent diffusion coefficient, DCIS = ductal carcinoma in situ, IDC = invasive ductal carcinoma, pSUV = peak standardized uptake value
0.00 0.0
0.50
5.0 1.00
15.0
10.0
1.50 20.0
ADC value pSUV
DCIS IDC G1 IDC G2 IDC G3 DCIS IDC G1 IDC G2 IDC G3
Histologic grade Histologic grade
A B
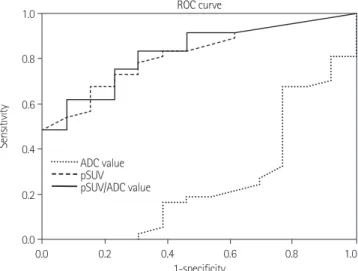
IDC에서 조직등급이 높은 병변은 낮은 등급의 병변보다 pSUV가 유의하게 높았으며, 이들 병변은 조직등급이 낮은 병 변보다 ADC값이 유의하게 낮았다(p < 0.05)(Fig. 3). ADC 값과 pSUV는 유의한 음의 상관관계를 보였고(p < 0.05) (Fig. 4A), 전체 대상군의 pSUV/ADC의 중앙값은 4.48(사 분위수, 1.75~8.60), DCIS는 0.96(사분위수, 0.80~1.26)이 었다. IDC의 중앙값은 4.70(사분위수, 2.47~9.05)이고 IDC 중 조직학적 1등급에서 2.09(사분위수, 1.22~4.41), 2등급은 3.76(사분위수, 2.12~7.51)이고 3등급은 8.00(사분위수, 4.67~16.20)으로 유의한 차이가 있었다(p < 0.05)(Table 1, Fig. 4B). 유방암 진단의 정확도(characterization accuracy) 는 ADC값 25.4%, pSUV 86.7%, pSUV/ADC 90.2%이고, 이들의 차이는 유의하였다(p < 0.05)(Fig. 5).
고찰
여러 연구에서 다양한 영상검사를 이용하여 유방암의 확인 (detection)과 진단 정확도(accuracy)를 개선하려는 시도가 있 어왔다. 현재 유방암 진단에 사용되는 대부분의 검사가 병변의 형태학적 변화를 확인하는 검사인데 반해서 최근 많은 연구가 진행되고 있는 MRI와 PET/CT는 각 병변의 ADC값과 pSUV 를 측정할 수 있어, 유방암 진단에 추가적인 정보를 제공하는 유용한 진단 도구라 할 수 있다(16).
본 연구에서는 유방암에 있어서 PET/CT의 pSUV와 MRI 확산강조영상의 ADC값의 예후 예측 가능성을 알아보기 위해 나이, 종양 크기, 림프절 전이, 호르몬 수용체 여부와 조직등급 (사분위수, 1.13~1.43)이었고(Fig. 1), IDC는 0.70 × 10⁻³
mm2/s(사분위수, 0.60~0.80)이었다(Fig. 2). 조직등급에 따 른 IDC의 ADC값의 중앙값은 1등급에서 0.80 × 10⁻³ mm2/s (사분위수, 0.63~0.88), 2등급은 0.70 × 10⁻³ mm2/s(사분위 수, 0.65~0.92), 3등급 0.65 × 10⁻³ mm2/s(사분위수, 0.54~0.76)로 유의한 차이를 보였다(p = 0.001)(Table 1). 유 방암 진단에서 DCIS와 IDC를 구별하는 한계치(cut-off value) 는 pSUV 2.30(민감도 73.0%, 특이도 76.9%)이었고, pSUV/
ADC는 2.79(민감도 75.7%, 특이도 76.9%)였다.
Fig. 4. Scatter plots of pSUV, ADC and pSUV/ADC.
A. Scatter plots of pSUV and ADC with regression line (y = 0.863 - 0.27x, R2 = 0.213, p < 0.05). pSUV values are shown to be significantly increas- ing and ADC values are shown to be decreasing as the histologic grade becomes higher.
B. pSUV/ADC shows a positive correlation with histologic grade (Pearson’s correlation coefficient = 0.535, p < 0.05).
Note.-ADC = apparent diffusion coefficient, DCIS = ductal carcinoma in situ, IDC = invasive ductal carcinoma, pSUV = peak standardized uptake value
Fig. 5. pSUV and pSUV/ADC having high accuracy for predicting a histologic grade of breast cancer (area under the curve are each 0.867 and 0.902). Note that the ADC values show low diagnostic perfor- mance (area under the curve 0.254).
Note.-ADC = apparent diffusion coefficient, pSUV = peak standard- ized uptake value, ROC = receiver operating characteristic
0.0 0.2 0.4 0.6 0.8 1.0
Sensitivity
0.2 0.4 0.6
1-specificity ROC curve
0.8 1.0
0.0
ADC value pSUV pSUV/ADC value 0.50
0.0000000
0.75 10.0000000
1.25
1.00
20.0000000 1.50
30.0000000
ADC pSUV/ADC value
0.0 5.0 10.0 15.0 20.0 DCIS IDC G1 IDC G2 IDC G3
pSUV Histologic grade
A B
와, 호르몬 수용체 유무와 나이에 따른 유의한 차이는 없었다.
본 연구의 유방암의 조직등급에 따른 pSUV의 중앙값은 DCIS 1.25(사분위수, 1.00~1.58), 1등급 IDC 1.65(사분위수, 1.00~2.83), 2등급 2.80(사분위수, 1.60~5.40), 3등급은 5.60(사분위수, 2.80~7.20)으로 유의한 차이를 보여(p < 0.05), 유방암의 조직등급이 높을수록 pSUV가 높은 것을 확 인할 수 있었고, 이는 이전 연구와 큰 차이가 없었다. 또한 Na- kajo 등(19)은 pSUV와 ADC값은 독립적인 인자로서 유방암 의 조직등급에 따라 유의한 차이를 보이고, pSUV와 ADC값은 음의 상관관계를 보인다고 하였다. 본 연구에서도 pSUV와 ADC값은 유의한 음의 상관관계를 보였고(p < 0.05), pSUV/ADC는 조직등급이 높을수록 유의하게 증가하는 것을 확인할 수 있었다(p < 0.05).
이전의 많은 연구에서 ROC curve를 이용해 악성 유방암과 양성 유방 병변을 구분하는 ADC값의 진단적 정확도(charac- terization accuracy)를 제시하였다(5, 8, 11, 34, 35). Nakajo 등(19)은 ADC값과 함께 pSUV와 pSUV/ADC의 진단적 정확 도를 보고하였는데, 이 연구에서 pSUV/ADC의 정확도(80%) 는 ADC값(74%)과 pSUV(77%), 각각의 정확도에 비해 높았 지만, 이들 차이는 유의하지 않아 pSUV/ADC가 유방암 진단 의 정확도 향상에 기여하는 역할이 제한적이라고 기술하였다.
그러나 본 연구에서는, pSUV/ADC의 진단적 정확도는 90.2%로 측정되었고, 이는 pSUV와 ADC값 각각의 정확도에 비해 유의하게 높았다(p < 0.05)(Fig. 5). 따라서 pSUV/
ADC는 유방암 진단에 있어서 추가적인 중요 정보를 제공할 수 있을 것으로 생각된다.
본 연구의 제한점은 첫째, 전체 대상 집단군의 숫자가 적고 DCIS가 IDC에 비해 매우 적다는 것이다(DCIS 4개, IDC 46 개). 본 연구에서는 일반적으로 병변의 크기가 큰 IDC가 많이 포함되어 pSUV가 병변의 크기에 영향을 받았을 가능성을 고 려해야 한다. 하지만, 본 연구의 병변들은 조직등급에 따른 크 기에 유의한 차이가 없었고, 따라서 이러한 영향은 배제할 수 있을 것으로 생각된다. 또한 본 연구에서 ADC값은 유방암 진 단에 있어서 유의한 정확도를 보여주지 못하였고(p = 0.09), 이 때문에 DCIS와 IDC를 구분하는 ADC값의 한계치를 측정 할 수 없었는데, 이는 DCIS 병변의 수가 적어서 발생한 오류일 것으로 예상된다. 둘째, 모든 환자가 조직학적 검사를 시행한 뒤에 PET/CT를 촬영하게 되어 조직검사에 의한 영향을 완전 히 배제할 수 없다는 점이다. 마지막으로, 조영증강 MRI에서 확인된 병변의 위치가 ADC map의 위치와 정확히 일치하지 않는 경우가 있었고, ADC map에서 병변이 불균질하게 보이는 경우가 있어, ADC값을 측정할 때 오류가 발생했을 가능성이 등과 pSUV, ADC값의 상관관계를 알아보았다.
MRI는 잘 알려진 것처럼 유방암의 확인, 진단과 병기결정에 있어서 중요한 역할을 하는 영상검사이다(1, 27, 28). 최근에 활발하게 연구되고 있는 DWI는 유방암 병변에서 물의 확산정 도를 정량적(quantification)으로 측정하여 이를 ADC값으로 보 여준다. 여러 연구에서 정상 조직과 양성 병변은 높은 ADC값 을 나타내고, 암과 같은 악성 병변은 낮은 ADC값을 보여(5, 6, 9), ADC값을 통해 악성 병변과 양성 병변을 구분할 수 있 다고 보고하였다. Park 등(7)과 Ahn 등(8)은 IDC와 DCIS가 양성 병변이나 정상조직보다 의미있게 낮은 ADC값을 보인다 고 보고하였다. Nakajo 등(19)의 연구에서 높은 조직등급의 유방암, 림프절 전이를 동반한 경우와 혈관 침범이 있을 때 유 방 병변의 ADC값이 의미있게 낮게 측정되었고, 나이, 종양크 기, 호르몬 수용체 여부와는 관계가 없었다. 또한 Razek 등 (24)은 유방암의 조직등급이 높을수록, 종양의 크기가 클수 록, 그리고 림프절 전이가 있는 경우에 낮은 ADC값을 보인다 고 보고하였다. 본 연구에서는 Razek 등의 연구 결과와 같이 조직등급이 높을수록 낮은 ADC 값을 보였고 이는 통계적으로 유의한 차이를 보였다(p < 0.05).
PET/CT 촬영시, FDG를 주입하게 되면 FDG는 포도당과 함께 세포 내로 이동하여, 포도당 대사가 활성화되어 있는 조 직에서 FDG 섭취가 증가하게 된다(7). 대부분의 종양은 크기 가 증가하거나 조직등급이 높아질수록 당 대사가 증가하게 되 므로 FDG 섭취가 증가하게 된다(13, 23, 29). Nakajo 등(19) 과 Ueda 등(30)은 종양의 크기가 크고, 림프절 전이가 있고, 에스트로겐, 프로게스테론 수용체가 없고, HER-2 neu 수용 체가 있고, 혈관 침범이 있고, 그리고 조직등급이 높을수록 pSUV가 의미있게 높게 나타나며, 나이와는 유의한 차이가 없 었다고 보고하였다. 또한 Oshida 등(15)은 유방암에서 FDG 섭취가 클수록 예후가 좋지 않으므로 FDG-PET를 예후 지표 로 사용할 수 있다고 하였다. Nakajo 등(19)의 연구에서 나쁜 예후를 보이는 유방 병변은 pSUV가 4.2 이상인 경우였다(민 감도 80%, 특이도 75%). 본 연구에서 DCIS와 IDC를 구분하 는 pSUV는 2.30(민감도 73.0%, 특이도 76.9%)으로 나타났 고 이전 연구와 큰 차이는 보이지 않았다. 또한 pSUV의 진단적 정확도는 86.7%(95% confidence interval, 0.756~0.977)로 이전 연구와 비슷한 수준이었다(19, 31, 32). Crippa 등(33)의 연구에서 IDC의 조직등급에 따른 pSUV의 평균값은 3등급이 6.2이고, 1, 2등급에서 4.2로 보고하였고, Jeong 등(18)의 연 구에서는 3등급 7.0, 1, 2등급은 3.9로 보고하였다. 본 연구 에서도 pSUV는 조직등급이 높고, 종양크기가 클수록 통계적 으로 유의한 높은 값을 보였다(p < 0.05). 하지만 림프절 전이
breast lesions: comparing the apparent diffusion coeffi- cient (ADC) values and the pathologic results. J Korean Soc Radiol 2011;64:375-381
9. Marini C, Iacconi C, Giannelli M, Cilotti A, Moretti M, Bar- tolozzi C. Quantitative diffusion-weighted MR imaging in the differential diagnosis of breast lesion. Eur Radiol 2007;
17:2646-2655
10. Heusner TA, Kuemmel S, Koeninger A, Hamami ME, Hahn S, Quinsten A, et al. Diagnostic value of diffusion-weight- ed magnetic resonance imaging (DWI) compared to FDG PET/CT for whole-body breast cancer staging. Eur J Nucl Med Mol Imaging 2010;37:1077-1086
11. Costantini M, Belli P, Rinaldi P, Bufi E, Giardina G, France- schini G, et al. Diffusion-weighted imaging in breast cancer:
relationship between apparent diffusion coefficient and tu- mour aggressiveness. Clin Radiol 2010;65:1005-1012 12. Bae SY, Lee EH, Park JM, Kwak JJ. 18F-fluorodeoxyglucose
positron emission tomography/CT scan findings for ductal carcinomas of breast: association of standardized uptake value and histological findings. J Korean Soc Radiol 2012;
66:169-175
13. Jadvar H, Alavi A, Gambhir SS. 18F-FDG uptake in lung, breast, and colon cancers: molecular biology correlates and disease characterization. J Nucl Med 2009;50:1820- 1827
14. Crowe JP Jr, Adler LP, Shenk RR, Sunshine J. Positron emis- sion tomography and breast masses: comparison with clinical, mammographic, and pathological findings. Ann Surg Oncol 1994;1:132-140
15. Oshida M, Uno K, Suzuki M, Nagashima T, Hashimoto H, Yagata H, et al. Predicting the prognoses of breast carci- noma patients with positron emission tomography using 2-deoxy-2-fluoro[18F]-D-glucose. Cancer 1998;82:2227- 2234
16. Rosen EL, Eubank WB, Mankoff DA. FDG PET, PET/CT, and breast cancer imaging. Radiographics 2007;27 Suppl 1:S215-S229
17. Lee SH, Cho N, Kim SJ, Cha JH, Cho KS, Ko ES, et al. Corre- lation between high resolution dynamic MR features and prognostic factors in breast cancer. Korean J Radiol 2008;
9:10-18
18. Jeong SH, Lee EH, Park JM, Lee HK, Yi BH, Choi N. Factors 다. 하지만 이는 관심영역을 작게 설정하고 최대한 균질한 부
분에서 ADC값을 측정하여 큰 영향은 없을 것으로 생각된다.
결론적으로, 본 연구에서 유방암 병변의 크기가 크고 조직등 급이 높을수록 높은 pSUV를 보였고, 조직등급이 높을수록 ADC값이 감소하였다. 또한 pSUV와 ADC값은 유의한 음의 상관관계를 나타내어 pSUV/ADC는 종양 크기가 크고, 유방 암의 조직등급이 높을수록 증가하였다. ADC값과 pSUV 각각 의 정확도에 비해 pSUV/ADC의 진단적 정확도가 유의하게 높으므로, DWI와 PET/CT 검사 결과를 종합적으로 판단하는 것이 유방암의 진단, 조직등급 및 예후 예측의 정확도 향상에 도움이 될 것으로 생각된다.
참고문헌
1. Orel SG. High-resolution MR imaging for the detection, diagnosis, and staging of breast cancer. Radiographics 1998;18:903-912
2. Ikeda DM, Baker DR, Daniel BL. Magnetic resonance imag- ing of breast cancer: clinical indications and breast MRI reporting system. J Magn Reson Imaging 2000;12:975- 983
3. Bluemke DA, Gatsonis CA, Chen MH, DeAngelis GA, De- Bruhl N, Harms S, et al. Magnetic resonance imaging of the breast prior to biopsy. JAMA 2004;292:2735-2742 4. Siegmann KC, Müller-Schimpfle M, Schick F, Remy CT, Fer-
sis N, Ruck P, et al. MR imaging-detected breast lesions:
histopathologic correlation of lesion characteristics and signal intensity data. AJR Am J Roentgenol 2002;178:
1403-1409
5. Bogner W, Gruber S, Pinker K, Grabner G, Stadlbauer A, Weber M, et al. Diffusion-weighted MR for differentiation of breast lesions at 3.0 T: how does selection of diffusion protocols affect diagnosis? Radiology 2009;253:341-351 6. Belli P, Costantini M, Bufi E, Magistrelli A, La Torre G,
Bonomo L. Diffusion-weighted imaging in breast lesion evaluation. Radiol Med 2010;115:51-69
7. Park MJ, Cha ES, Kang BJ, Ihn YK, Baik JH. The role of dif- fusion-weighted imaging and the apparent diffusion co- efficient (ADC) values for breast tumors. Korean J Radiol 2007;8:390-396
8. Ahn HS, Chang YW, Choi KH, Kim HJ, Hong SS, Hwang JH, et al. Usefulness of diffusion-weighted MR imaging for
27. Kuhl CK. MRI of breast tumors. Eur Radiol 2000;10:46-58 28. Bartella L, Smith CS, Dershaw DD, Liberman L. Imaging
breast cancer. Radiol Clin North Am 2007;45:45-67 29. Buck A, Schirrmeister H, Kühn T, Shen C, Kalker T, Kotzerke
J, et al. FDG uptake in breast cancer: correlation with bio- logical and clinical prognostic parameters. Eur J Nucl Med Mol Imaging 2002;29:1317-1323
30. Ueda S, Tsuda H, Asakawa H, Shigekawa T, Fukatsu K, Kon- do N, et al. Clinicopathological and prognostic relevance of uptake level using 18F-fluorodeoxyglucose positron emission tomography/computed tomography fusion im- aging (18F-FDG PET/CT) in primary breast cancer. Jpn J Clin Oncol 2008;38:250-258
31. Fueger BJ, Weber WA, Quon A, Crawford TL, Allen-Auer- bach MS, Halpern BS, et al. Performance of 2-deoxy-2- [F-18]fluoro-D-glucose positron emission tomography and integrated PET/CT in restaged breast cancer patients. Mol Imaging Biol 2005;7:369-376
32. Tatsumi M, Cohade C, Mourtzikos KA, Fishman EK, Wahl RL. Initial experience with FDG-PET/CT in the evaluation of breast cancer. Eur J Nucl Med Mol Imaging 2006;33:
254-262
33. Crippa F, Seregni E, Agresti R, Chiesa C, Pascali C, Bogni A, et al. Association between [18F]fluorodeoxyglucose uptake and postoperative histopathology, hormone receptor status, thymidine labelling index and p53 in primary breast cancer:
a preliminary observation. Eur J Nucl Med 1998;25:1429- 1434
34. Hatakenaka M, Soeda H, Yabuuchi H, Matsuo Y, Kamitani T, Oda Y, et al. Apparent diffusion coefficients of breast tu- mors: clinical application. Magn Reson Med Sci 2008;7:
23-29
35. Kawashima M, Tamaki Y, Nonaka T, Higuchi K, Kimura M, Koida T, et al. MR imaging of mucinous carcinoma of the breast. AJR Am J Roentgenol 2002;179:179-183
affecting 18F-fluorodeoxyglucose (FDG) uptake in breast cancer. J Korean Soc Radiol 2010;63:287-292
19. Nakajo M, Kajiya Y, Kaneko T, Kaneko Y, Takasaki T, Tani A, et al. FDG PET/CT and diffusion-weighted imaging for breast cancer: prognostic value of maximum standardized uptake values and apparent diffusion coefficient values of the primary lesion. Eur J Nucl Med Mol Imaging 2010;37:
2011-2020
20. Vargas HA, Akin O, Franiel T, Mazaheri Y, Zheng J, Mos- kowitz C, et al. Diffusion-weighted endorectal MR imag- ing at 3 T for prostate cancer: tumor detection and as- sessment of aggressiveness. Radiology 2011;259:775-784 21. Park SH, Moon WK, Cho N, Chang JM, Im SA, Park IA, et al.
Comparison of diffusion-weighted MR imaging and FDG PET/CT to predict pathological complete response to neo- adjuvant chemotherapy in patients with breast cancer. Eur Radiol 2012;22:18-25
22. Riegger C, Herrmann J, Nagarajah J, Hecktor J, Kuemmel S, Otterbach F, et al. Whole-body FDG PET/CT is more accu- rate than conventional imaging for staging primary breast cancer patients. Eur J Nucl Med Mol Imaging 2012;39:
852-863
23. Kumar R, Chauhan A, Zhuang H, Chandra P, Schnall M, Alavi A. Clinicopathologic factors associated with false negative FDG-PET in primary breast cancer. Breast Cancer Res Treat 2006;98:267-274
24. Razek AA, Gaballa G, Denewer A, Nada N. Invasive ductal carcinoma: correlation of apparent diffusion coefficient value with pathological prognostic factors. NMR Biomed 2010;23:619-623
25. Elston CW, Ellis IO. Pathological prognostic factors in breast cancer. I. The value of histological grade in breast cancer: experience from a large study with long-term fol- low-up. Histopathology 1991;19:403-410
26. Elston CW. Classification and grading of invasive breast carcinoma. Verh Dtsch Ges Pathol 2005;89:35-44
유방암 진단에 있어 3 T 확산강조영상의 현성확산계수값과 양전자방출단층촬영술의 최대표준섭취계수의 유방암 예후 예측
가능성: 유방암 예후인자에 대한 평가
1임성주
1· 김금원
1· 장혜영
1· 황철목
1· 김대호
1· 손장신
2· 김진숙
3· 이진용
4목적: 유방 병변에 대한 확산강조영상의 현성확산계수(apparent diffusion coefficient; 이하 ADC)값과 양전자방출단층 촬영술의 최대표준섭취계수(peak standardized uptake value; 이하 pSUV)를 구하여 유방암의 조직등급과 유방의 예후 인자의 상관관계를 알아보고자 하였다.
대상과 방법: 조직이 확진된 49명의 50개의 유방암(연령: 37~83세, 평균: 53세)을 후향적으로 분석하였다. 각 병변의 ADC값과 pSUV를 유방암의 예후 인자들(나이, 종양크기, 조직등급, 림프절 전이, 호르몬 수용체, HER-2 수용체)의 연 관성을 분석하였다.
결과: 조직 검사 결과, 관상피내암이 4개, 침윤성 관상피암이 46개(조직등급: 1등급 10개, 2등급 13개, 3등급 23개)였 다. pSUV와 조직등급, 종양크기는 유의한 상관관계를 보였고, ADC값은 조직등급과 유의한 상관관계를 보였다(p < 0.05). 유방암의 조직등급이 높아짐에 따라 pSUV와 pSUV/ADC는 증가하였고, ADC값은 낮아졌다(p < 0.05).
pSUV/ADC의 진단적 정확도(90.2%)가 pSUV(86.7%)와 ADC값(25.4%)보다 높았다(p < 0.05).
결론: pSUV, ADC값과 pSUV/ADC는 유방암의 조직등급, 종양의 크기와 유의한 상관관계를 보였고, pSUV/ADC는 진단적 정확도가 유의하게 높아 pSUV와 ADC값은 유방암의 조직등급과 예후 예측에 도움이 된다.
건양대학교 의과대학 1영상의학과학교실, 2병리학과학교실, 3핵의학과학교실, 4예방의학과학교실