I N T RO D U CT I O N
Understanding to the hemodynamic parameter in stroke is helpful to predict the functional out- come and to decide the rescue therapy to a poten- tially reversible area. Positron emission tomogra- phy(PET) studies show a variably altered interplay among local cerebral blood flow(CBF), cerebral blood volume(CBV), cerebral metabolism rate of
o x y g e n ( C M R O
2) and cerebral metabolic rate of glucose(CMRGlu) value, allowing one to define distinct profiles of changes in physiologic coupling each understanding a different pathophysiologic s i t u a t i o n
1 - 3. PET, however, is not routinely avail- able method and has poor anatomical detail.
Recently, perfusion MRI can be another method to assess the tissue perfusion combined with good spatial resolution of MRI
4. Early report suggests that CBV may be the best predictor of final lesion size, while recent report has found a measure of perfusion delay to be the best predictor
5 - 7. Particularly neurally connected remote area with reversible hypofunction, referred as diaschisis, shows decreased regional CBF(rCBF) and regional CBV(rCBV) and increased oxygen extraction frac-
천막상부 뇌졸중에서 소뇌의 혈역학 변화
-Dynamic Susceptibility Contrast MR 영상을 이용한-
가톨릭대학교 의과대학 신경과학교실, 가톨릭대학교 의과대학 방사선과학교실
한시령・김범수・곽태호・최영빈・김영인
Effect of Supratentorial Stroke on Cerebellar Hemodynamic Parameters - Assessment by Dynamic Susceptibility Contrast MR Imaging
Si-Ryung Han, M.D.
1, Bum-Soo Kim, M.D.
2, Tae-Ho Guak, M.D.
1, Young-Bin Choi, M.D.
1, Yeong-In Kim, M.D.
1Departments of Neurology
1& Radiology
2, College of Medicine, The Catholic University of Korea, Seoul, Korea
Background & Purpose : Dynamic susceptibility contrast MR imaging, one method of perfusion MRI, was devel- oped to define cerebral hemodynamic status with good anatomical resolution. The authors investigated hemodynamic parameters using this imaging method, in an effort to identify hemodynamic changes on the remote crossed cerebellum of patients with a supratentorial infarct.
Methods : Dynamic susceptibility contrast MR imaging was performed in 15 patients with only unilateral supratento- rial infarcts. Imaging was obtained at the anatomic level of the cerebellum. rCBF, rCBV, MTT and TP were determined over both cerebellar hemispheres of interest.
Results : The rCBF and rCBV values of the contralateral cerebellar hemisphere were significantly more decreased than those of the ipsilateral cerebellar hemisphere in 12 patients(p=0.028, 0.033). MTT and TP values of the contralater- al and ipsilateral cerebellar hemispheres didn’t reveal any differences(p=0.130, 0.121).
Conclusions : The results of this work suggest that the region which are remote from the ischemic brain lesion shows no changes of MTT or TP but show decrease of rCBF and rCBV, mean to diaschisis, it also demonstrates that perfusion MRI is an easily available method to evaluate the hemodynamic status of the brain.
Key Words : Diaschisis, Dynamic susceptibility contrast MRI, Cerebral blood flow, Cerebral blood volume, Mean transit time, Time to peak
Address for correspondence Yeong-In Kim, M.D.
Department of Neurology, Kang-Nam St. Mary’s Hospital, The Catholic University of Korea
#505 Banpo-dong, Seocho-gu, Seoul 137-080, Korea
Tel : +82-2-590-2213 Fax : +82-2-599-9686
E-mail : [email protected]
tion(OEF) in the studies using PET
8 - 1 0. Although, a few studies observed decreased rCBF and rCBV with perfusion MRI
1 1 , 1 2, there is no report about mean transit time(MTT) and time to peak(TP) meaning the perfusion time. So, the authors ana- lyzed the rCBF, rCBV and MTT and TP on the cerebellum in the patients with supratentorial stroke by using perfusion MRI.
PAT I E N TS and M E T H O D S
Fifteen patients who had unilateral supratento- rial stroke without cerebellar lesion(10 men and 5 women; age 40~83, mean 64.3 years) performed with dynamic susceptibility contrast MR imaging at 1 to 15 days after the onset of symptoms. Four
patients had superficial middle cerebral artery(MCA) infarct, four had deep MCA infarct, six had ICA or proximal MCA infarct, and 1 had anterior choroidal artery infarct.
M R I
A 1.5T MR imaging system(Simens) was used to acquire fast spin-echo T2-weighted images before the administration of the contrast agent(repetition time/echo time = 3500 msec/100 msec; section thickness 7 mm; field of view 230;
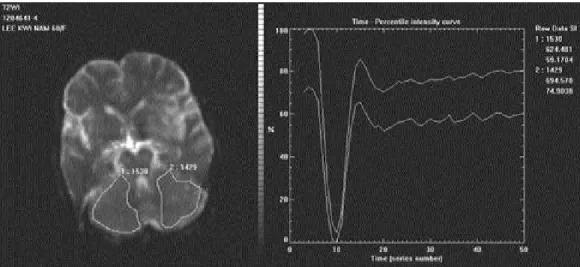
matrix 230×256). T2-weighted dynamic suscepti- bility contrast MR imaging was performed with a gradient echo echo-planar image(EPI) sequence(flip angle 90° , field of view 230; section thickness 7 mm; matrix 128(180). After three Figure 1. Patient 11. Fast SE T2 weighted image showed high signal intensity on left MCA territory with-
out cerebellar lesion. Two ROIs is drawn in the bilateral cerebellar hemisphere for T2* rate change-time curve, and T2* rate change-time curve measured in ROIs in both cerebellar hemisphere shows a decrease in relative regional cerebellar blood flow in right cerebellar hemisphere.
Table 1. Patient data
Patients No./Sex/Age(y) Lesion location No of days after onset of symptoms
1.M/59 Lt lenticulostrate artery 3
2.F/40 Rt ICA 15
3.F/82 Lt M2 cortical branch 2
4.F/65 Rt M2 posterior branch 1
5.M/72 Rt M2 anterior branch 2
6.M/64 Rt MCA 3
7.M/57 Rt MCA 1
8.M/80 Lt MCA 8
9.M/45 Lt striatocapsular infarct 2
10.F/69 Lt striatocapsular infarct 12
11.F/68 Lt MCA 3
12.M/83 Lt MCA 4
13.M/49 Rt M2 anterior branch 4
14.M/60 Lt anterior choroidal artery 2
15. M/72 Lt anterior & posterior borderzone infarct 5
Lt : left, Rt : right
images were obtained, a bolus injection of 0.2 mmol per kilogram of body weight gadolinium(Magnevist; Schering, Germany) was administered through a 20-gauge intravenous needle, which was inserted into the vein of the right antecubital fossa. Imaging time was 1 sec per image without interimage delay; a total of 50 images were obtained. The T2-weighted dynamic images were obtained at the same location. The raw signal intensity time series data were con- verted to concentration-time data(fig. 1). The area under the concentration-time curve is pro- portional to the local blood volume
1 3. The map of CBV was calculated as the sum of the first-pass T2 rate change image calculated on pixel-by- pixel basis. TP was defined as the time reaching to the peak of the concentration-time curve.
MTT, then, was calculated as a time reaching to a
half of CBV. CBF was computed from CBV/MTT ratio.
In the T2-weighted dynamic image, a skillful radiologist drew the region of interest(ROI) on both cerebellar hemisphere, and took care not to include the sinus in the ROI. The ROIs were then copied on the CBF, CBV, MTT, and TP images.
S t a t i s t i c s
Paired t test was used to analyze the differences among rCBV, rCBF, MTT, and TP in the ipsilater- al and contralateral cerebellum to the cerebral lesion. The differences giving p<0.05 were consid- ered significant.
R E S U LTS
All patients showed no morphologic alterations Figure 2. Patient 13(A). Map of regional cerebellar blood volume. The left cerebellum shows crossed
cerebellar hypoperfusion(B). Map of regional cerebellar blood flow. The left cerebellum showed crossed
cerebellar hypoperfusion(C). Map of MTT of cerebellum. There is no significant difference between both
cerebellar hemispheres(D). Map of TP of cerebellum. There is no significant difference between both cere-
bellar hemispheres.
on the cerebellum in conventional T2-weighted images.
There were no significant differences on the bilateral cerebellar hemispheres in diffusion and ADC(apparent diffusion coefficient) image. The rCBV and rCBF in the contralateral cerebellar hemisphere(rCBF = 127.2226±44.7437, rCBV = 2 7 4 5 . 0 3 5 3±857.6772) were lower than those in the ipsilateral side(rCBF = 140.6487±6 0 . 4 9 6 2 , rCBV =3071.0713±1217.5017)(p=0.009, 0.011). The MTT and TP had no significant differences between the ipsilateral(MTT = 22.1002±3 . 8 2 5 6 , TP = 15.1604±5.2204) and contralateral side(MTT
= 21.8896±3.9083, TP = 15.2471±5 . 1 6 0 9 ) ( p = 0 . 1 3 0 , 0.121).(Figure2, Table 2). Three patients(case 5,6 and 11) showed higher rCBV and rCBF on the contralateral cerebellum than those on the ipsi- lateral cerebellum, but their values did not exceed above 10 % compared to the ipsilateral cerebel- l u m .
D I S C U S S I O N
In contrast MTT and TP, rCBF and rCBV were significantly decreased in the contralateral cere- bellar hemisphere. These results agree with PET study by Yamauchi et al.
8, in which they evaluat-
ed the hemodynamic and metabolic parameters in the patients with unilateral supratentorial stroke that showed decreased the regional blood volume with normal ratio of regional blood flow to regional blood volume in the contralateral cere- bellum.
In the ischemic brain, there are variable pat- terns in the hemodynamic failure according to the disruption in the physiologic flow-metabolism coupling, such as phase of autoregulation, misery perfusion with oligemia or true ischemia, irre- versible complete infarct, luxury perfusion, and primary metabolic depression, namely diaschisis
1 -3