저작자표시-비영리-변경금지 2.0 대한민국 이용자는 아래의 조건을 따르는 경우에 한하여 자유롭게
l 이 저작물을 복제, 배포, 전송, 전시, 공연 및 방송할 수 있습니다. 다음과 같은 조건을 따라야 합니다:
l 귀하는, 이 저작물의 재이용이나 배포의 경우, 이 저작물에 적용된 이용허락조건 을 명확하게 나타내어야 합니다.
l 저작권자로부터 별도의 허가를 받으면 이러한 조건들은 적용되지 않습니다.
저작권법에 따른 이용자의 권리는 위의 내용에 의하여 영향을 받지 않습니다. 이것은 이용허락규약(Legal Code)을 이해하기 쉽게 요약한 것입니다.
Disclaimer
저작자표시. 귀하는 원저작자를 표시하여야 합니다.
비영리. 귀하는 이 저작물을 영리 목적으로 이용할 수 없습니다.
변경금지. 귀하는 이 저작물을 개작, 변형 또는 가공할 수 없습니다.
보건학석사 학위논문
Comparison between Time Integrated Sampling and Direct Reading Sampling of
Nanoparticulate at the Workplace
작업장의 나노입자상 물질에 대한
시간누적 시료채취와 실시간 시료채취 방법 비교
2015 년 2 월
서울대학교 보건대학원
환경보건학과 산업보건전공
김 선 주
Comparison between Time Integrated Sampling and Direct Reading Sampling of
Nanoparticulate at the Workplace
작업장의 나노입자상 물질에 대한
시간누적 시료채취와 실시간 시료채취 방법 비교
지도교수 윤 충 식
이 논문을 보건학석사 학위논문으로 제출함 2014 년 10 월
서울대학교 보건대학원 환경보건학과 산업보건전공
김 선 주
김 선 주의 보건학석사 학위논문을 인준함 2014 년 12 월
위 원 장 이 승 묵 (인 )
Comparison between Time Integrated Sampling and Direct Reading Sampling of Nanoparticulate at the Workplace
Sunju Kim Department of Environmental Health Graduate School of Public Health Seoul National University, Korea
Advisor Chungsik Yoon, Ph.D., CIH
Objective Nanoparticles are generated by engineered and unintended in a variety of workplaces and process. Nanoparticles generation in unintended nanoparticle emitting workplace may originate from hot process, welding process. Number and surface area concentration of nanoparticles is generally assessed by a variety of direct reading instruments unlike traditional method. The purposes of this study were to compare time integrated sampling and direct reading instrument sampling method at nanoparticles generation workplaces, and to compare statistically full time sampling and time interval sampling categorized by time integrated sampling method. As characteristics of a variety of workplaces measured in this study were investigated, this study suggests appropriate sampling method by workplace.
Methods Sampling was used two methods; the way to use a filter which sampled
direct reading instrument such as SMPS, DustTrak, AeroTrak. Each filter was measured the direct reading instrument simultaneously, and for full time sampling compared with time interval, time interval sampling is measured for working time while replacing a filter by predetermined time interval. Analysis is performed for mass, metals, and TEM. Statistical analysis is performed to compare associations between metrics.
Results Concentrations measured at unintended nanoparticle emitting workplaces were higher than those at engineered nanoparticle manufacturing workplaces. CV of concentration is larger as shorter time interval. Full time samples were
significantly higher coefficient than time interval samples in spearman’s rank test.
Conclusions As PM2.5 concentration out of total mass concentration measured at welding workplaces was above 90%, mass concentration is recommended by gravimetric method. Although concentration measured at engineered nanoparticle manufacturing workplaces was relatively low, nanoparticles generation ratio is high. Therefore, the best way of sampling methods are recommended by using together direct reading instrument and gravimetric sampling method.
Keyword: Engineered nanoparticles, Unintended nanoparticles, Direct reading instrument, Time Integrated Sampling, Sampling method
Student number: 2012-21841
Contents
Abstract ··· i
Contents ··· iii
List of Tables ··· iv
List of Figures ··· v
1 Introduction ··· 1
2 Methods and materials ··· 4
2.1 Definition of expression ··· 4
2.2 Study design ··· 5
2.3 Sampling methods ··· 11
2.3.1 Time integrated sampling ··· 11
2.3.2 Direct reading sampling method ··· 13
2.4 Analysis methods ··· 15
2.5 Statistical analysis ··· 16
3 Results ··· 17
3.1 Characteristics of workplaces ··· 17
3.2 Comparison of time integrated sampling and direct reading sampling method ··· 24
3.3 Comparison of full time and time interval sampling methods Comparison of the full shift and time-interval sampling methods ··· 28
4 Discussions ··· 33
5 Conclusions ··· 38
6 References ··· 39
List of Tables
Table 1. Summary of workplace characteristics ··· 8 Table 2. Characteristics of direct-reading instruments ··· 14 Table 3. Offline and online concentrations ··· 18 Table 4. Coefficient of variation (CV) based on the results from time-
interval gravimetric sampling and DustTrak direct-reading sampling from
one day ··· 27
Table 5. Spearman correlation coefficient result ··· 30
Table 6. Characteristics of online and offline monitoring results according to
workplace type··· 37
List of Figures
Figure 1. Diagram of sampling strategy in this study. ··· 6
Figure 2. The layout of workplaces. ··· 10
Figure 3. Size distributions from SMPS data from each workplace. ··· 21
Figure 4. TEM images from monitored workplaces. ··· 23
Figure 5. Time-integrated sampling results and DustTrak direct-reading sampling results. ··· 26
Figure 6. Regression analysis of full shift and time-interval gravimetric
sampling data compared to direct-reading sampling data. ··· 32
Aerosol sampling methods have long been in use, from the 19th century, when they were initially developed from sugar tubes, to the invention of time-weighted average (TWA) sampling methods in the 1970s, which are still used today (Spurny, 1998). However, although sampling methods are able to collect smaller-sized particles as newer technology is developed, time-integrated sampling (i.e.
gravimetric sampling) is still the reference method used by the National Institute for Occupational Safety and Health (NIOSH), the United States Environmental Protection Agency (EPA), and the Korea Occupational Safety and Health Agency (KOSHA).
With recent developments in nanotechnology, it is possible not only to generate engineered nanoparticles (particles <100 nm in diameter) in a variety of
workplaces and processes but also to measure nano-sized particles. However, many toxicity studies have shown that the toxicity of nanoparticles, also known as ultrafine particles (UFPs), is greater than that of the same mass of larger particles of similar chemical composition. Many studies have also shown that exposure to nanoparticles causes respiratory and cardiovascular diseases (NIOSH, 2009).
Workplaces with nanoparticle exposure are categorized as either unintended
concentrations have been reported in workplaces where activities such as high- temperature and welding processes take place (Zimmer et al., 2002; Maynard et al., 2002; Elihn et al., 2009).
However, sampling of nanoparticles is limited to assessment by gravimetric sampling methods, which is the traditional method (Heitbrink et al., 2009). A reference method for nanoparticle exposure assessment has not yet been determined; however, assessment methods generally use three metrics: number, surface area, and mass concentration. Instead of using the traditional method, number and surface area concentration are normally assessed by a variety of direct- reading instruments such as a condensation particle counter (CPC), scanning mobility particle sizer (SMPS), or DustTrak aerosol monitor. Mass concentrations of nanoparticles are generally underestimated compared to larger particles
(Heitbrink et al., 2009).
Although gravimetric sampling is the reference method, it cannot identify variations in concentration because particles are collected over a long period of time (Morawska et al., 2003). The TWA method over an 8-hour period as a time- integrated sampling method may underestimate particulate exposure in the workplace because the variation in exposure during the work day is large, ranging from background concentrations, such as during break time, to outdoor
concentrations and working concentrations. However, unlike direct-reading instruments, with traditional sampling it is possible to identify the chemical composition, morphology, and size of particles. One drawback of direct-reading
compared measurements from time-integrated sampling methods, such as fine particulate matter (PM2.5) concentrations, to those from direct-reading instruments, such as a mass-based DustTrak (Kim et al., 2004; Zhu et al., 2011).
The purposes of this study were to compare time-integrated sampling methods and direct-reading instrument sampling methods at nanoparticle generating workplaces, and to statistically compare direct-reading instrument sampling methods and time-integrated sampling methods. Also, as we investigated the characteristics of a variety of workplaces in this study, we suggest appropriate sampling methods according to workplace type.
2 Methods and materials
2.1 Definition of expression
l Offline monitoring: gravimetric sampling l Online monitoring: direct reading sampling
l CV (Coefficient of Variation): ratio of the standard deviation to the mean l “1 min” (1 min for DustTrak; Table 4): 1 min is collected by DustTrak
data in the same time periods with gravimetric sample (DustTrak logging time is 1 min).
l “TIS time” (Time Interval Sampling time for DustTrak; Table 4): TIS is selected by DustTrak data that calculated by geometric mean respectively in the same time periods with gravimetric sample time. TIS sample numbers are the same with gravimetric those.
2.2 Study design
This study was conducted at two engineered nanoparticle manufacturing workplaces (workplaces A and B) and at two unintended nanoparticle emitting workplaces (workplaces C and D) where welding processes took place.
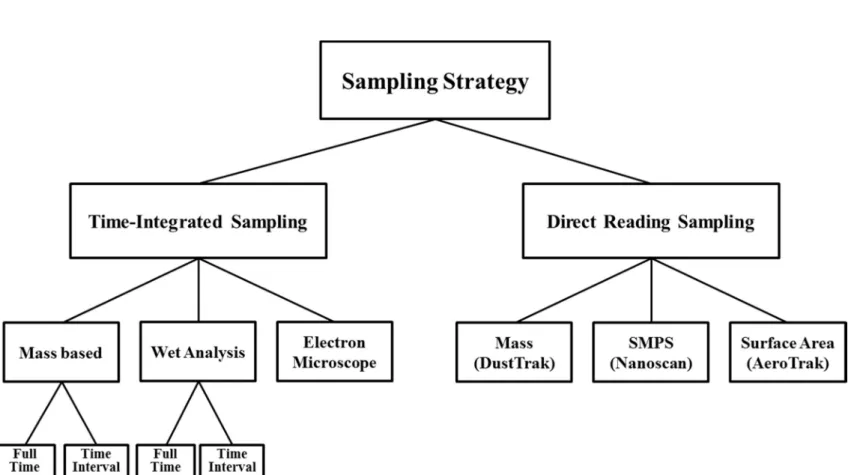
Measurements were performed for 2 days at each workplace. Sampling was conducted during two full working shifts and once overnight at all workplaces, except for workplace B, which was sampled for one full working shift and once overnight. The complete sampling strategy design is shown in Figure 1.
Figure 1. Diagram of sampling strategy in this study.
Workers in workplaces A and B, engineered nanoparticle manufacturing workplaces, were exposed to particles during processes such as bagging and collecting. In workplace A, amorphous silica of 7 - 40 nm average diameter was manufactured, and each process was an automatic system, with the exception of bagging, which was measured in this study. At workplace B, metallic nanopowders such as aluminum, iron, copper, nickel, and silver were manufactured.
Nanopowders were produced by the pulsed wire evaporation method, and the main products were copper-nickel and nickel nanopowder.
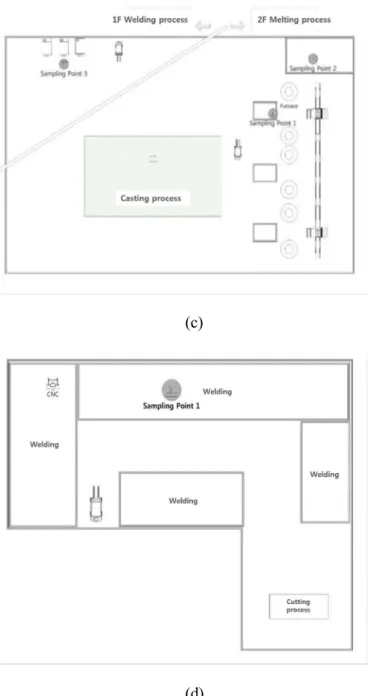
In workplaces C and D, unintended nanoparticle emitting workplaces with high temperatures, particles were generated from fumes generated during welding and melting processes. An automobile engine part was manufactured in workplace C, and sampling was conducted at the melting process on the first day and at the welding process on the second day. Body frames for heavy equipment, such as forklifts, were manufactured in workplace D, which was located at an industrial complex. Sampling was measured at the welding process.
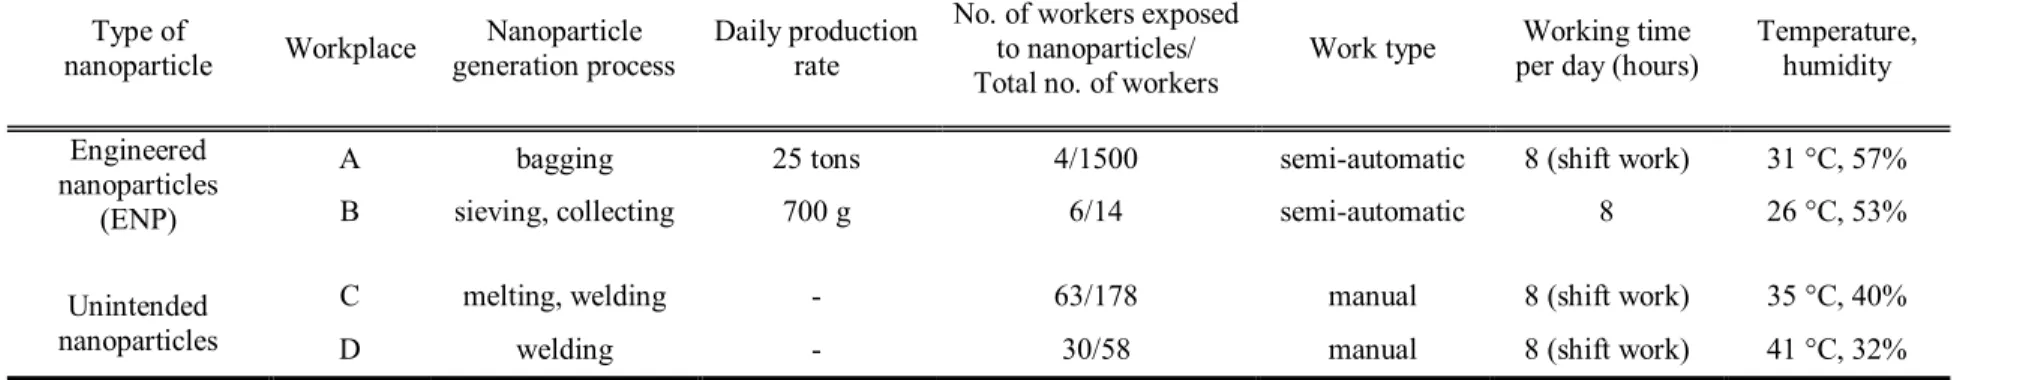
Table 1. Summary of workplace characteristics Type of
nanoparticle Workplace Nanoparticle
generation process Daily production rate
No. of workers exposed to nanoparticles/
Total no. of workers
Work type Working time
per day (hours) Temperature, humidity Engineered
nanoparticles (ENP)
A bagging 25 tons 4/1500 semi-automatic 8 (shift work) 31 °C, 57%
B sieving, collecting 700 g 6/14 semi-automatic 8 26 °C, 53%
Unintended nanoparticles
C melting, welding - 63/178 manual 8 (shift work) 35 °C, 40%
D welding - 30/58 manual 8 (shift work) 41 °C, 32%
(a)
(b)
(c)
(d)
Figure 2. The layout of workplaces (a) Workplace A, (b) Workplace B, (c) Workplace C, (d) Workplace D.
2.3 Sampling methods
Sampling was measured using two methods. The first method was time-
integrated sampling using filters categorized for mass analysis, metal analysis, and electron microscope analysis. The second method used direct-reading instruments categorized by measurement metrics.
2.3.1 Time integrated sampling
The time-integrated sampling used filters to measure mass concentrations and identify metal contents for quantitative analysis. An electron microscope was used to determine the size, morphology, and aggregation of particles for qualitative analysis. Polyvinyl chloride (PVC Filter, 37 mm, 5 ㎛, Millipore, Germany) was
used for gravimetric analysis according to NIOSH method no. 0500, and mixed cellulose ester membrane filters (MCE Filter, 37 mm, 0.45 ㎛, Millipore, Germany) were used for metal analysis according to NIOSH method no. 7300. A transmission electron microscopy (TEM) grid (Q225-CR1, 200 mesh copper, EMS, USA) was used to analyze particle sizes and morphologies with an electron microscope.
The following equation was used to estimate the minimum sampling volume for workplace measurements and evaluations:
( ) =
(㎍)( /㎥ )
(eq. 1),
where Ve is the estimated minimum sampling volume, LOQ is the limit of quantification of the measuring device, which is generally threefold the limit of detection (LOD), and Q is the estimated concentration in the workplace.
2.3.2 Direct reading sampling method
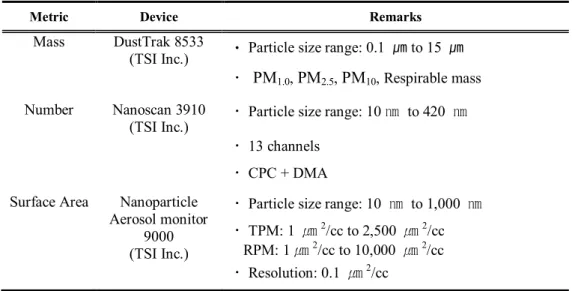
Table 2 shows characteristics of the direct-reading instruments. A Nanoscan SMPS (3910, TSI, USA) was used to measure particle number concentrations, a DustTrak aerosol monitor (8533 TSI, USA) was used to measure mass
concentrations, and an AeroTrak nanoparticle aerosol monitor (9000, TSI, USA) was used to measure surface concentrations. To confirm the characteristics of the particulates generated during the work, researchers directly recorded in time activity diary (TAD).
Table 2. Characteristics of direct-reading instruments
Metric Device Remarks
Mass DustTrak 8533
(TSI Inc.) ㆍParticle size range: 0.1 ㎛to 15 ㎛ ㆍ PM1.0, PM2.5, PM10, Respirable mass Number Nanoscan 3910
(TSI Inc.) ㆍParticle size range: 10㎚ to 420 ㎚ ㆍ13 channels
ㆍCPC + DMA Surface Area Nanoparticle
Aerosol monitor 9000 (TSI Inc.)
ㆍParticle size range: 10 ㎚ to 1,000 ㎚ ㆍTPM: 1 ㎛2/cc to 2,500 ㎛2/cc
RPM: 1㎛2/cc to 10,000 ㎛2/cc ㆍResolution: 0.1 ㎛2/cc
2.4 Analysis methods
The PVC filters were stored in a constant temperature/humidity chamber for at least 24 hours (20 °C±5, 55%±5), and then weighed using an analytical balance (Ultra Microbalance XP2U, METTLER TOLEDO, USA) to calculate the mass concentration.
MCE filters were placed into graphite sample decomposition blocks (i.e, vessel;
ECOPRE, ODLAB, Korea), 3 ml of ashing acid (nitric acid and perchloric acid 4:
1 mixtures) was added to the vessel, and the temperature was maintained at 130 °C for 30 min. Pretreated samples with a total capacity of 40 ml were analyzed by inductively coupled plasma atomic emission spectrometry (ICP-AES; Model Optima 3100 DV, Perkin-Elmer, USA). During analysis, the appropriate
wavelength for each metal was selected according to NIOSH method no. 7300. The target material in workplace A was silica, but metal content was used as a substitute for mass concentration due to the analysis limitations of ICP. The target materials in workplace B were copper and nickel, and the target materials in workplaces C and D were iron, manganese, chromium, copper, nickel, and zinc. The total metal content was calculated as the sum of the analytical results of each target material.
2.5 Statistical analysis
To compare the time-integrated and direct-reading sampling methods, all direct- reading instruments were placed next to the time-integrated sampling equipment and measurements were obtained simultaneously. A total of 42 paired datasets were collected. Eight pairs were excluded due to incomplete direct-reading or time- integrated measurements. Grubbs’ test was used to test for outliers; one sample was excluded as an outlier, leaving a total of 33 samples for further analysis. The direct- reading instrument dataset was compared to the time-integrated sampling dataset using the Kolmogorov-Smirnov test. All data were positively skewed, and therefore all of the direct-reading data were adapted to a log-normal distribution.
The Wilcoxon signed-rank test was used to compare the full shift and time- interval time-integrated sampling methods to the direct-reading sampling method.
In addition, Spearman’ rank correlation coefficient was used to identify
associations between the time-integrated and direct-reading sampling methods.
Linear regression modeling was performed to determine the coefficient of determination. All statistical analyses were performed using SPSS version 20.0 (IBM Inc., USA).
3 Results
3.1 Characteristics of workplaces
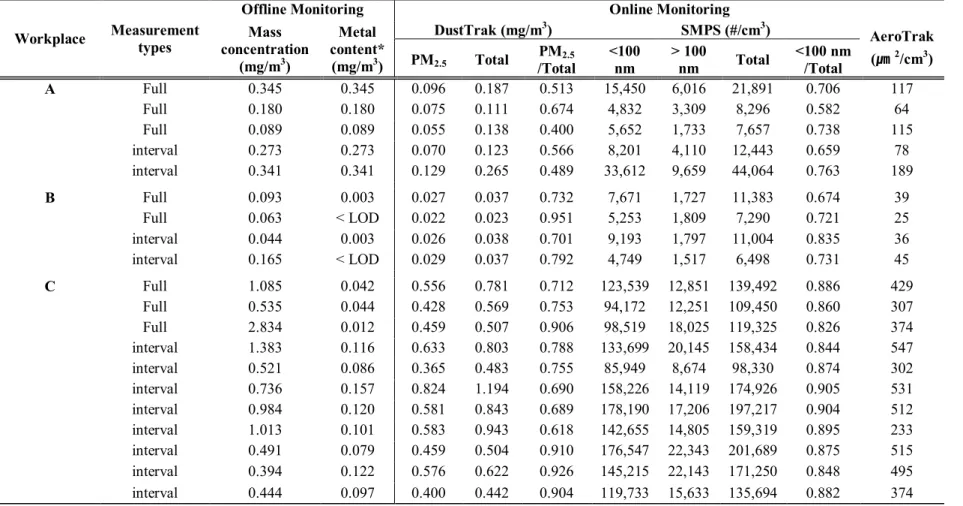
A summary of the direct-reading sampling and time-integrated sampling is provided in Table 3. The mass concentrations during offline monitoring were generally higher in the unintended nanoparticle emitting workplaces than in the engineered nanoparticle manufacturing workplaces.
Some metal content samples from workplace B were below the limit of detection (LOD) due to the small output. The total metal contents at workplaces C and D were higher than at workplaces A and B. In addition, metal contents measured at the welding process at workplace D were higher than at the welding process at workplace C.
For the online monitoring results, the DustTrak PM2.5/total particulate matter (TPM) ratios were >0.9 in workplaces C and D during the welding process, while the ratio was <0.9 during the melting process at workplace C. The highest SMPS measurement of the nanoparticle ratio (> 0.8) was observed at workplace C. The highest surface area concentration was observed at workplace D. As demonstrated
Table 3. Offline and online concentrations
Workplace Measurement types
Offline Monitoring Online Monitoring
Mass concentration
(mg/m3)
Metal content*
(mg/m3)
DustTrak (mg/m3) SMPS (#/cm3) AeroTrak
(㎛2/cm3) PM2.5 Total PM2.5
/Total
<100 nm
> 100
nm Total <100 nm /Total
A Full 0.345 0.345 0.096 0.187 0.513 15,450 6,016 21,891 0.706 117
Full 0.180 0.180 0.075 0.111 0.674 4,832 3,309 8,296 0.582 64
Full 0.089 0.089 0.055 0.138 0.400 5,652 1,733 7,657 0.738 115
interval 0.273 0.273 0.070 0.123 0.566 8,201 4,110 12,443 0.659 78
interval 0.341 0.341 0.129 0.265 0.489 33,612 9,659 44,064 0.763 189
B Full 0.093 0.003 0.027 0.037 0.732 7,671 1,727 11,383 0.674 39
Full 0.063 < LOD 0.022 0.023 0.951 5,253 1,809 7,290 0.721 25
interval 0.044 0.003 0.026 0.038 0.701 9,193 1,797 11,004 0.835 36
interval 0.165 < LOD 0.029 0.037 0.792 4,749 1,517 6,498 0.731 45
C Full 1.085 0.042 0.556 0.781 0.712 123,539 12,851 139,492 0.886 429
Full 0.535 0.044 0.428 0.569 0.753 94,172 12,251 109,450 0.860 307
Full 2.834 0.012 0.459 0.507 0.906 98,519 18,025 119,325 0.826 374
interval 1.383 0.116 0.633 0.803 0.788 133,699 20,145 158,434 0.844 547
interval 0.521 0.086 0.365 0.483 0.755 85,949 8,674 98,330 0.874 302
interval 0.736 0.157 0.824 1.194 0.690 158,226 14,119 174,926 0.905 531 interval 0.984 0.120 0.581 0.843 0.689 178,190 17,206 197,217 0.904 512 interval 1.013 0.101 0.583 0.943 0.618 142,655 14,805 159,319 0.895 233 interval 0.491 0.079 0.459 0.504 0.910 176,547 22,343 201,689 0.875 515 interval 0.394 0.122 0.576 0.622 0.926 145,215 22,143 171,250 0.848 495 interval 0.444 0.097 0.400 0.442 0.904 119,733 15,633 135,694 0.882 374
Workplace Measurement types
Offline Monitoring Online Monitoring
Mass concentration
(mg/m3)
Metal content*
(mg/m3)
DustTrak (mg/m3) SMPS (#/cm3) AeroTrak
(㎛2/cm3) PM2.5 Total PM2.5
/Total <100
nm > 100
nm Total <100 nm /Total
D Full 0.423 0.072 0.804 0.818 0.983 81,231 47,950 131,009 0.620 800
Full 0.217 0.012 0.507 0.528 0.959 41,859 18,932 63,299 0.661 309
Full 0.363 0.220 0.834 0.871 0.958 72,553 40,986 115,639 0.627 709
interval 0.830 0.277 1.019 1.054 0.966 138,446 80,369 222,092 0.623 1,374
interval 0.223 0.136 0.567 0.573 0.991 40,707 21,064 62,550 0.651 352
interval 1.040 0.155 1.152 1.180 0.976 154,935 92,574 250,216 0.619 1,539 interval 0.526 0.168 0.944 0.960 0.983 118,916 70,078 192,488 0.618 1,084 interval 0.637 0.384 1.028 1.089 0.943 121,439 59,093 186,741 0.650 1,122
interval 0.022 0.165 0.874 0.894 0.978 62,006 47,073 109,598 0.566 847
interval 0.048 0.086 0.511 0.520 0.983 20,222 9,370 29,810 0.678 135
interval 1.202 0.376 1.151 1.182 0.974 85,020 56,178 142,662 0.596 1,093
interval 1.163 0.342 0.909 0.976 0.932 100,286 51,252 155,053 0.647 863
interval 0.224 0.168 0.624 0.655 0.953 47,655 28,216 76,915 0.620 507
*Sum of target materials: workplace A = Si; workplace B = Cu, Ni; workplaces C and D = Fe, Mn, Cr, Cu, Ni, Zn; LOD (µg/sample): 0.0121 (Cu), 0.0089 (Cr), 0.0102 (Ni), 0.0106 (Mn), 0.0071 (Fe), 0.0080 (Zn).
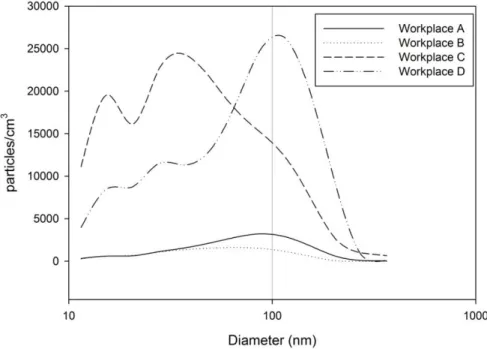
Figure 3 shows the size distributions of SMPS particle measurements for each workplace. The nanoparticle generation ratio was the highest at workplace C. The graph indicates bimodal distributions of nanoparticles at the unintended
nanoparticle emitting workplaces and normal distributions at the engineered nanoparticle manufacturing workplaces.
Figure 3. Size distributions from SMPS data from each workplace.
Figure 4 shows a TEM image for particle morphology, size, and aggregation analysis by electron microscopy. Small sized particles formed aggregates at the engineered nanoparticle manufacturing workplaces. There were both nanoparticles and larger particles observed at the melting process in workplace C, while almost all particles were nanoparticles at workplace D.
x 10,000 x 50,000 x 10,000 x 50,000
(a) (b)
3.2 Comparison of time integrated sampling and direct reading sampling method
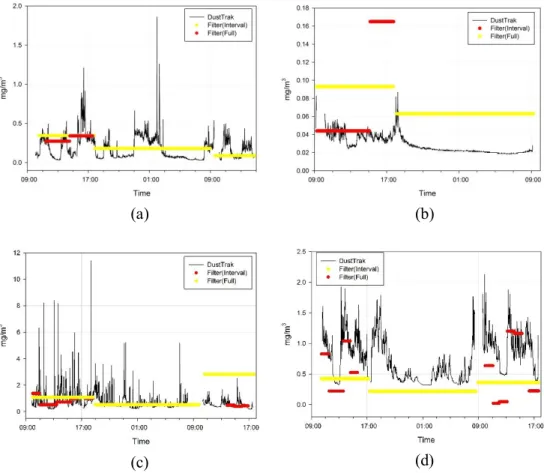
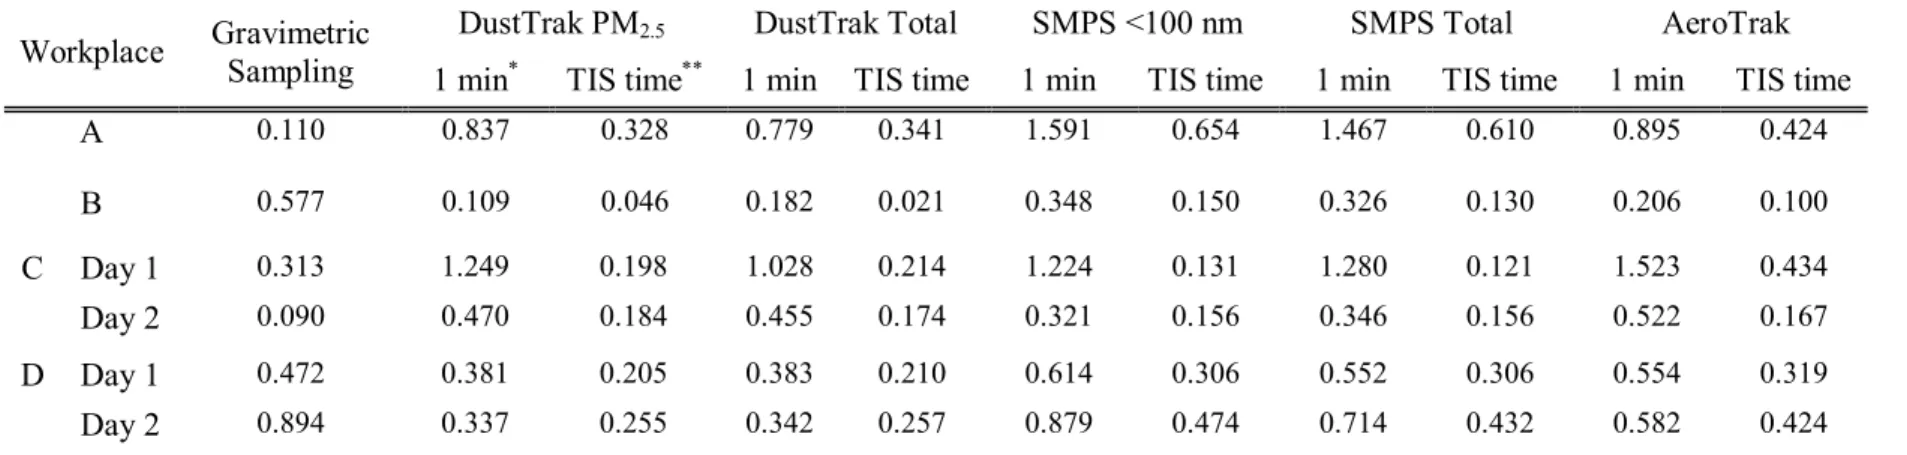
Figure 5 shows the results of gravimetric sampling and direct-reading sampling with the DustTrak for the entire sampling period. Table 4 shows coefficient of variation (CV) using the results of the time-interval gravimetric sampling and the DustTrak sampling measurements from one day.
Time interval sampling (TIS) was measured only two samples for one day in workplace A and B, and for two days in workplace C and D. “1 min” and “TIS time”
are collected by direct reading sample. The reason for classifying direct-reading instrument data in two ways was to compare variation between 1 min and TIS time intervals.
First, gravimetric sampling data was compared to 1 min interval direct-reading data. As shown in Figure 5, CV of gravimetric sampling is observed to lower value compared with 1 min interval data, and the CV of gravimetric sampling compared with 1 min interval in workplace B is higher. CV values of 1 min and TIS time measured by direct reading instrument in workplace A are higher than that of gravimetric sampling. All of direct reading instrument data on the first day in workplace C shows the highest variation compared with the others workplaces because workplace C shows the highest variation on first day measured at melting furnace working for 24 hours (> 1.0). CV of gravimetric sampling is higher than that of “1 min” and “TIS time” measured by DustTrak on the first and second day
Secondly, as compares with “1 min” and “TIS time”, all of “1 min” data shows the higher variation than “TIS time”. There is a significantly difference of variation between 1.3 times (DustTrak PM2.5) in workplace D on second day and over 16 times (SMPS > 100 nm) in workplace C on first day.
(a) (b)
(c) (d)
Figure 5. Time-integrated sampling results and DustTrak direct-reading sampling results (a) workplace A, (b) workplace B, (c) workplace C, (d)
workplace D.
Table 4. Coefficient of variation (CV) based on the results from time-interval gravimetric sampling and DustTrak direct-reading sampling from one day
Workplace Gravimetric Sampling
DustTrak PM2.5 DustTrak Total SMPS <100 nm SMPS Total AeroTrak 1 min* TIS time** 1 min TIS time 1 min TIS time 1 min TIS time 1 min TIS time
A 0.110 0.837 0.328 0.779 0.341 1.591 0.654 1.467 0.610 0.895 0.424
B 0.577 0.109 0.046 0.182 0.021 0.348 0.150 0.326 0.130 0.206 0.100
C Day 1 0.313 1.249 0.198 1.028 0.214 1.224 0.131 1.280 0.121 1.523 0.434
Day 2 0.090 0.470 0.184 0.455 0.174 0.321 0.156 0.346 0.156 0.522 0.167
D Day 1 0.472 0.381 0.205 0.383 0.210 0.614 0.306 0.552 0.306 0.554 0.319
Day 2 0.894 0.337 0.255 0.342 0.257 0.879 0.474 0.714 0.432 0.582 0.424
* “1 min” (1 min for DustTrak) is collected by DustTrak data in the same time periods with gravimetric sample (DustTrak logging time is 1 min).
** “TIS time” (Time Interval Sample time for DustTrak; Table 4) is selected by DustTrak data that calculated by geometric mean respectively in the same time periods with gravimetric sample time. TIS sample numbers is the same with gravimetric those.
3.3 Comparison of full time and time interval sampling methods Comparison of the full shift and time- interval sampling methods
Sample volumes were calculated using equation 1, which is described in the methods section. The LOD of the balance used for measurements in this study was 6.9 µg, and the lowest concentration during the full shift was 0.093 mg/m3.
Therefore, the estimated minimum sampling volume was 223 L (the sampling flow rate was 2 L/min), and the minimum sampling time was 1 hour, 55 min.In this study measurements were sampled for a minimum 3 hours at workplaces A and B.
At workplaces C and D, the highest concentration during the full shift was 2.834 mg/m3, and the minimum sampling time was 4 min. At these workplaces, time- interval sampling time was appropriate.
Gravimetric sampling data were categorized as either full shift samples (11 samples), or time-interval samples (22 samples). The 33 samples of direct-reading instrument data, including gravimetric mass concentrations, AeroTrak surface concentrations, DustTrak PM2.5/TPM ratios, and SMPS nanoparticle/TPM ratios, were not normally distributed. Therefore, nonparametric methods were used to compare gravimetric sampling measurements and direct-reading instrument sampling measurements.
The Wilcoxon signed-rank test was used to compare gravimetric sampling
rank test indicated that there were no differences in PM2.5 and TPM concentrations obtained from gravimetric sampling and DustTrak sampling, but differences were detected between gravimetric and AeroTrak (p <0.001) surface concentrations, and between gravimetric and SMPS TPM concentrations (p <0.001).
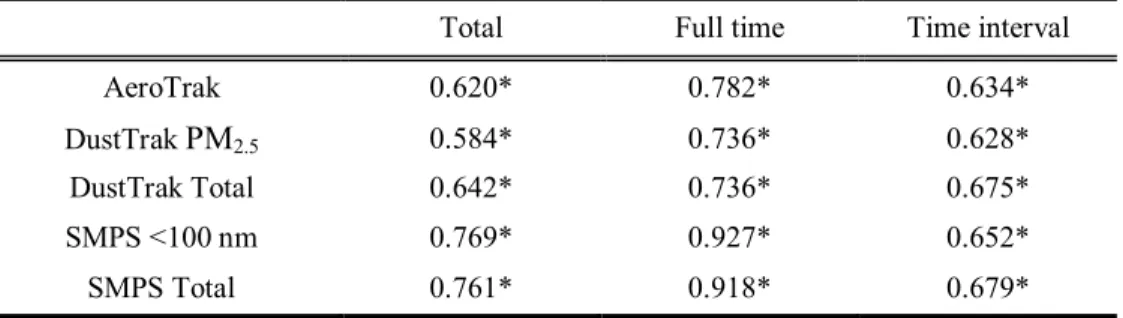
Spearman’s rank correlation was used to determine the strength of the association between gravimetric sampling concentrations, categorized as total gravimetric sampling data, full shift samples, and time-interval samples, and direct- reading instrument concentrations. Table 5 shows the Spearman’s rank correlation coefficient results. The Spearman’s rank correlation coefficients for all data were found to be statistically significant (p <0.01). The Spearman’s rank correlation coefficient for full shift gravimetric sampling concentrations and SMPS data was
>0.9, indicating a strong positive association between the two measurements.
Table 5. Spearmancorrelation coefficient result
Total Full time Time interval
AeroTrak 0.620* 0.782* 0.634*
DustTrak PM2.5 0.584* 0.736* 0.628*
DustTrak Total 0.642* 0.736* 0.675*
SMPS <100 nm 0.769* 0.927* 0.652*
SMPS Total 0.761* 0.918* 0.679*
* p <0.01
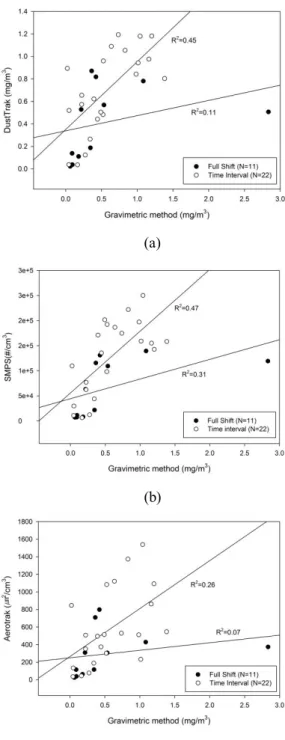
Linear regression analysis was used to determine the coefficient of determination between the full shift and time-interval gravimetric sampling methods. Figure 6 shows regression model graph, including the coefficients of determination. The time-interval samples had higher coefficients than the full shift samples for all metrics.
(a)
(b)
(c)
Figure 6. Regression analysis of full shift and time-interval gravimetric sampling data compared to direct-reading sampling data (a) Gravimetric data compared to DustTrak data, (b) Gravimetric data compared to SMPS data, (c) Gravimetric data
compared to AeroTrak data.
4 Discussions
In this study, time-integrated sampling (gravimetric sampling) and direct-reading sampling methods were compared at nanoparticle generating workplaces.
Sampling at engineered nanoparticle manufacturing workplaces was conducted at the bagging process because the processes for producing nanoparticles were conducted at contained facilities. Although the PM2.5/TPM ratios (0.4 - 0.7) at these workplaces were lower than that at other workplaces, the nanoparticle (i.e., UFP) ratios were not low. These results suggest that particles were already aggregated at the bagging process. The TEM images showed that nanoparticles were aggregated, and nanoparticles have a natural tendency to agglomerate. In workplace B, one of the two engineered nanoparticle manufacturing workplaces, the PM2.5/TPM ratio was >0.7. This is possibly because the sampling point was located in front of a contained facility, and the door was open for bagging after nanopowder production was complete. A study by Tsai et al. (2011) suggested that when conducting exposure assessments at nanopowder-related workplaces, the mass distributions of both submicron (<1 µm) particles and respirable particles should be considered.
Particle concentrations measured at the welding workplaces (workplaces C and
that the number of nanoparticles was not higher than at other processes. Therefore, this suggests that PM2.5 sampling at the welding process is appropriate for sampling the greatest concentration of generated particles. The size distributions measured by SMPS exhibited bimodal distributions at the unintended nanoparticle emitting workplaces. In most studies bimodal distributions were reported at the welding process; a bimodal distribution can be caused by the coalescence of nuclei (Vishnyakov et al., 2013). In addition, the size distributions differed between workplaces C and D. Particle sizes may have been affected by different welding methods and materials (Elihn and Berg, 2009).
The metal contents at the unintended nanoparticle emitting workplaces were higher than those at the engineered nanoparticle manufacturing workplaces. Metal contents had lower concentrations compared to the total mass concentrations. In a study conducted by Yoon et al. (2009), metal contents, including Na and K, were analyzed, however we did not include Na and K in this study. Different welding materials can affect the chemical components and concentrations of particles (Yoon et al., 2009).
In addition to processes that occur at the workplace, nanoparticles may also be generated by diesel engines (Vincent et al., 2000). Diesel-fueled forklifts were used in some workplaces for carrying products, and these machines can have a great effect on measurements. It is important to identify nanoparticle emission sources in the workplace. Therefore, Ham et al. (2012) suggest that researchers record
activities in TAD.
Other studies that have compared gravimetric and DustTrak PM2.5 measurements have shown that the two metrics are well correlated, and that DustTrak
concentrations were overestimated by a factor of 2 or more when compared to gravimetric PM2.5 concentrations (Kim et al., 2004; Zhu et al., 2011). However, total dust (i.e., TPM) was measured in this study. There were a variety of differences between DustTrak concentrations and gravimetric sampling
concentrations. It is estimated that the particle size range of the DustTrak is 1–15 µm, but the size range of the gravimetric sampling method is unlimited.
It was difficult to collect sufficient particles when using time-interval sampling methods. Other studies have reported that short-term gravimetric sampling is difficult, and that the amount particulates in the short term would likely be below the LOD for gravimetric sampling (Kim et al., 2004). The minimum sampling time in low-concentration workplaces was over 2 hours in this study. Therefore, to collect enough mass using gravimetric sampling methods, long-term sampling is generally recommended.
When comparing the time-integrated sampling method and direct-reading instrument sampling methods, the major advantage of direct-reading sampling was the ability to identify concentration variations. Concentration variation cannot be
CV of 1 min interval in direct reading instruments was higher than CV of TIS interval in those. This result shows that, unlike gravimetric sampling methods, direct-reading instrument methods are able to identify concentration variations.
Statistical results showed no differences between DustTtrak and gravimetric concentrations. All Spearman’s rank test results indicated strong associations between gravimetric sampling and direct-reading sampling. But there are not significantly characteristics between Spearman’s rank test and linear regression result. This result is considered small sample size.
Table 6 describes the characteristics of online and offline monitoring according to workplace type. This study had several limitations. First, the workplaces we examined were not representative of all workplaces. Although various processes such as grinding, smelting, welding, and laser cutting can take place at unintended nanoparticle emitting workplaces, the processes we examined were primarily welding processes. Second, we were unable to perform a statistical comparison between the two types of nanoparticle generating workplaces because the
engineered nanoparticle manufacturing workplaces had a small sample size. Third, particle concentrations in the workplace can be affected by season, ventilation, and working process. However, in this study we did not consider all of these factors.
Table 6. Characteristics of online and offline monitoring results according to workplace type
Engineered nanoparticle manufacturing workplace Unintended nanoparticle emitting workplace Online
monitoring
As particles of various sizes are generated, direct-reading instruments such as SMPS, AeroTrak, or DustTrak are required to determine the particle size distribution
To determine peak concentrations, sampling should be conducted at the welding process
Offline monitoring
As time-interval sampling is not suitable at workplaces with low particle concentrations, full shift gravimetric sampling is recommend for identifying mass concentrations
As most particles generated during the welding process are <2.5 µm, gravimetric sampling should be conducted
5 Conclusions
In this study, concentrations measured at unintended nanoparticle emitting workplaces were higher than those at engineered nanoparticle manufacturing workplaces, and nanoparticle number concentrations were also high. PM2.5 concentrations made up >90% of the total mass concentrations measured at welding workplaces, and most particles were <2.5 μm. Therefore, gravimetric methods should be used for sampling mass concentrations. However, mass concentrations measured at engineered nanoparticle manufacturing workplaces were relatively low, but the nanoparticle generation ratios were high. Therefore, both direct-reading instrument methods and gravimetric sampling methods should be used together at engineered nanoparticle manufacturing workplaces.
There are many limitations in assessing short-term exposure and identifying variations in concentration. Although direct-reading instruments have limited accuracy and reliability, these instruments may be necessary to identify variations in concentration. Therefore, when conducting exposure assessments of workplaces we suggest the use of both direct-reading instrument sampling methods and gravimetric sampling methods together.
6 References
Brouwer, D. (2010). Exposure to manufactured nanoparticles in different workplaces. Toxicology. 269: 120-127.
Brouwer, D., Berges, M., Virji, M. A., Fransman, W., Bello, D., Hodson, L., Gabriel, S. and Tielemans, E. (2012). Harmonization of measurement strategies for exposure to manufactured nano-objects; report of a workshop. Ann Occup. Hyg. 56:
1-9.
Brouwer, D. H., Gijsbers, J. H. J. and Lurvink, M. W. M. (2004). Personal exposure to ultrafine particles in the workplace: exploring sampling techniques and strategies.
Ann. Occup. Hyg. 48: 439-453.
Conti, J. A., Killpack, K., Gerritzen, G., Huang, L., Mircheva, M., Delmas, M., Harthorn, B. H., Appelbaum, R. P. and Holden, P. A. (2008). Health and Safety Practices in the Nanomaterials Workplace: Results from an International Survey.
Environ. Sci. Technol. 42: 3155-3162
Elihn, K. and Berg, P. (2009). Ultrafine particle characteristics in seven industrial plants. Ann Occup. Hyg. 53: 475-484.
Heitbrink, W. A., Evans, D. E., Ku, B. K., Maynard, A. D., Slavin, T. J. and Peters, T. M. (2009). Relationships among particle number, surface area, and respirable mass concentrations in automotive engine manufacturing. J. Occup. Environ. Hyg.
6: 19-31.
Kim, J. Y., Magari, S. R., Herrick, R. F., Smith, T. J. and Christiani, D. C. (2004).
Comparison of fine particle measurements from a direct-reading instrument and a gravimetric sampling method. J. Occup. Environ. Hyg. 1: 707-715.
Maynard, A. D. and Zimmer, A. T. (2002). Evaluation of Grinding Aerosols in Terms of Alveolar Dose: the Significance of Using Mass, Surface Area and Number Metrics. Ann. occup. Hyg. 46: 315-319.
Morawska, L., He, C., Hitchins, J., Mengersen, K. and Gilbert, D. (2003).
Characteristics of particle number and mass concentrations in residential houses in Brisbane, Australia. Atmospheric Environment. 37: 4195-4203.
O'Shaughnessy, P. T. (2013). Occupational health risk to nanoparticulate exposure.
Environmental Science: Processes & Impacts. 15: 49-62.
Ostiguy, C., Roberge, B., Woods, C. and Soucy, B. (2010). Current Knowledge about Occupational Health and Safety Risks and Prevention Measures, Vol. 2, IRSST Press, Montreal
Paik, N.W., Park, D. W., Yoon, C. S. and Shin, Y. C. (2011). Workplace
Spurny, K. R. (1998). Methods of Aerosol Measurement before the 1960s. Aerosol Science and Technology. 29: 329-349.
Tsai, C. J., Huang, C. Y., Chen, S. C., Ho, C. E., Huang, C. H., Chen, C. W., Chang, C. P., Tsai, S. J. and Ellenbecker, M. J. (2011). Exposure assessment of nano-sized and respirable particles at different workplaces. Journal of Nanoparticle Research.
13: 4161-4172.
Vincent, J. H. and Clement, C. F. (2000). Ultrafine particles in workplace atmospheres. The Royal Society. 358: 2673-2682.
Vishnyakov, V. I., Kiro, S. A., Ennan, A. A. (2014). Bimodal size distribution of primary particles in the plasma of welding fume: Coalescence of nuclei. Journal of Aerosol Science. 67: 13-20.
Yoon, C. S., Paik, N. W., Kim, J. H. and Chae, H. B. (2009). Total and Soluble Metal Contents in Flux-Cored Arc Welding Fumes. Aerosol Science and Technology. 43: 511-521.
Zhu, Y., Smith, T. J., Davis, M. E., Levy, J. I., Herrick, R., Jiang, H. (2011).
Comparing gravimetric and real-time sampling of PM 2.5 concentrations inside
국문초록
작업장의 나노입자상 물질에 대한
시간누적 시료채취와 실시간 시료채취 방법 비교
김 선 주 서울대학교 보건대학원 환경보건학과 산업보건전공
지도교수 윤 충 식
연구배경: 나노입자는 다양한 분야의 사업장 및 공정에서 의도적, 비의 도적으로 발생한다. 기존의 입자상물질의 측정 방법은 중량법을 이용하 여 평가하였지만, 나노입자의 경우 독특한 특성 때문에 실시간 기기를 이용하여 수농도 혹은 표면적 농도로 평가한다. 따라서 기존의 측정방법 인 시간누적시료채취와 실시간기기를 이용한 시료채취방법을 비교한 연 구가 필요하다. 시간누적 측정법인 중량법은 작업시간동안 농도변이를 알 수 없으며, 단시간 측정이 어렵다. 따라서 본 연구의 목적은 나노입 자가 발생하는 사업장에서의 입자상 물질을 평가하는 전통적인 방법과 실시간기기를 비교하고, 일반적인 입자평가법인 시간가중평균치방법과 시간간격측정방법을 비교하여 작업장별 적절한 측정법을 제안하는 것이
연구방법: 측정은 실시간 기기인 SMPS, DustTrak, AeroTrak 및 필터를 사 용하였다. 필터는 실시간 기기와 동시에 측정하였으며, 시간별 비교를 위 하여 전체작업시간동안 측정 및 1시간 혹은 일정시간간격마다 교체하였 다. 채취 후 분석은 중량분석, 중금속 분석, 전자현미경 분석 및 시간별 로 측정한 데이터 비교를 위하여 통계분석을 실시하였다.
결과: 비의도적 나노입자발생 사업장이 의도적 나노입자발생 사업장에 비하여 전체적으로 많은 입자가 발생되었다. 농도의 변이는 시간간격을 짧게 측정할수록 커졌다. 시간별로 측정한 필터와 실시간 기기는 전체시 간을 측정한 데이터가 높은 상관관계를 보였다.
결론: 용접 사업장에는 PM2.5의 이하의 입자 비율이 높아 필터를 이용한 중량법으로 측정하여 관찰하고, 의도적 나노입자 발생사업장에서는 다양 한 입자크기 분포를 보이기 때문에 실시간기기와 함께 사용하는 것이 좋 다. 그러나 가장 좋은 방법은 각각의 장단점을 보완하기 위하여 시간누 적시료채취법과 실시간기기를 병행하여 측정하는 것을 제안한다.
주요어: 의도적 나노입자, 비의도적 나노입자, 실시간 기기, 시간누적 시료채취, 시료채취방법
학번: 2012-21841