Metabolic syndrome (MS) is the concurrence of multiple metabolic abnormalities associated with the development and progression of atherosclerosis.1MS is incre- asingly common, and represents a global public health problem.2,3Meta-analyses found that the MS increases the risk for cardiovascular disease and all-cause mortality.4-6Solymoss, et al.7found that MS was present in as many as 51% of patients with documented coronary artery disease (CAD).
However, it has been reported that MS is a marker of cardiovascular disease risk, but not above and beyond the risk associated with its individual compo- nents.8,9Therefore, the number of markers of MS may be more useful than MS per se to predict the severity of CAD, and it has been used instead of a binary
Impact of Metabolic Syndrome and Its Individual Components on the Presence and Severity
of Angiographic Coronary Artery Disease
Jong-Youn Kim, Hee-Sun Mun, Byoung Kwon Lee, Seong Bo Yoon,* Eui-Young Choi, Pil-Ki Min, Young-Won Yoon, Bum-Kee Hong, Se-Joong Rim, and Hyuck Moon Kwon
Cardiology Division, Department of Internal Medicine, Gangnam Severance Hospital, Yonsei University College of Medicine, Seoul, Korea.
Purpose:Metabolic syndrome (MS) has been reported as a potential risk factor of coronary artery disease (CAD). The aims of this study were to assess whether there was a relationship between MS score and CAD angiographic severity, and to assess the predictive value of individual components of MS for CAD.Materials and Methods:We retrospectively enrolled 632 patients who underwent coronary angiography for suspected CAD (394 men, 61.0 ± 10.6 years of age). MS was defined by the National Cholesterol Education Program criteria with the waist criterion modified into a body mass index (BMI) of more than 25 kg/m2. The MS score defined as the number of MS components. CAD was defined as > 50%
luminal diameter stenosis of at least one major epicardial coronary artery. CAD angiographic severity was evaluated with a Gensini scoring system. Results:Of the patients, 497 (78.6%) had CAD and 283 (44.8%) were diagnosed with MS. The MS score was significantly related to the Gensini score. High fasting blood glucose (FBG) was the only predictive factor for CAD. A cluster including high FBG, high blood pressure (BP), and low high-density lipoprotein cholesterol (HDL-C) showed the highest CAD risk. Conclusion:The MS score correlates with the angiographic severity of CAD. The predictive ability of MS for CAD was carried almost completely by high FBG, and individual traits with high BP and low HDL- C may act synergistically as risk factors for CAD.
Key Words: Metabolic syndrome, coronary artery disease, coronary angiography
Received: August 17, 2009 Revised: December 1, 2009 Accepted: December 14, 2009 Corresponding author: Dr. Pil-Ki Min, Cardiology Division, Department of Internal Medicine, Gangnam Severance Hospital, Yonsei University College of Medicine, 712 Eonju-ro, Gangnam-gu, Seoul 135-720, Korea.
Tel: 82-2-2019-3310, Fax: 82-2-3463-3882 E-mail: [email protected]
*Current affiliation (Yoon SB): Cardiovascular Center, Hongik Hospital, Seoul, Korea.
∙The authors have no financial conflicts of interest.
© Copyright:
Yonsei University College of Medicine 2010 This is an Open Access article distributed under the terms of the Creative Commons Attribution Non- Commercial License (http://creativecommons.org/
licenses/by-nc/3.0) which permits unrestricted non- commercial use, distribution, and reproduction in any medium, provided the original work is properly cited.
INTRODUCTION
definition of MS in several studies.10,11 Each abnormality promotes atherosclerosis independently, but when cluster- ed together, these metabolic disorders are increasingly atherogenic and enhance the risk of developing CAD and cardiovascular events.12-14
The objectives of our study were to assess the relation- ship between the MS score and the angiographic severity of CAD, and to assess the predictive value of the indivi- dual components of MS for CAD.
Subjects
From January 1, 2007 to December 31, 2007, we collected clinical, biochemical, and angiographic information from 632 consecutive patients who underwent elective coronary angiography at the Heart Center at Gangnam Severance Hospital, Yonsei University College of Medicine. Patients with recent myocardial infraction (MI), which could poten- tially affect blood glucose and lipid levels, were excluded from this study.
Definition of metabolic syndrome
The presence of MS was determined using the Third Adult Treatment Panel (ATP III) of the National Cholesterol Education Program (NCEP) criteria with the waist criter- ion modified into a body mass index (BMI) of more than 25 kg/m2.12,13,15The high blood pressure (BP) criterion was defined as > 130/85 mmHg or being already on antihyper- tensive medication. Impaired fasting glucose was defined by a fasting blood glucose (FBG) of ≥ 110 mg/dL or being already on oral hypoglycemic agents or insulin. Low high- density lipoprotein cholesterol (HDL-C) was defined as
< 40 mg/dL in men and < 50 mg/dL in women. Hypertri- glycemia was defined as fasting triglyceride (TG) ≥ 150 mg/dL. Those who had 3 or more of these 5 components were classified as having MS. Patients were divided into 6 groups according to the number of constituents (0 to 5) of MS- or MS score.
Biochemical tests
Venous sampling was collected in the early morning after an overnight fasting prior to elective coronary angiography using standard venipuncture technique. Insulin resistance was evaluated by the homeostatic model assessment (HO- MA) as described by Matthews, et al.16This is defined by the product of the fasting glucose and fasting insulin divided by a constant. Thus, the HOMA index = [{fasting insulin (U/mL)}×{fasting glucose (mmol/L)}] / 22.5. The low-density lipoprotein cholesterol (LDL-C) concentration was estimated by the formula by Friedewald, et al.17For
subjects with serum TG levels ≥ 400 mg/dL, LDL-C was directly measured by an enzymatic method (Cholestest®- LDL, Sekisui medical Co., Ltd., Tokyo, Japan).
Angiographic assessment
Coronary angiography was performed by the Judkins tech- nique through femoral artery access. The angiographic characteristics, which included lesion location and percen- tage stenosis, of all coronary lesions in the index coronary angiogram were obtained by thoroughly reviewing the angiogram. CAD was defined as > 50% luminal diameter stenosis of at least one major epicardial coronary artery.
The Gensini scoring system was used to calculate coronary disease severity.18This method defines narrowing of the lumen of the coronary arteries as 1 for 1-25% stenosis, 2 for 26-50% stenosis, 4 for 51-75% stenosis, 8 for 76-90%
stenosis, 16 for 91-99%, and 32 for total occlusion. The score is then multiplied by a factor that represents the im- portance of the lesion’s location in the coronary artery system. For the location scores, 5 points were given for the left main lesion; 2.5 for the proximal left anterior descend- ing (LAD) or left circumflex (LCX) artery; 1.5 for the mid segment LAD and LCX; 1 for the distal segment of LAD and LCX, first diagonal branch, first obtuse marginal bran- ch, right coronary artery, posterior descending artery, and intermediate artery; and 0.5 for the second diagonal and second obtuse marginal branches. The grades of luminal narrowing were determined according to the consensus opinion of two experienced interventional cardiologists.
Statistical analyses
Baseline demographic and laboratory data are presented as mean ± SD for continuous variables and frequencies for discrete variables. Comparisons among groups were cal- culated with an analysis of variance for continuous variables and Pearson’s chi-square test for discrete variables. Correla- tions between the MS score and Gensini score were exa- mined by linear regression analysis. The probability of CAD occurrence in relation to MS, its single traits, and their combinations were estimated as odds ratio (OR) [95%
confidence interval (CI)]. All data were analyzed using statistical software SPSS for windows version 13.0 (SPSS Inc., Chicago, IL, USA).
Baseline characteristics
A total of 632 patients (394 men, 61.0 ± 10.6 years of age) were enrolled in this study. Of the 632 patients studied, 497 (78.6%) had CAD and 283 (44.8%) were diagnosed with MS. The distribution of patients with 0 to 5 MS scores
MATERIALS AND METHODS
RESULTS
is listed in Table 1. In most groups, high BP was the most frequent abnormality, followed by low HDL-C, high BMI, high FBG, and high TG.
Demographic and biochemical characteristics of patients with and without MS are presented in Table 2. There were no significant differences in age, sex, height, or smoking between the two groups. Patients with MS had higher total cholesterol, TG, and LDL-C, and lower HDL-C. However, the difference in LDL-C was marginally significant. MS patients also had higher dysglycemia indexes. Particularly striking were the differences in serum insulin and HOMA indexes.
Coronary artery disease severity
Patients with and without MS did not differ in the preval- ence of CAD and diseased vessel numbers (Table 3). How- ever, patients with MS had severer CAD as assessed by the Gensini score compared to patients without MS (23.3 ± 29.2 vs. 15.5 ± 23.4, p = 0.002). Interestingly, although there were no significant differences in baseline charac- teristics such as age, sex, height, or smoking among the subgroups stratified by the MS score, an increasing MS score was significantly related to the severity of CAD on the coronary angiography. Fig. 1 demonstrates the relation- ship between the MS score and CAD severity as assessed Table 1. Relative Frequency of Various Markers of Metabolic Syndrome and Clinical Characteristics Accord- ing to the Metabolic Syndrome Score
MS score 0 (n = 38) 1 (n = 109) 2 (n = 202) 3 (n = 155) 4 (n = 99) 5 (n = 29)
High BMI* 0 (0%) 25 (23%) 82 (41%) 107 (69%) 80 (81%) 29 (100%)
High FBG� 0 (0%) 15 (14%) 62 (31%) 83 (54%) 77 (78%) 29 (100%)
High BP� 0 (0%) 38 (35%) 138 (68%) 125 (81%) 89 (90%) 29 (100%)
High TG§ 0 (0%) 4 (4%) 28 (16%) 49 (33%) 62 (63%) 29 (100%)
Low HDL-C‖ 0 (0%) 27 (25%) 94 (47%) 101 (65%) 88 (89%) 29 (100%)
Age (yrs) 61 ± 13 62 ± 10 61 ± 11 60 ± 10 62 ± 10 61 ± 11
Male 28 (74%) 69 (63%) 126 (62%) 93 (60%) 63 (64%) 15 (52%)
Smoking 17 (45%) 67 (62%) 114 (56%) 87 (56%) 46 (47%) 17 (59%)
MS, metabolic syndrome; BMI, body mass index; FBG, fasting blood glucose; BP, blood pressure; TG, triglyceride; HDL-C, high-density lipoprotein cholesterol.
* > 25 kg/m2.
�≥ 110 mg/dL.
�> 130/85 mmHg.
§≥ 150 mg/dL.
‖For men < 40 mg/dL; for women < 50 mg/dL.
Table 2. Clinical and Biochemical Characteristics of Patients with and without Metabolic Syndrome Without MS (n = 349) With MS (n = 283) p value
Age (yrs) 61.0 ± 10.8 61.0 ± 10.4 0.984
Male 223 (64%) 171 (60%) 0.371
Height (cm) 162.9 ± 8.4 162.7 ± 8.9 0.799
Weight (kg) 64.0 ± 9.9 70.3 ± 10.2 < 0.001
BMI (kg/m2) 24.2 ± 2.8 26.5 ± 2.6 < 0.001
Smoking 151 (43%) 131 (47%) 0.401
Hypertension 176 (50%) 243 (86%) < 0.001
Diabetes 45 (13%) 139 (49%) < 0.001
Cholesterol (mg/dL) 152.9 ± 32.5 160.0 ± 35.9 0.006
TG (mg/dL) 101.4 ± 42.5 166.8 ± 49.9 < 0.001
HDL-C (mg/dL) 47.1 ± 14.5 39.0 ± 8.1 < 0.001
LDL-C (mg/dL) 92.8 ± 28.2 97.6 ± 32.8 0.046
Lipoprotein (a) (mg/dL) 24.3 ± 28.4 21.0 ± 29.3 0.146
FBG (mg/dL) 98.7 ± 19.7 115.8 ± 37.0 < 0.001
Serum insulin (µIU/mL) 7.8 ± 7.8 12.5 ± 15.2 < 0.001
HOMA index 2.0 ± 2.4 3.6 ± 4.7 < 0.001
MS, metabolic syndrome; BMI, body mass index; TG, triglyceride; HDL-C, high-density lipoprotein cholesterol; LDL-C, low-density lipoprotein cholesterol; FBG, fasting blood glucose; HOMA, homeostatic model assessment.
by the Gensini score system.
Predictive ability for CAD of MS and its components The unadjusted and adjusted predictive abilities for angio- graphic CAD of MS and its individual components are shown in Fig. 2. Although a diagnosis of MS was associated with the CAD severity assessed by the Gensini score, MS per se did not predict the presence of CAD. Individually, high FBG was the only predictive factor for CAD in uni-
variate analysis OR 2.070, 95% CI 1.371-3.124, p = 0.001).
Adjustment for other demographic features, LDL-C, and individual MS constituents did not diminish this association (OR 1.973, 95% CI 1.297-3.000, p = 0.002). Low HDL-C, high BMI, high BP, and high TG were not predictive of CAD in univariate and multivariate analyses.
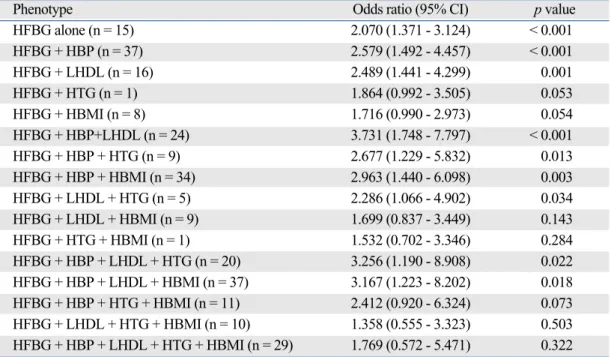
The OR for CAD risk of different phenotypes in high FBG are presented in Table 4. High BP as a companion increased the OR significantly to 2.579. The other single trait of significance was low HDL-C. Among the triads the cluster with high BP and low HDL-C was the highest risk (OR 3.731). Among the quartets, only combinations includ- ing high BP and low HDL-C were associated with increas- ed risk (OR 3.256 and 3.167). The OR for the quintet was not significantly increased (OR 1.769, 95% CI 0.572-5.471, p = 0.322). High FBG, high BP, and low HDL-C are signi- ficant contributors to CAD risk.
In this study, patients with and without MS did not differ in the prevalence of CAD and diseased vessel numbers, but patients with MS had severer CAD as assessed by the
DISCUSSION
Table 3. Angiographic Characteristics of Patients with and without Metabolic Syndrome
Without MS (n = 349) With MS (n = 283) p value
CAD 302 (87%) 247 (87%) 0.782
Normal or minimal 47 (14%) 36 (13%) 0.224
1 vessel disease 98 (28%) 72 (25%)
2 vessel disease 149 (43%) 112 (40%)
3 vessel disease 55 (16%) 63 (22%)
Gensini score 15.5 ± 23.4 23.3 ± 29.2 0.002
MS, metabolic syndrome; CAD, coronary artery disease.
Fig. 1. The relationship between the metabolic syndrome score and coronary artery disease severity assessed by the Gensini score.
Fig. 2. Odds ratio plots for metabolic syndrome and its components as a predictor of the presence of angiographic coronary artery disease. MS, metabolic syndrome; FBG, fasting blood glucose; BP, blood pressure; HDL-C, high-density lipoprotein cholesterol; TG, triglyceride; BP, blood pressure; BMI, body mass index; UV, univariate analysis; MV, multivariate analysis.
Gensini score compared to patients without MS.
One key conceptual advance made with the introduction of MS as a clinically measurable entity was the recognition of abdominal obesity as its most prevalent form.12,19MS is determined by the presence of 3 or more of quantitatively identified markers. From the clinical perspective, it has been questioned whether MS improves cardiovascular risk prediction, beyond previously used tools for coronary heart disease.20-24Some studies have assessed whether metabolic syndrome predicts the risk of cardiovascular diseases or a surrogate such as subclinical atherosclerosis.25,26In the majority of these studies the outcome with which the meta- bolic syndrome was to be related was atherosclerotic vas- cular disease, either coronary heart disease alone or stroke.
However, in some studies, MS and its components are asso- ciated with type 2 DM but have weak or no association with vascular risk, suggesting that attempts to define a criteria that simultaneously predict risk for both cardiova- scular disease and DM are unhelpful.23,27,28
The fact that the 5 variables are used as “present” or
“absent” likely makes these screening tools less than per- fect for the optimal diagnosis of the MS. Furthermore, there is a mosaic of combinations of 3 of the 5 criteria which makes it very unlikely that all these subgroups are similar entities from a pathophysiological standpoint and clinical prognosis.29 The central issue from an epidemiological perspective is whether MS predicts cardiovascular disease more than its individual components. It has been reported that MS is a marker for cardiovascular disease risk, but not above and beyond the risk associated with its individual
components.8,9Therefore, the number of markers of MS may be more useful than MS per se to predict the severity of CAD.10The results of our study showed that the increased MS score was significantly related to the angiographic severity of CAD. The statistical association with an increas- ing number of MS features can be explained by the increas- ing impact of multiple risk factors.
We also evaluated the ability of MS and its individual components to predict angiographic CAD. Type 2 DM has long been recognized as a significant risk factor for CAD and has been acknowledged as a CAD equivalent.13In the present study, increased FBG was the only significant pre- dictor of CAD although high BP, decreased HDL-C, and increased BMI were the three most frequently observed characteristics.
However, it has been demonstrated that the presence of MS increased the risk of cardiovascular events ten-fold even in patients with DM.30 Therefore, the increased risk appears to be related to risk factor clustering associated with MS.31,32Individual components may interact synergi- stically in accelerating the progression of atherosclerosis.
Analysis of the 11 possible combinations of individual MS components reveals a striking heterogeneity in their ORs as CAD risk factors. As shown in Table 4, the ORs of these 11 phenotypes vary in a wide range from 1.358 to 3.731, depending upon individual components. MS clusters includ- ing high FBG, high BP, and low HDL-C are clearly asso- ciated with the highest CAD risk. Our investigation demon- strates that CAD risk strongly depends on the individual components.
Table 4. Odds Ratios for Coronary Artery Disease of Different Phenotypes in High Fasting Blood Glucose
Phenotype Odds ratio (95% CI) p value
HFBG alone (n = 15) 2.070 (1.371 - 3.124) < 0.001
HFBG + HBP (n = 37) 2.579 (1.492 - 4.457) < 0.001
HFBG + LHDL (n = 16) 2.489 (1.441 - 4.299) 0.001
HFBG + HTG (n = 1) 1.864 (0.992 - 3.505) 0.053
HFBG + HBMI (n = 8) 1.716 (0.990 - 2.973) 0.054
HFBG + HBP+LHDL (n = 24) 3.731 (1.748 - 7.797) < 0.001
HFBG + HBP + HTG (n = 9) 2.677 (1.229 - 5.832) 0.013
HFBG + HBP + HBMI (n = 34) 2.963 (1.440 - 6.098) 0.003
HFBG + LHDL + HTG (n = 5) 2.286 (1.066 - 4.902) 0.034
HFBG + LHDL + HBMI (n = 9) 1.699 (0.837 - 3.449) 0.143
HFBG + HTG + HBMI (n = 1) 1.532 (0.702 - 3.346) 0.284
HFBG + HBP + LHDL + HTG (n = 20) 3.256 (1.190 - 8.908) 0.022
HFBG + HBP + LHDL + HBMI (n = 37) 3.167 (1.223 - 8.202) 0.018
HFBG + HBP + HTG + HBMI (n = 11) 2.412 (0.920 - 6.324) 0.073
HFBG + LHDL + HTG + HBMI (n = 10) 1.358 (0.555 - 3.323) 0.503 HFBG + HBP + LHDL + HTG + HBMI (n = 29) 1.769 (0.572 - 5.471) 0.322 HFBG, high fasting blood glucose; HBP, high blood pressure; LHDL, low high-density lipoprotein cholesterol; HTG, high triglyceride;
HBMI, high body mass index.
The present study shares the limitations with other non- randomized, retrospective studies, including the possible presence of selection bias and uncorrected confounding. In the subgroup analysis in the patients without DM, high FBG did not show any significance in the prediction of CAD. The subjects in our study were patients who were admitted for clinically suspected CAD, and about 30% of the subjects had DM. Therefore, selection bias and a high prevalence of DM may affect the results.
The presence of abdominal obesity is more highly cor- related with metabolic risk factors than is BMI. Thus, the simple measurement of waist circumference, with sex speci- fic thresholds, was recommended by ATP III to identify the body weight component of MS.12,13However, because waist circumference was not available, we used a BMI of about 25 kg/m2, which was applied as a surrogate in a previous report on the prevalence of obesity and MS in Korean adults.33
In conclusion, the MS score correlates with the angio- graphic severity of CAD. The predictive ability of MS for CAD was carried almost entirely by high FBG, and indivi- dual traits with high BP and low HDL-C seemed to act synergistically as risk factors for CAD.
This study was supported by the Brain Korea 21 Project for Medical Science, Yonsei University and Korean Institute of Medicine.
1. Reaven GM. Banting lecture 1988. Role of insulin resistance in human disease. Diabetes 1988;37:1595-607.
2. James PT, Rigby N, Leach R; International Obesity Task Force.
The obesity epidemic, metabolic syndrome and future prevention strategies. Eur J Cardiovasc Prev Rehabil 2004;11:3-8.
3. Jørgensen ME, Borch-Johnsen K. The metabolic syndrome--is one global definition possible? Diabet Med 2004;21:1064-5.
4. Ford ES. Risks for all-cause mortality, cardiovascular disease, and diabetes associated with the metabolic syndrome: a summary of the evidence. Diabetes Care 2005;28:1769-78.
5. Galassi A, Reynolds K, He J. Metabolic syndrome and risk of car- diovascular disease: a meta-analysis. Am J Med 2006;119:812-9.
6. Gami AS, Witt BJ, Howard DE, Erwin PJ, Gami LA, Somers VK, et al. Metabolic syndrome and risk of incident cardiovas- cular events and death: a systematic review and meta-analysis of longitudinal studies. J Am Coll Cardiol 2007;49:403-14.
7. Solymoss BC, Bourassa MG, Lespérance J, Levesque S, Marcil M, Varga S, et al. Incidence and clinical characteristics of the metabolic syndrome in patients with coronary artery disease. Coron Artery Dis 2003;14:207-12.
8. Iribarren C. The metabolic syndrome is no better than its compo-
nents. Minerva Cardioangiol 2007;55:487-9.
9. Wang J, Ruotsalainen S, Moilanen L, Lepistö P, Laakso M, Kuu- sisto J. The metabolic syndrome predicts cardiovascular mortality:
a 13-year follow-up study in elderly non-diabetic Finns. Eur Heart J 2007;28:857-64.
10. Solymoss BC, Bourassa MG, Campeau L, Sniderman A, Marcil M, Lespérance J, et al. Effect of increasing metabolic syndrome score on atherosclerotic risk profile and coronary artery disease angiographic severity. Am J Cardiol 2004;93:159-64.
11. Azevedo A, Bettencourt P, Almeida PB, Santos AC, Abreu-Lima C, Hense HW, et al. Increasing number of components of the metabolic syndrome and cardiac structural and functional abnor- malities--cross-sectional study of the general population. BMC Cardiovasc Disord 2007;7:17.
12. Expert Panel on Detection, Evaluation, and Treatment of High Blood Cholesterol in Adults. Executive Summary of The Third Report of The National Cholesterol Education Program (NCEP) Expert Panel on Detection, Evaluation, And Treatment of High Blood Cholesterol In Adults (Adult Treatment Panel III). JAMA 2001;285:2486-97.
13. National Cholesterol Education Program (NCEP) Expert Panel on Detection, Evaluation, and Treatment of High Blood Chole- sterol in Adults (Adult Treatment Panel III). Third Report of the National Cholesterol Education Program (NCEP) Expert Panel on Detection, Evaluation, and Treatment of High Blood Chole- sterol in Adults (Adult Treatment Panel III) final report. Circula- tion 2002;106:3143-421.
14. Grundy SM. Hypertriglyceridemia, atherogenic dyslipidemia, and the metabolic syndrome. Am J Cardiol 1998;81:18B-25B.
15. Genuth S, Alberti KG, Bennett P, Buse J, Defronzo R, Kahn R, et al. Follow-up report on the diagnosis of diabetes mellitus. Diabetes Care 2003;26:3160-7.
16. Matthews DR, Hosker JP, Rudenski AS, Naylor BA, Treacher DF, Turner RC. Homeostasis model assessment: insulin resis- tance and beta-cell function from fasting plasma glucose and insulin concentrations in man. Diabetologia 1985;28:412-9.
17. Friedewald WT, Levy RI, Fredrickson DS. Estimation of the concentration of low-density lipoprotein cholesterol in plasma, without use of the preparative ultracentrifuge. Clin Chem 1972;
18:499-502.
18. Gensini GG. A more meaningful scoring system for determining the severity of coronary heart disease. Am J Cardiol 1983;51:606.
19. Grundy SM, Cleeman JI, Daniels SR, Donato KA, Eckel RH, Franklin BA, et al. Diagnosis and management of the metabolic syndrome: an American Heart Association/National Heart, Lung, and Blood Institute Scientific Statement. Circulation 2005;112:
2735-52.
20. Kahn R, Buse J, Ferrannini E, Stern M; American Diabetes Association; European Association for the Study of Diabetes.
The metabolic syndrome: time for a critical appraisal: joint state- ment from the American Diabetes Association and the European Association for the Study of Diabetes. Diabetes Care 2005;28:
2289-304.
21. Clemenz M, Kintscher U, Unger T. The metabolic syndrome:
cluster with a self-fulfilling loop? J Hypertens 2006;24:257-8.
22. Greenland P. Critical questions about the metabolic syndrome.
Circulation 2005;112:3675-6.
23. Stern MP, Williams K, González-Villalpando C, Hunt KJ, Haf- fner SM. Does the metabolic syndrome improve identification of individuals at risk of type 2 diabetes and/or cardiovascular disease?
ACKNOWLEDGEMENTS
REFERENCES
Diabetes Care 2004;27:2676-81.
24. McNeill AM, Rosamond WD, Girman CJ, Golden SH, Schmidt MI, East HE, et al. The metabolic syndrome and 11-year risk of incident cardiovascular disease in the atherosclerosis risk in com- munities study. Diabetes Care 2005;28:385-90.
25. Golden SH, Folsom AR, Coresh J, Sharrett AR, Szklo M, Brancati F. Risk factor groupings related to insulin resistance and their synergistic effects on subclinical atherosclerosis: the atheros- clerosis risk in communities study. Diabetes 2002;51:3069-76.
26. Hassinen M, Komulainen P, Lakka TA, Väisänen SB, Haapala I, Gylling H, et al. Metabolic syndrome and the progression of carotid intima-media thickness in elderly women. Arch Intern Med 2006;166:444-9.
27. Wannamethee SG, Shaper AG, Lennon L, Morris RW. Meta- bolic syndrome vs Framingham Risk Score for prediction of coronary heart disease, stroke, and type 2 diabetes mellitus. Arch Intern Med 2005;165:2644-50.
28. Sattar N, McConnachie A, Shaper AG, Blauw GJ, Buckley BM, de Craen AJ, et al. Can metabolic syndrome usefully predict car- diovascular disease and diabetes? Outcome data from two pros-
pective studies. Lancet 2008;371:1927-35.
29. Marquis K, Maltais F, Duguay V, Bezeau AM, LeBlanc P, Jobin J, et al. The metabolic syndrome in patients with chronic obstruc- tive pulmonary disease. J Cardiopulm Rehabil 2005;25:226-32.
30. Bonora E, Targher G, Formentini G, Calcaterra F, Lombardi S, Marini F, et al. The Metabolic Syndrome is an independent pre- dictor of cardiovascular disease in Type 2 diabetic subjects. Pro- spective data from the Verona Diabetes Complications Study.
Diabet Med 2004;21:52-8.
31. Meigs JB, Wilson PW, Fox CS, Vasan RS, Nathan DM, Sullivan LM, et al. Body mass index, metabolic syndrome, and risk of type 2 diabetes or cardiovascular disease. J Clin Endocrinol Metab 2006;91:2906-12.
32. McLaughlin T, Abbasi F, Lamendola C, Reaven G. Heterogeneity in the prevalence of risk factors for cardiovascular disease and type 2 diabetes mellitus in obese individuals: effect of differences in insulin sensitivity. Arch Intern Med 2007;167:642-8.
33. Park HS, Park CY, Oh SW, Yoo HJ. Prevalence of obesity and metabolic syndrome in Korean adults. Obes Rev 2008;9:104-7.