Triiodothyronine Levels Are Independently Associated with Metabolic Syndrome in Euthyroid Middle-Aged Subjects
Hye Jeong Kim1,*, Ji Cheol Bae2,*, Hyeong Kyu Park1, Dong Won Byun1, Kyoil Suh1, Myung Hi Yoo1, Jae Hyeon Kim3, Yong-Ki Min3, Sun Wook Kim3, Jae Hoon Chung3
1Division of Endocrinology and Metabolism, Department of Internal Medicine, Soonchunhyang University Seoul Hospital, Soonchunhyang University College of Medicine, Seoul; 2Division of Endocrinology and Metabolism, Department of Medicine, Samsung Changwon Hospital, Sungkyunkwan University School of Medicine, Changwon; 3Division of Endocrinology and Metabolism, Department of Medicine, Thyroid Center, Samsung Medical Center, Sungkyunkwan University School of Medicine, Seoul, Korea
Background: Recent studies have shown an association between thyroid hormone levels and metabolic syndrome (MetS) among euthyroid individuals; however, there have been some inconsistencies between studies. Here, we evaluated the relationship be- tween thyroid hormone levels and MetS in euthyroid middle-aged subjects in a large cohort.
Methods: A retrospective analysis of 13,496 euthyroid middle-aged subjects who participated in comprehensive health examina- tions was performed. Subjects were grouped according to thyroid stimulating hormone, total triiodothyronine (T3), total thyrox- ine (T4), and T3-to-T4 ratio quartile categories. We estimated the odds ratios (ORs) for MetS according to thyroid hormone quar- tiles using logistic regression models, adjusted for potential confounders.
Results: Of the study patients, 12% (n=1,664) had MetS. A higher T3 level and T3-to-T4 ratio were associated with unfavour- able metabolic profiles, such as higher body mass index, systolic and diastolic blood pressure, triglycerides, fasting glucose and glycated hemoglobin, and lower high density lipoprotein cholesterol levels. The proportion of participants with MetS increased across the T3 quartile categories (P for trend <0.001) and the T3-to-T4 ratio quartile categories (P for trend <0.001). The multi- variate-adjusted OR (95% confidence interval) for MetS in the highest T3 quartile group was 1.249 (1.020 to 1.529) compared to the lowest T3 quartile group, and that in the highest T3-to-T4 ratio quartile group was 1.458 (1.141 to 1.863) compared to the lowest T3-to-T4 ratio quartile group, even after adjustment for potential confounders.
Conclusion: Serum T3 levels and T3-to-T4 ratio are independently associated with MetS in euthyroid middle-aged subjects.
Longitudinal studies are needed to define this association and its potential health implications.
Keywords: Thyroid hormones; Triiodothyronine; Metabolic syndrome
Received: 19 February 2016, Revised: 3 April 2016, Accepted: 12 April 2016
Corresponding author: Jae Hoon Chung
Division of Endocrinology and Metabolism, Department of Medicine, Thyroid Center, Samsung Medical Center, Sungkyunkwan University School of Medicine, 81 Irwon-ro, Gangnam-gu, Seoul 06351, Korea
Tel: +82-2-3410-3434, Fax: +82-2-3410-3849, E-mail: [email protected]
*These authors contributed equally to this work.
Copyright © 2016 Korean Endocrine Society
This is an Open Access article distributed under the terms of the Creative Com- mons Attribution Non-Commercial License (http://creativecommons.org/
licenses/by-nc/4.0/) which permits unrestricted non-commercial use, distribu- tion, and reproduction in any medium, provided the original work is properly cited.
INTRODUCTION
Thyroid dysfunction and metabolic syndrome (MetS) are both associated with an increased risk of cardiovascular morbidity and mortality [1-4]. Studies have reported the relationship be- tween overt and subclinical thyroid dysfunction and compo- nents of MetS [5-7]. Recently, there has been growing interest in the potential impact of differences in thyroid function within the reference range on MetS and its components.
Many studies have reported an association between thyroid hormones within the reference range and components of MetS [8-24]. Serum thyroid stimulating hormone (TSH) within the reference range has been positively related to the prevalence of obesity [18,19], high blood pressure (BP) [12], and unfavour- able lipid profiles [13,17,24]. Low normal free thyroxine (fT4) levels have been correlated to components of MetS, such as unfavorable body composition [9,14,15,22,24], high BP [9,14], unfavourable lipid profiles [9,14,16,22], and insulin resistance [16,24]. High normal total triiodothyronine (T3) or free triiodo- thyronine (fT3) levels have been positively associated with un- favourable body composition [10,15,21-23,25], high BP [8,22], and insulin resistance [11,21,26].
However, few studies have evaluated the association be- tween thyroid hormones within the reference range and MetS, and the association remains under debate. Some studies found an association between high normal TSH levels and MetS [18,20], while others did not [24]. One recent study reported an association between low normal fT4 levels and MetS [24], while another study identified no such association [14]. To date, no studies have investigated the association between T3
levels within the reference range and MetS.
The aim of the present study was to investigate the associa- tion of thyroid hormones with MetS and its components in eu- thyroid middle-aged subjects in a large cohort.
METHODS
Study population
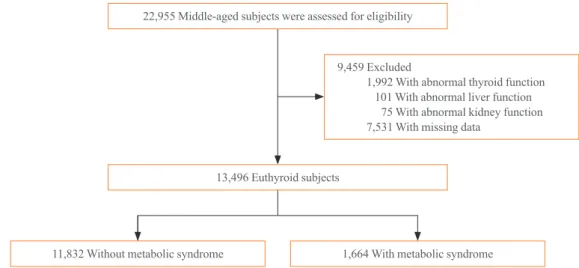
Middle-aged subjects between 35 and 65 years who participat- ed in comprehensive health check-ups at the Health Promotion Center of Samsung Medical Center more than four times dur- ing a 6-year period (between January 2006 and December 2012; n=22,955) served as the source for the initial data (Fig.
1). Among these subjects, 9,459 were excluded for the follow- ing reasons, all of which were based on the 2006 records: ab- normal thyroid function (TSH, T3, and/or T4 below or above the normal reference range; n=1,992), abnormal liver function (aspartate aminotransferase and/or alanine aminotransferase ≥ 2.5 above the upper limit of normal; n=101), abnormal kidney function (serum creatinine >1.3 mg/dL; n=75), and/or absence of data (questionnaire, anthropometric measurements, glycated hemoglobin [HbA1c], insulin, TSH, T3, and/or T4; n=7,531).
Several subjects met more than two exclusion criteria. After exclusion of ineligible participants, 13,496 subjects were deemed eligible and therefore included in this study. All data containing anthropometric data, laboratory tests, results of ra- diologic images, and coded answers to self-reported question- naires were stored in an electronic medical record. The require- ment for informed consent for this study was waived by the In- stitutional Review Board of because researchers only accessed
22,955 Middle-aged subjects were assessed for eligibility
13,496 Euthyroid subjects
11,832 Without metabolic syndrome 1,664 With metabolic syndrome 9,459 Excluded
1,992 With abnormal thyroid function 101 With abnormal liver function 75 With abnormal kidney function 7,531 With missing data
Fig. 1. Flow chart of the study population.
the database for analysis purposes and because personal identi- fying information was not accessed. The study protocol was approved by the Institutional Review Board of Samsung Medi- cal Center.
Definitions of euthyroidism
Euthyroidism was defined as serum TSH (reference range, 0.4 to 5.0 mU/L), T3 (reference range, 1.10 to 2.90 nmol/L), and T4 (reference range, 64.0 to 155.0 nmol/L) levels within the nor- mal reference ranges.
Definitions of metabolic syndrome
Using a Joint Interim Statement by the International Diabetes Federation and the American Heart Association/National Heart, Lung, and Blood Institute criteria [27] and World Health Orga- nization body mass index (BMI) cut-off point for overweight [28], MetS was defined as three or more of the following: (1) fasting glucose ≥100 mg/dL or on antidiabetic medication; (2) BMI ≥25 kg/m2; (3) triglycerides (TG) ≥150 mg/dL; (4) high density lipoprotein cholesterol (HDL-C) <40 mg/dL in men and <50 mg/dL in women; and (5) BP ≥130/85 mm Hg or on antihypertensive medication.
Clinical and laboratory measurements
Smoking status was evaluated using a questionnaire completed during an interview and patients were defined as never smok- ers, former smokers, or current smokers.
Height and weight were measured while subjects were wear- ing light clothing without shoes. BMI was calculated as weight in kilograms divided by the height in meters squared (kg/m2).
Percentage body fat and abdominal fat was estimated using a multi-frequency bioimpedance analyser (InBody 720, Biospace Co., Seoul, Korea), which has been validated with regards to reproducibility and accuracy for body composition [29], with eight-point tactile electrodes (two for each foot and hand). BP was measured using an automatic manometer with participants in a seated position after 5 minutes of quiet rest.
After overnight fasting, blood samples were drawn from the antecubital vein into vacuum tubes and subsequently analysed at a central, certified laboratory in Samsung Medical Center.
Total cholesterol, low density lipoprotein cholesterol (LDL-C), HDL-C, and TG levels were measured with an enzymatic colo- rimetric method using a Modular D2400 (Roche Diagnostics, Basel, Switzerland). Blood glucose concentration was deter- mined using a non-enzymatic method. HbA1c was measured using an immunoturbidimetric assay with Cobra Integra 800
automatic analyser (Roche Diagnostics) with a reference value range of 4.4% to 6.4%. HbA1c measurements were standard- ized to the reference method aligned with the Diabetes Control and Complications Trial and the National Glycohemoglobin Standardization Program standards. Serum insulin concentra- tion was measured by an immunoradiometric assay (TFB Co.
Ltd., Tokyo, Japan). As a marker of insulin resistance, the ho- meostatic model assessment of insulin resistance (HOMA-IR) was calculated using the following formula: HOMA-IR=
[fasting insulin (μIU/mL)×fasting glucose (mmol/L)]/22.5 [30]. Serum TSH levels were measured using an immunoradio- metric assay kit (Immunotech, Marseille Cedex, France). Se- rum T3 and T4 levels were measured using a radioimmunoas- say kit (Immunotech).
Study design and statistical analysis
All 13,496 subjects were divided into two groups according to whether or not they had MetS based on the 2006 records. In addition, all subjects were categorized into quartiles based on the level of thyroid hormones within the reference range: (1) TSH (Q1, 0.4 to 1.4 mU/L; Q2, 1.5 to 2.1 mU/L; Q3, 2.2 to 3.0 mU/
L; and Q4, 3.1 to 5.0 mU/L); (2) T3 (Q1, 1.10 to 1.51 nmol/L;
Q2, 1.52 to 1.69 nmol/L; Q3, 1.70 to 1.89 nmol/L; and Q4, 1.90 to 2.90 nmol/L); (3) T4 (Q1, 64.0 to 96.0 nmol/L; Q2, 96.1 to 107.0 nmol/L; Q3, 107.1 to 119.5 nmol/L; and Q4, 119.6 to 155.0 nmol/L); and (4) T3-to-T4 ratio (Q1, 0.0060 to 0.0140;
Q2, 0.0141 to 0.0159; Q3, 0.0160 to 0.0179; and Q4, 0.0180 to 0.0565). Continuous variables are expressed as the mean±SD, and categorical variables are expressed as the percentage (%).
Clinical and laboratory data with respect to the presence of MetS were compared using an independent t test for continu- ous variables and chi-square test for categorical variables.
Mean thyroid hormone levels of the study population with re- spect to the cut-off values of MetS components were compared using an independent t test or one-way analysis of variance as appropriate for the variable, and differences between groups were determined based on Tukey’s multiple comparison test.
After adjusting for confounding variables, logistic regression models were used to estimate the odds ratios (ORs) and 95%
confidence intervals (CIs) for MetS. All P values and 95% CI for OR were corrected by Bonferroni’s method due to multiple testing. All statistical tests were two-sided, and analyses were executed using SPSS version 14.0 (SPSS Inc., Chicago, IL, USA). A P value of less than 0.05 was considered statistically significant.
RESULTS
Baseline clinical and biochemical characteristics of the 13,496 subjects are summarized in Table 1. The overall prevalence of MetS in this cohort was 12% (n=1,664). Subjects with MetS were more likely to be older, and current or former smokers.
They also had higher BMI, body fat percentage, abdominal fat percentage, systolic and diastolic BP, total cholesterol, LDL-C, TG, fasting glucose, HOMA-IR, T3, and T3-to-T4 ratio, but
lower HDL-C and TSH levels, than those without MetS. There was no significant difference in T4 levels between the two groups.
The mean thyroid hormone levels according to select com- ponents of MetS are shown in Table 2. The mean TSH levels were negatively related to BMI (P<0.001), HDL-C level (P=0.012), fasting glucose level (P<0.001), and HbA1c level (P=0.017). The mean T3 levels were positively related to BMI (P<0.001), systolic BP (P<0.001), diastolic BP (P<0.001), Table 1. Baseline Characteristics of Study Subjects
Variable Metabolic syndrome Overall
(n=13,496)
No (n=11,832) Yes (n=1,664) P value
Male sex 6,852 (58) 1,316 (79) <0.001 8,168 (61)
Age, yr 50.5±6.6 52.3±6.5 <0.001 50.7±6.6
Smoking, current/former/never, % 17/29/54 27/37/36 <0.001 19/30/51
BMI, kg/m2 23.4±2.6 26.5±2.4 <0.001 23.8±2.7
Overweight (25≤BMI<30) 2,784 (24) 1,258 (76) <0.001 4,042 (30)
Obesity (BMI≥30) 134 (1) 109 (7) <0.001 243 (2)
Body fat, % 23.3±6.1 25.7±5.7 0.004 23.6±6.1
Male 20.2±4.4 23.8±4.1 <0.001 20.8±4.5
Female 27.7±5.4 33.1±4.9 <0.001 28.0±5.5
Abdominal fat, % 0.88±0.06 0.93±0.06 <0.001 0.88±0.06
Male 0.89±0.06 0.93±0.05 <0.001 0.90±0.06
Female 0.85±0.06 0.91±0.06 <0.001 0.86±0.06
Systolic BP, mm Hg 109.9±14.2 121.0±15.3 <0.001 111.3±14.8
Diastolic BP, mm Hg 67.7±9.8 74.4±10.0 <0.001 68.5±10.0
Total cholesterol, mg/dL 188.0±30.7 191.9±33.2 <0.001 188.5±31.0
LDL-C, mg/dL 122.8±27.9 125.4±29.9 0.001 123.1±28.2
HDL-C, mg/dL 59.4±13.5 47.3±10.9 <0.001 57.9±13.8
Male 55.5±11.9 47.2±11.3 <0.001 54.2±12.2
Female 64.8±13.8 47.7±9.2 <0.001 63.6±14.2
Triglycerides, mg/dL 114.7±63.9 214.0±102.5 <0.001 126.9±77.1
Fasting glucose, mg/dL 87.5±12.9 103.7±23.8 <0.001 89.5±15.6
HbA1c, % 5.3±0.5 5.9±0.9 <0.001 5.4±0.6
HOMA-IR 1.9±0.9 2.9±1.5 <0.001 2.1±1.1
TSH, mU/L 2.4±1.3 2.3±1.3 0.017 2.3±1.3
T3, nmol/L 1.72±0.28 1.78±0.29 <0.001 1.72±0.28
T4, nmol/L 108.6±17.9 108.3±18.4 0.521 108.6±17.9
T3-to-T4 ratio 0.016±0.003 0.017±0.003 <0.001 0.016±0.003
Values are expressed as number (%) or mean±SD. Demographic and biochemical characteristics of the study population with respect to the develop- ment of metabolic syndrome were compared using an independent t test for continuous variables and chi-square test for categorical variables.
BMI, body mass index; BP, blood pressure; LDL-C, low density lipoprotein cholesterol; HDL-C, high density lipoprotein cholesterol; HbA1c, gly- cated hemoglobin; HOMA-IR, homeostasis model assessment of insulin resistance; TSH, thyroid stimulating hormone; T3, triiodothyronine; T4, thyroxine.
HDL-C level (P<0.001), TG level (P<0.001), and fasting glu- cose level (P<0.001). The mean T3 level in the HbA1c 5.7 to 6.4 group was significantly higher than that in the HbA1c <5.7 or HbA1c ≥6.5 groups (P<0.001). The mean T4 levels were highest in the obesity group, followed by the underweight and normal BMI groups, then the overweight group (P=0.019).
Systolic BP (P<0.001), diastolic BP (P<0.001), and HbA1c (P=0.009) were positively related to the mean T4 levels. With regard to T3-to-T4 ratio, we observed similar trends as the ones shown between mean T3 levels and components of MetS.
The proportion of participants with MetS increased across the T3 quartile categories (P for trend <0.001) and T3-to-T4 ratio quartile categories (P for trend <0.001) (Supplementary Fig. S1). The risk of MetS according to thyroid hormone cate- gory is shown in Table 3. As the T3 quartile categories in- creased, the risk for MetS increased, with ORs of 1.254, 1.255, and 1.712 when compared to the lowest quartile. After adjust- ment for sex, age, body fat percentage, smoking, and HOMA- IR, the highest T3 quartile remained a significant risk factor for MetS (OR, 1.249; 95% CI, 1.020 to 1.529; P=0.031). The risk Table 2. Means for Thyroid Hormone Levels by Select Metabolic Syndrome Components
Variable No. (%) Thyroid hormones
TSH, mU/L T3, nmol/L T4, nmol/L T3-to-T4 ratio
BMI, kg/m2
Underweight (<18.5) 219 (2) 2.6±1.3a,* 1.67±0.28a,* 109.7±17.4a,‡ 0.015±0.003a,* Normal (18.5–24.9) 8,992 (66) 2.4±1.3a,* 1.71±0.28b,* 108.8±17.9a,‡ 0.016±0.003b,* Overweight (25–29.9) 4,042 (30) 2.2±1.2b,* 1.75±0.28c,* 108.0±17.9b,‡ 0.017±0.003c,*
Obesity (≥30) 243 (2) 2.2±1.2b,* 1.79±0.26d,* 110.9±20.0c,‡ 0.017±0.003c,*
Systolic BP, mm Hg
<130 10,272 (76) 2.3±1.3 1.71±0.28* 108.3±17.8* 0.016±0.003†
≥130e 3,224 (24) 2.3±1.3 1.76±0.29* 109.7±18.3* 0.017±0.003†
Diastolic BP, mm Hg
<85 10,756 (80) 2.3±1.3 1.71±0.28* 108.3±17.8* 0.016±0.003‡
≥85e 2,739 (20) 2.3±1.3 1.76±0.29* 109.9±18.5* 0.017±0.003‡
HDL-C, mg/dL
Lowf 1,555 (12) 2.5±1.3* 1.68±0.28* 108.8±17.7 0.016±0.003*
Highg 11,941 (88) 2.3±1.3* 1.73±0.28* 108.6±17.9 0.017±0.003*
Triglycerides, mg/dL
<150 9,966 (74) 2.3±1.3 1.70±0.28* 108.8±17.9 0.016±0.003*
≥150 3,530 (26) 2.4±1.3 1.80±0.28* 108.1±18.1 0.017±0.003*
Fasting glucose, mg/dL
<100 11,484 (85) 2.4±1.3* 1.72±0.28* 108.6±17.8 0.016±0.003*
≥100h 2,012 (15) 2.2±1.2* 1.75±0.29* 108.6±18.6 0.017±0.003*
HbA1c, %
<5.7 10,636 (79) 2.4±1.3a,‡ 1.72±0.28a,* 108.5±17.8a,† 0.016±0.003a,*
5.7–6.4 1,992 (15) 2.3±1.3a,b,‡ 1.75±0.29b,* 108.6±17.8a,† 0.017±0.003b,*
≥6.5h 868 (6) 2.2±1.3b,‡ 1.73±0.30a,* 110.4±19.6b,† 0.016±0.003a,*
Values are expressed as mean±SD. Thyroid hormone levels of the study population with respect to the cut-off values of metabolic syndrome compo- nents were compared using an independent t test or one-way analysis of variance as appropriate for the variable.
TSH, thyroid stimulating hormone; T3, triiodothyronine; T4, thyroxine; BMI, body mass index; BP, blood pressure; HDL-C, high density lipoprotein cholesterol; HbA1c, glycated hemoglobin.
a,b,c,dThe same letters indicate non-significant difference between groups based on Tukey’s multiple comparison test; eInclude patients on antihyper-
tensive medication regardless of systolic or diastolic BP levels; fHDL-C <40 mg/dL in men or <50 mg/dL in women; gHDL-C ≥40 mg/dL in men or
≥50 mg/dL in women; hInclude patients on antidiabetic medication regardless of fasting glucose or HbA1c levels; *P<0.001; †0.001≤P<0.01;
‡0.01≤P<0.05.
of MetS increased as the T3-to-T4 ratio quartile categories in- creased with ORs of 1.132, 1.350, and 1.692 when compared to the lowest quartile. The multivariate-adjusted OR (95% CI) for MetS in the highest T3-to-T4 ratio quartile group was 1.458 (1.141 to 1.863) compared to the lowest T3-to-T4 ratio quartile group (P<0.001), even after adjustment for sex, age, body fat percentage, smoking, and HOMA-IR. No significant differenc- es were seen in the proportion of subjects with MetS (Supple- mentary Fig. S1) and in the risk of MetS (Table 3) across the TSH quartile categories and T4 quartile categories.
DISCUSSION
Our study showed that a high T3 level and a high T3-to-T4 ra- tio were associated with unfavourable metabolic profiles in a healthy population. Moreover, a high normal T3 level and a
higher T3-to-T4 ratio were independently associated with MetS in euthyroid middle-aged subjects. However, we found no as- sociation between serum TSH and T4 levels within the refer- ence range and a risk of MetS, despite the significant correla- tion between those thyroid hormones and several metabolic pa- rameters.
Recent cross-sectional studies have reported that high normal T3 or fT3 levels correlated with components of MetS [10, 15,22]. Alevizaki et al. [15] demonstrated that T3 levels were positively associated with parameters of central obesity, includ- ing subcutaneous fat and preperitoneal fat, waist circumfer- ence, and waist-to-hip ratio. De Pergola et al. [10] and Kitahara et al. [23] observed significant associations of fT3 levels with both BMI and waist circumference. Moreover, Roef et al. [22]
reported that T3 and fT3 levels and fT3-to-fT4 ratio were posi- tively associated with BMI, waist circumference, and compo- Table 3. Risk of Metabolic Syndrome in Euthyroid Subjects according to Thyroid Hormone Quartiles
Thyroid hormone category Metabolic syndrome/total, n (%)
OR (95% CI)
Model 1 Model 2 Model 3
TSH quartiles, mU/L
0.4–1.4 481/3,744 (13) 1 1 1
1.5–2.1 395/3,414 (12) 0.888 (0.747–1.055) 0.919 (0.772–1.095) 0.926 (0.727–1.178)
2.2–3.0 423/3,085 (14) 1.078 (0.909–1.279) 1.170 (0.983–1.391) 1.245 (0.982–1.577)
3.1–5.0 365/3,253 (11) 0.857 (0.719–1.023) 1.016 (0.848–1.217) 1.134 (0.887–1.452)
T3 quartiles, nmol/L
1.10–1.51 323/3,307 (10) 1 1 1
1.52–1.69 403/3,373 (12) 1.254 (1.074–1.464)† 1.217 (1.040–1.424)‡ 1.025 (0.829–1.268) 1.70–1.89 415/3,470 (12) 1.255 (1.076–1.464)† 1.169 (1.001–1.366)‡ 1.000 (0.809–1.235) 1.90–2.90 523/3,346 (16) 1.712 (1.476–1.984)* 1.570 (1.351–1.824)* 1.249 (1.020–1.529)† T4 quartiles, nmol/L
64.0–96.0 481/3,631 (13) 1 1 1
96.1–107.0 390/3,387 (12) 0.852 (0.716–1.014) 0.870 (0.730–1.038) 0.867 (0.685–1.097) 107.1–119.5 354/3,153 (11) 0.828 (0.693–0.990)† 0.814 (0.680–0.975)† 0.746 (0.582–0.956)† 119.6–155.0 439/3,325 (13) 0.996 (0.841–1.180) 0.942 (0.794–1.119) 0.890 (0.706–1.121) T3-to-T4 ratio quartiles
0.0060–0.0140 333/3,379 (10) 1 1 1
0.0141–0.0159 375/3,406 (11) 1.132 (0.936–1.368) 1.132 (0.934–1.371) 1.097 (0.843–1.428) 0.0160–0.0179 428/3,329 (13) 1.350 (1.122–1.624)* 1.358 (1.126–1.638)* 1.275 (0.988–1.646) 0.0180–0.0565 528/3,382 (16) 1.692 (1.416–2.022)* 1.616 (1.349–1.936)* 1.458 (1.141–1.863)*
Model 1, unadjusted; Model 2, adjusted for sex and age; Model 3, adjusted for sex, age, body fat percentage, smoking and homeostasis model assess- ment of insulin resistance. OR and 95% CI for metabolic syndrome were estimated using logistic regression models. All P values and 95% CI for OR were corrected by Bonferroni’s method due to multiple testing.
OR, odds ratio; CI, confidence interval; TSH, thyroid stimulating hormone; T3, triiodothyronine; T4, thyroxine.
*P<0.001; †0.001≤P<0.01; ‡0.01≤P<0.05.
nents of MetS, such as TG levels, BP, and fasting plasma glu- cose levels, and negatively with HDL-C levels. However, whether high normal T3 levels increased the risk of MetS re- mains unknown [10,15,22,23]. In the current study, a high nor- mal T3 level and a high T3-to-T4 ratio were significantly asso- ciated with high BMI, BP, HDL-C, TG, and fasting glucose levels. Moreover, a high normal T3 level and a high T3-to-T4 ratio correlated with increased MetS, even after adjustment for sex, age, body fat percentage, smoking, and HOMA-IR. This increase in circulating levels of T3 may represent an adaptive protective response against the detrimental effects of obesity or insulin resistance. Tissue-specific regulation of deiodinases en- zyme levels were suggested as an important mechanism in al- tered thyroid hormone homeostasis in obese subjects [31]. The moderate increases in fT3 and T3 levels in obese patients lead to an increase in energy expenditure [32]. Basal metabolic rate, total energy expenditure, and sleeping energy expenditure are positively correlated to serum T3 or fT3 concentrations [32].
Therefore, changes in thyroid hormone concentrations in obe- sity may be regarded as an adaptation process to increased body weight [32]. Furthermore, leptin may be implicated as a mediator of the effects of obesity, as it could influence the thy- roid hormone axis. Previous studies demonstrated that the re- duction in serum leptin levels during weight loss could lead to decreased energy expenditure [33]. Apart from the central ef- fects of leptin on the hypothalamic-pituitary axis, decreased se- rum thyroid hormone levels during caloric deprivation may also be related to reduced liver type 1 deiodinase activity [34].
Conversely, increased circulating leptin levels in obese subjects may elevate serum T3 concentrations, which could serve as a mechanism to increase metabolic rate and confer a relative pro- tection against the development of obesity [31].
In contrast, inverse associations between fT4 levels within reference range and metabolic parameters have been reported [9,14,15,22,24]. Two cross-sectional studies investigated the association of fT4 levels with MetS, and discordant results were found between studies [14,24]. Kim et al. [14] showed that patients in the high normal fT4 quintile had a significantly lower prevalence of MetS than those in the lowest fT4 quintile, but such differences disappeared after adjustment for age and sex. More recently, Mehran et al. [24] found that lower normal fT4 levels were significantly related to a higher risk of insulin resistance and MetS. In addition, only one study by Roef et al.
[21] described positive associations between T4 levels within the reference range and body fat mass and insulin resistance, but the relationship between T4 levels and MetS was not inves-
tigated. In current study, data on fT4 levels were not available in most subjects, so we focused on T4 rather than fT4. High normal T4 levels correlated with unfavourable metabolic pa- rameters, such as high BP and HbA1c levels. However, we found no association between serum T4 levels within the refer- ence range and a risk of MetS.
Although TSH was regarded as the first factor to be used for the detection of thyroid dysfunction, it was not associated with MetS in our study. A few studies showed a positive relation be- tween TSH levels within the reference range and prevalent MetS [18,20], but the association remains under debate. One study in euthyroid subjects in Germany reported that high nor- mal TSH levels were associated with obesity, higher TG levels, and MetS [18]. Another study of euthyroid postmenopausal women in Korea found that high normal TSH levels were asso- ciated with an increased prevalence of MetS [20]. Conversely, Mehran et al. [24] found no association between TSH within the reference range and a risk of presenting with MetS, despite a significant correlation between TSH levels and insulin resis- tance, which is consistent with our results. Although we found BMI, HDL-C, fasting glucose, and HbA1c levels to be associ- ated with TSH, no significant differences were seen in the pro- portion of subjects with MetS and in the risk of MetS accord- ing to TSH. The discrepancy in results between reports may be due to differences in study populations, in the categorization of thyroid function, and in the factors included for adjustments in the analyses.
The main limitation of our current study is its retrospective nature. We did not measure anti-thyroid peroxidase antibodies to exclude potential underlying chronic autoimmune thyroid disease. We also lacked information on other exposures, in- cluding alcohol intake and physical activity, which influence metabolic profiles. In addition, the measurements of waist cir- cumference in the assessment of obesity were not available.
However, we hope that the inclusion of other anthropometric data including BMI and percentage of body fat and abdominal fat overcomes this limitation. The strength of our study is the large sample size, suitable exclusion criteria, and assessment of TSH, T3, and T4 levels.
In conclusion, serum T3 levels and T3-to-T4 ratio are inde- pendently associated with MetS in euthyroid middle-aged sub- jects. Further studies are warranted to confirm these findings.
In addition, longitudinal studies are needed to define this asso- ciation and its potential health implications.
CONFLICTS OF INTEREST
No potential conflict of interest relevant to this article was re- ported.
ACKNOWLEDGMENTS
This study was supported by the Research Grant Number CB- 2011-03-02 of the Korean Foundation for Cancer Research and Soonchunhyang University Research Fund.
ORCID
Ji Cheol Bae http://orcid.org/0000-0002-4763-5797 Jae Hoon Chung http://orcid.org/0000-0002-9563-5046
REFERENCES
1. Isomaa B, Almgren P, Tuomi T, Forsen B, Lahti K, Nissen M, et al. Cardiovascular morbidity and mortality associated with the metabolic syndrome. Diabetes Care 2001;24:683-9.
2. Klein I, Ojamaa K. Thyroid hormone and the cardiovascu- lar system. N Engl J Med 2001;344:501-9.
3. Lakka HM, Laaksonen DE, Lakka TA, Niskanen LK, Kumpusalo E, Tuomilehto J, et al. The metabolic syndrome and total and cardiovascular disease mortality in middle- aged men. JAMA 2002;288:2709-16.
4. Iglesias P, Ridruejo E, Munoz A, Prado F, Macias MC, Guerrero MT, et al. Thyroid function tests and mortality in aged hospitalized patients: a 7-year prospective observa- tional study. J Clin Endocrinol Metab 2013;98:4683-90.
5. Fommei E, Iervasi G. The role of thyroid hormone in blood pressure homeostasis: evidence from short-term hypothy- roidism in humans. J Clin Endocrinol Metab 2002;87:1996- 2000.
6. Uzunlulu M, Yorulmaz E, Oguz A. Prevalence of subclini- cal hypothyroidism in patients with metabolic syndrome.
Endocr J 2007;54:71-6.
7. Waring AC, Rodondi N, Harrison S, et al. Thyroid function and prevalent and incident metabolic syndrome in older adults: the Health, Ageing and Body Composition Study.
Clin Endocrinol (Oxf) 2012;76:911-8.
8. Bakker SJ, ter Maaten JC, Popp-Snijders C, Heine RJ, Gans RO. Triiodothyronine: a link between the insulin resistance syndrome and blood pressure? J Hypertens 1999;17:1725- 30.
9. Lin SY, Wang YY, Liu PH, Lai WA, Sheu WH. Lower se- rum free thyroxine levels are associated with metabolic syn- drome in a Chinese population. Metabolism 2005;54:1524- 8.
10. De Pergola G, Ciampolillo A, Paolotti S, Trerotoli P, Giorgi- no R. Free triiodothyronine and thyroid stimulating hor- mone are directly associated with waist circumference, in- dependently of insulin resistance, metabolic parameters and blood pressure in overweight and obese women. Clin En- docrinol (Oxf) 2007;67:265-9.
11. Roos A, Bakker SJ, Links TP, Gans RO, Wolffenbuttel BH.
Thyroid function is associated with components of the meta- bolic syndrome in euthyroid subjects. J Clin Endocrinol Metab 2007;92:491-6.
12. Asvold BO, Bjoro T, Nilsen TI, Vatten LJ. Association be- tween blood pressure and serum thyroid-stimulating hor- mone concentration within the reference range: a popula- tion-based study. J Clin Endocrinol Metab 2007;92:841-5.
13. Asvold BO, Vatten LJ, Nilsen TI, Bjoro T. The association between TSH within the reference range and serum lipid concentrations in a population-based study. The HUNT Study. Eur J Endocrinol 2007;156:181-6.
14. Kim BJ, Kim TY, Koh JM, Kim HK, Park JY, Lee KU, et al. Relationship between serum free T4 (FT4) levels and metabolic syndrome (MS) and its components in healthy euthyroid subjects. Clin Endocrinol (Oxf) 2009;70:152-60.
15. Alevizaki M, Saltiki K, Voidonikola P, Mantzou E, Papami- chael C, Stamatelopoulos K. Free thyroxine is an indepen- dent predictor of subcutaneous fat in euthyroid individuals.
Eur J Endocrinol 2009;161:459-65.
16. Garduno-Garcia Jde J, Alvirde-Garcia U, Lopez-Carrasco G, Padilla Mendoza ME, Mehta R, Arellano-Campos O, et al. TSH and free thyroxine concentrations are associated with differing metabolic markers in euthyroid subjects. Eur J Endocrinol 2010;163:273-8.
17. Wang F, Tan Y, Wang C, Zhang X, Zhao Y, Song X, et al.
Thyroid-stimulating hormone levels within the reference range are associated with serum lipid profiles independent of thyroid hormones. J Clin Endocrinol Metab 2012;97:
2724-31.
18. Ruhla S, Weickert MO, Arafat AM, Osterhoff M, Isken F, Spranger J, et al. A high normal TSH is associated with the metabolic syndrome. Clin Endocrinol (Oxf) 2010;72:696- 701.
19. Lai Y, Wang J, Jiang F, Wang B, Chen Y, Li M, et al. The relationship between serum thyrotropin and components of
metabolic syndrome. Endocr J 2011;58:23-30.
20. Lee YK, Kim JE, Oh HJ, Park KS, Kim SK, Park SW, et al.
Serum TSH level in healthy Koreans and the association of TSH with serum lipid concentration and metabolic syn- drome. Korean J Intern Med 2011;26:432-9.
21. Roef G, Lapauw B, Goemaere S, Zmierczak HG, Toye K, Kaufman JM, et al. Body composition and metabolic pa- rameters are associated with variation in thyroid hormone levels among euthyroid young men. Eur J Endocrinol 2012;
167:719-26.
22. Roef GL, Rietzschel ER, Van Daele CM, Taes YE, De Buyzere ML, Gillebert TC, et al. Triiodothyronine and free thyroxine levels are differentially associated with metabolic profile and adiposity-related cardiovascular risk markers in euthyroid middle-aged subjects. Thyroid 2014;24:223-31.
23. Kitahara CM, Platz EA, Ladenson PW, Mondul AM, Men- ke A, Berrington de Gonzalez A. Body fatness and markers of thyroid function among U.S. men and women. PLoS One 2012;7:e34979.
24. Mehran L, Amouzegar A, Tohidi M, Moayedi M, Azizi F.
Serum free thyroxine concentration is associated with met- abolic syndrome in euthyroid subjects. Thyroid 2014;24:
1566-74.
25. Taneichi H, Sasai T, Ohara M, Honma H, Nagasawa K, Takahashi T, et al. Higher serum free triiodothyronine lev- els within the normal range are associated with metabolic syndrome components in type 2 diabetic subjects with eu- thyroidism. Tohoku J Exp Med 2011;224:173-8.
26. Lambadiari V, Mitrou P, Maratou E, Raptis AE, Tountas N, Raptis SA, et al. Thyroid hormones are positively associat- ed with insulin resistance early in the development of type 2 diabetes. Endocrine 2011;39:28-32.
27. Alberti KG, Eckel RH, Grundy SM, Zimmet PZ, Cleeman
JI, Donato KA, et al. Harmonizing the metabolic syndrome:
a joint interim statement of the International Diabetes Fed- eration Task Force on Epidemiology and Prevention; Na- tional Heart, Lung, and Blood Institute; American Heart Association; World Heart Federation; International Athero- sclerosis Society; and International Association for the Study of Obesity. Circulation 2009;120:1640-5.
28. Physical status: the use and interpretation of anthropometry.
Report of a WHO Expert Committee. World Health Organ Tech Rep Ser 1995;854:1-452.
29. Malavolti M, Mussi C, Poli M, Fantuzzi AL, Salvioli G, Battistini N, et al. Cross-calibration of eight-polar bioelec- trical impedance analysis versus dual-energy X-ray absorp- tiometry for the assessment of total and appendicular body composition in healthy subjects aged 21-82 years. Ann Hum Biol 2003;30:380-91.
30. Matthews DR, Hosker JP, Rudenski AS, Naylor BA,
Treacher DF, Turner RC. Homeostasis model assessment:
insulin resistance and beta-cell function from fasting plas- ma glucose and insulin concentrations in man. Diabetologia 1985;28:412-9.
31. Araujo RL, Carvalho DP. Bioenergetic impact of tissue- specific regulation of iodothyronine deiodinases during nu- tritional imbalance. J Bioenerg Biomembr 2011;43:59-65.
32. Reinehr T. Obesity and thyroid function. Mol Cell Endocri- nol 2010;316:165-71.
33. Ahima RS. Leptin and the neuroendocrinology of fasting.
Front Horm Res 2000;26:42-56.
34. Bianco AC, Salvatore D, Gereben B, Berry MJ, Larsen PR.
Biochemistry, cellular and molecular biology, and physio- logical roles of the iodothyronine selenodeiodinases. En- docr Rev 2002;23:38-89.