Shipboard Test of Ballast Water Treatment System by Ozonation
Sung-Jin Park1⋅Ki-Wook Kim1⋅In-Soo Kim†
(Received October 13, 2009; Revised February 2, 2010; Accepted April 27, 2010)
Abstract:This study is currently giving priority to developing the ballast water treatment system using ozone(Ozone BWTS). The Ozone BWTS, were equipped on the real merchant vessel named as M. V. Hyundai Hong Kong to carried out shipboard tests of ballast water treatment system in accordance with orders of IMO G8 Guidelines. The study results show that the Ozone BWTS is capable of meeting the Ballast Water Performance Standard under Regulation D‐2 of the International Convention for the Control and Management of Ships’ Ballast Water and Sediments, and also the more stringent standards being proposed under US legislation.
Key words:Shipboard Test, Ballast Water Treatment System, Ozonation, IMO G8
†Corresponding Author (Dept. of Environmental Engineering, Korea Maritime University,) E-mail : [email protected], Tel : 051-410-4416
1 NK.Co.Ltd
1. Introduction
The development of ship's ballast water treatment systems that are effective, environmentally friendly and safe has been a complex, costly and time consuming process. At the root of many of treatment systems are methods that are already in use to some degree by the waste water treatment industry. A preliminary understanding of these treatment methods forms the basis for more detailed analysis and discussion of ballast water treatment systems. The diverse array of water treatment methods currently under development for use in ballast water treatment can be broken down into four major categories:
mechanical, chemical, physical, and combined process(N. Dobroski et al., 2009). In this study, the ballast water treatment system with ozonation(Ozone BWTS) was adopted for shipboard tests to treat real ballast water on board in accordance with IMO regulations.
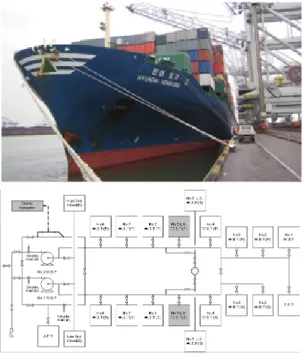
The shipboard tests were undertaken using a full‐scale Ozone BWTS fitted on the container ship M.V. Hyundai Hong Kong (Figure 1). Due to extreme difficulties in culturing large volumes of organisms on board ships, ship‐board testing must rely on the natural influent ballast water containing sufficient organism concentrations to meet Part 2 – 2.2.2.5 of the G8 Guidelines. During the ship‐board tests, for each Test Cycle the organism concentration in natural influent ballast
water was used.
2. Materials and Methods
2.1 Testing Scheme
The voyages and ports of call for the shipboard tests were selected to provide a spread of environmental conditions across different bioregions from Europe to South East Asia to North East Asia. The layout of the sampling points for the shipboard test is shown in Figure 1. In order to collect quality data and reduce the potential for sample contamination, the samples were collected according to the procedure as follow:
During ballasting and deballasting, three replicate samples of influent water were collected from each sampling point, at beginning, middle and end of test cycle.
For organism >50㎛ and 10~50㎛ in minimum dimension, the volume of samples collected was one cubic meter and one liter respectively. The one cubic meter grab sample was collected through a plankton net with diagonal dimension of 50㎛, and was then concentrated to a volume of 1ℓ. To minimize effect on viability of organisms, all samples were quickly transferred to the laboratory that had been established onboard. To minimize the analysis errors for organism
>50 ㎛ in minimum dimension, the samples were concentrated from 45 ml to 200 ml as different density of each sample, using a sieve no greater than 50 ㎛ mesh in diagonal dimension. Organisms 10~50 ㎛ in minimum dimension were analyzed without any treatment of samples.
Bi = [influent water for the control tank], Dt = [discharge treated water], Dc = [discharge control water], L.S.W.B.T.(P) [Treated Tank, 842 m3], L.S.W.B.T.(P) [Control Tank, 842 m3].
Figure 1: The M. V. Hyundai Hong Kong used for full‐scale ship board testing and arrangement of sampling points for the shipboard tests.
The test sequence was as follows: Test Cycle 1: Rotterdam to Thames Port (blue line). Test Cycle 2 (original): Thames Port to Singapore (purple line) (compromised).
Test Cycle 2 (new): Singapore to Busan (red line). Test Cycle 3: Busan to Hong Kong (green line). Test Cycle 4: Busan to Hong Kong (yellow line)
Figure 2: Ports of call of the M.V. Hyundai Hong Kong during the shipboard testing.
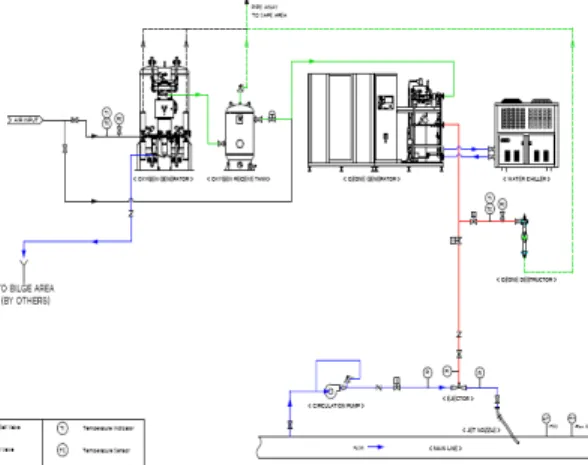
2.2 Equipment of Ozone BWTS
The Ozone BWTS is composed of five integrated modules (the neutralizer system has been added since the original application): Oxygen Generator, Ozone Generator, Ozone Injector, Neutralizer system and Monitoring and control system(MEPC 2008). The efficacy test of biology was undertaken on‐site by using of installed the ozone based ballast water treatment system (NKOZ ‐040, 10 wt%, NK Co., Ltd.). The injection level of ozone concentration was 2.5 gram of ozone per cubic meter of ballast water.
The Oxygen Generator is based on standard, off‐the‐shelf technology, thereby keeping costs very low compared to other systems. The Oxygen Generator takes air from a compressor and strips away the nitrogen, concentrating the oxygen and providing the raw material to produce Ozone.
The Ozone Generator is also based on standard, off‐the‐shelf technology, again keeping costs very low. The Ozone Generator passes the incoming oxygen through a high frequency electrical field to produce Ozone.
The Ozone Injector is based on a purpose‐built, patented ‘side‐stream injector’. This diverts incoming ballast water from the main ballast pipes into a
‘side‐stream’, where it is injected with Ozone before re‐entering the main ballast stream. The side‐stream injector ensures a high killrate through optimal saturation of the incoming ballast. The side‐stream injector also ensures a restricted dosage area – compared to trying to inject Ozone into the large volumes of the ballast
tanks. This eliminates potential for corrosion, by concentrating the Ozone in the injector area only, which is made from high‐grade, non‐corroding stainless steal.
The monitoring and control system again uses standard, off‐the‐shelf technology, and includes a variety of sensors, alarms, meters, valves and switches connected to central control software, and integrated with the ship’s overall ballast management system. This allows all aspects of the system to be monitored and controlled, and for all data on system operation to be kept electronically and printed as required by inspectors. The system includes safety alarms and automatic cut‐off switches.
There are also several items of ancillary equipment which support these modules:
Power Supply Unit (PSU) to provide overall power to the system; Compressor to feed air to the oxygen generator (in some cases this can be based on the ship’s existing air compressors); Refrigerated Dryer (RD) to de‐humidify air being fed
Figure 3: Schematic of overall Layout of the Ozone BWTS
to the oxygen generator; Chiller for the Closed Loop Cooling System (CLCS), which keeps the Ozone Generator cool;
and Ozone Destruct System (ODS) to convert any unused Ozone back to oxygen before release to the atmosphere. The overall layout of the Ozone BWTS is shown in Figure 2.
2.3 Analytical Methods
The analytical methods for organisms in minimum dimension and measuring for quality of ballast water are as follows:
2.3.1 Organisms (10~50㎛) in minimum dimension
1) Staining by CFDA AM(5~) [5]
(i) Concentrated sample divided by pipette.
(ii) Vital staining of 1% Neutral Red solution (1.5ml neutral red stock solution / 1,000ml sample).
(iii) Sample kept for 15 min, then concentrated on 50㎛ mesh. and rinsed repeatedly with filtered seawater to remove excess stain.
(iv) Sample transferred to a glass sample jar with alkaline filtered sea water (pH 9). The Alkaline solution stabilizes the stain inside organism tissues.
(v) Sample fixed in formaldehyde (final concentration 4%).
(vi) Sample transferred to gridded counting plate (Bogorov counting chamber).
(vii) Add diluted hydrochloric acid until below pH 7 (acidification develops stain).
(viii) Analysis (counting) with stereo microscope with dark field.
(ix) Live organisms appear red color whereas dead organisms unstained.
2) Microscopic evaluation
(i) Live organism samples transferred to gridded counting plate.
(ii) Stereo microscope used to assess movement of organism (damage to body, damage to flagellate, cell or tissue color).
(iii) Enumerated one by one non‐
moving organism.
2.3.2 Organisms (10~50㎛) in minimum dimension
1) Staining by CFDA‐AM(5‐carboxyfluorescein diacetate acetoxymethyl ester)
(i) 1ml of sample placed on a counting chamber.
(ii) Add 4 micro mol of 5‐CFDA‐AM working solution to the counting chamber.
(iii) Wait for 30 minutes for cell staining.
(iv) Analyse using epifluorescence microscope with a fluorescent filter (green light).
(v) Count viable organisms (represented green color)
2.3.3 Water qualities
Dissolved oxygen (DO), pH, salinity, turbidity and water temperature were measured by a portable multi‐probe (YSI multi‐probe) at every sampling time and point. Also Total suspended solid (TSS), particulate dissolved carbon (POC) and dissolved organic carbon (DOC) concentrations were determined for every sampling points. The analytical methods used in this study are listed in Table 1.
Table 1 : Analytical parameters and application methods.
Method Sensitivity Reference
pH Electrometric Method 0.01
Standard Method 1 4500‐H+ B
Turbidity Nephelometric Method 0.01 NTU Standard Method 2130 B
Salinity
Electrical Conductivity Method Density Method
1PSU 0.5PSU
Standard Method 2520 B
Standard Method 2520 C
DOC High‐Temperature
Combustion Method mg/l Standard Method 5310 B
POC High‐Temperature
Combustion Method mg C/l Standard Method 5310 B
TSS Total Suspended Solids
Dried at 103–105°C mg C/l Standard Method 2540 D
Organism (10~50 µm)
Fluorescein dying with 5‐CFDA AM 2 / Culture
methods 3
cell/l
Anja et al., (2005)/
UNESCO Organism
(≥50 µm)
Fluorescein dying with
Neutral Red ind./l ‐
Heterotrophic bacteria
A New Medium for the Enume‐ ration and Subculture of Bacteria
CFU/1ml ISO 6222
E. coli
Total Coliforms and Escherichia coli in Water
by Membrane Filtration
CFU/100ml CFU/100ml
EPA Method 1604 / ISO 9308‐1
Intestinal Enterococci
Enterococci in water by Membrane Filter
CFU/100ml CFU/100ml
EPA Method 1600 / EN‐ISO 7899‐2 Vibrio
Cholerae Vibrio Cholerae CFU/100ml Standard Method 9260 H
3. Results and Discussions
3.1 Influent Water Quality and Biological Concentrations
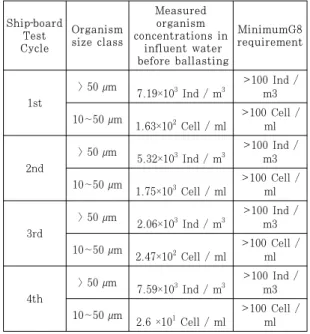
Naturally occurring organism concentrations in the influent water at ballasting during shipboard testing complied with Part 2 – 2.2.2.5 of the G8 Guidelines, as presented in Table 2.
Table 2: Natural organism concentrations in influent ballast water as measured for each shipboard Test Cycle.
Ship‐board Test Cycle
Organism size class
Measured organism concentrations in
influent water before ballasting
MinimumG8 requirement
1st
> 50 µm
7.19×10³ Ind / m3
>100 Ind / m3
10~50 µm
1.63×10² Cell / ml
>100 Cell / ml
2nd
> 50 µm
5.32×10³ Ind / m3
>100 Ind / m3 10~50 µm
1.75×10³ Cell / ml
>100 Cell / ml
3rd
> 50 µm
2.06×10³ Ind / m3
>100 Ind / m3
10~50 µm
2.47×10² Cell / ml
>100 Cell / ml
4th
> 50 µm 7.59×10³ Ind / m3
>100 Ind / m3
10~50 µm
2.6 ×101 Cell / ml
>100 Cell / ml
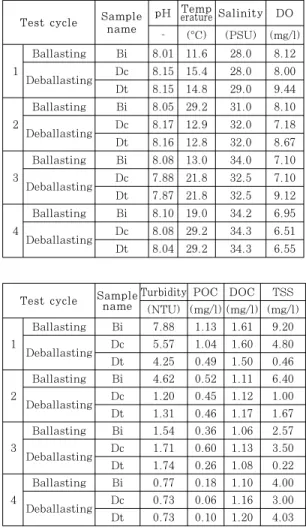
3.2 Water Quality
Water quality data in the tested water are presented in Tables 3. The ballast water used in the tests was collected by the container ship during voyage.
Observed salinities varied by less than 1.5 PSU in each test cycle. Salinity were 28.0 to 34.3 PSU in test cycle 1 to 4. Salinity did not change in either the treated or control tank during the duration of the tests. The temperatures of the water samples were higher in test cycle 1 to 4, water temperatures ranged from 11.6 to 29.2 °C. The temperature varied by the port in the test cycle. The pH for all of the samples was seawater and brackish water, slightly alkaline. In test cycle 1 to 4, the pH ranged from 7.87 to 8.17 There was no pH difference between the treatment and control tanks. The dissolved oxygen (DO) in the ballast
Test cycle Sample name
pH Temperature Salinity DO
‐ (°C) (PSU) (mg/l)
1
Ballasting Bi 8.01 11.6 28.0 8.12
Deballasting Dc 8.15 15.4 28.0 8.00
Dt 8.15 14.8 29.0 9.44
2
Ballasting Bi 8.05 29.2 31.0 8.10
Deballasting Dc 8.17 12.9 32.0 7.18
Dt 8.16 12.8 32.0 8.67
3
Ballasting Bi 8.08 13.0 34.0 7.10
Deballasting Dc 7.88 21.8 32.5 7.10
Dt 7.87 21.8 32.5 9.12
4
Ballasting Bi 8.10 19.0 34.2 6.95
Deballasting Dc 8.08 29.2 34.3 6.51
Dt 8.04 29.2 34.3 6.55
water was relatively high at the beginning of the tests, beginning at 9.44 mg/L in test cycle 1 to 4. In the treatment tank, there was a trend of increasing oxygen concentrations, as the tank was injected ozone. The maximum levels of oxygen were found at the end of the ozonation period. Concentrations of oxygen were 2 times the initial levels, approaching or slightly exceeding 12.0 mg/L. In the control tanks the oxygen concentration did not increase during the experiment.
Table 3: Measurements of temperature, pH, salinity, dissolved oxygen (DO) and turbidity in the test water for each test cycle.
Test cycle Sample name
Turbidity POC DOC TSS (NTU) (mg/l) (mg/l) (mg/l)
1
Ballasting Bi 7.88 1.13 1.61 9.20 Deballasting Dc 5.57 1.04 1.60 4.80
Dt 4.25 0.49 1.50 0.46
2
Ballasting Bi 4.62 0.52 1.11 6.40 Deballasting Dc 1.20 0.45 1.12 1.00
Dt 1.31 0.46 1.17 1.67
3
Ballasting Bi 1.54 0.36 1.06 2.57
Deballasting Dc 1.71 0.60 1.13 3.50
Dt 1.74 0.26 1.08 0.22
4
Ballasting Bi 0.77 0.18 1.10 4.00
Deballasting Dc 0.73 0.06 1.16 3.00
Dt 0.73 0.10 1.20 4.03
3.3 Quantification of viable organisms.
Shipboard test results for the quantification of viable organisms ≥ 50 µm to assess compliance of the Ozone BWTS with the IMO D-2 Ballast Water Performance Standard are presented in Figure 4.
The total numbers of viable organisms of the greater than or equal to 50 microns in minimum dimension in treated samples have been expressed as percentages of corresponding controls. When comparison is made between 99.4 % and 99.8 %.
Shipboard test results for the quantification of viable organisms 10 to 50 µm to assess compliance of the ozone
0 500 1000 1500 2000 2500 3000
Cycle 1 Cycle 2 Cycle 3 Cycle 4 99.00 99.20 99.40 99.60 99.80
Removal Rate, %
Dc Dt Efficacy
Figure 4: Abundance of viable organisms (≥ 50 µm) at each sampling location
0 50 100 150 200 250
Cycle 1 Cycle 2 Cycle 3 Cycle 4 99.00 99.10 99.20 99.30 99.40 99.50 99.60 99.70 99.80 99.90 100.00
Removal Rate, %
Bi Dt Efficacy
Figure 5: Abundance of viable organisms (10 ~ 50 µm) at each sampling location
BWTS with the IMO D-2 Ballast Water Performance Standard are presented in Figure 5.
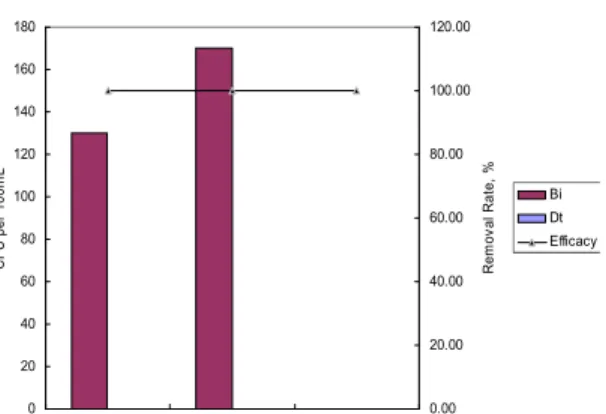
Test results for the quantification of bacteria to assess compliance of the Ozone BWTS with the IMO D-2 Ballast Water Performance Standard are presented in Figure 6.
0 20 40 60 80 100 120 140 160 180
CFU per 100mL
0.00 20.00 40.00 60.00 80.00 100.00 120.00
Removal Rate, %
Bi Dt Efficacy
Figure 6: Identification and quantification of viable bacteria group at each sampling location
4. Conclusions
The Ozone BWTS was tested in a full scale system to evaluate performance according to the IMO G8 Guidelines.
Shipboard testing was undertaken on the container ship, M.V. Hyundai Hong Kong during four separate voyages from Rotterdam to Thames Port, Singapore to Busan and two separate voyages Busan to Hong Kong. All tests were conducted according to the requirements of the G8 Guidelines. Test results show that the Ozone BWTS meets the Ballast Water Performance Standard contained in Regulation D-2 of the IMO Ballast Water Management Convention, as well as all of the operational, safety, and environmental testing requirements of the G8 Guidelines, as required for Type Approval.
References
[1] MEPC (Marine Environment Protection Committee). Guidelines for approval of ballast water management systems (G8). MEPC 53/24/Add.1. Annex 3 – Resolution.125(53). Adopted on July 22, 2005.
[2] N. Dobroski, C. Scianni, D. Gehringer and M. Falkner. Assessment of the Efficacy, Availability, and Environmental Impacts of Ballast Water Treatment Systems for Use in California Waters.
Produced for the California State Legislature. pp. 25~28, 2009.
[3] MEPC (Marine Environment Protection Committee). Application for Final Approval of NK-O3 BlueBallast System (Ozone). Submitted by Republic of Korea. 58/2/3. pp. 2~4, 2008.
[4] Dressel, D.M., Heinle, D.R., and Grote, M.C., Vital staining to sort dead and live copepods. Chesapeake Science 13, pp. 156~159, 1972.
[5] Schirmer, K., Chan, A.G.J., Greenberg, B.M., Dixon, D.G. and Bols, N.C.
Toxicology in Vitro, 11, pp. 107~119, 1997.
[6] Anja S, T. Cheryl, S. James, and S.
Kristin. Application of Alamar blue/5-carboxyfluorescein diacetate acetoxymethyl ester as a noninvasive cell viability assay in primary hepatocytes from rainbow trout.
Analytical Biochemistry. (344) pp.
76~85, 2005.
Author Profile
Sung-Jin Park
He graduated Korea Maritime University. After receiving his Masters and Doctorate degrees in Environmental Engineering in 2001 and 2009 respectively, he joined NK Company in Busan, Korea. He is currently working in R&D center of NK Company as Principal Research Engineer, responsible for developing ballast water treatment system.
Ki-Wook Kim
He received his the BS and MS degree in Food Science &
Technology from Pukyong National University in 1998 and 2000, respectively. He currently works at NK Company as a Senior Research Engineer or researcher.
In-Soo Kim
He graduated KMU and received his M Eng. & Dr. Eng. from Dong-A Univ. He is currently a professor in Division of Environmental Engineering at Korea Maritime University in Busan, Korea.