Seung-mahn Ahn**··Jin-min Shin***··Dong-hoon Shin****··Kyoo-seock Lee*****
Asia Aerial Survey Co. Ltd., 380-42, Mangwon-dong, Mapo-gu, Seoul, Korea**
6-803, Mujigae A.P.T, Siheung-dong, Geumcheon-gu, Seoul, Korea***
Graduate Student, Dept. of Landscape Architecture, Sungkyunkwan Univ.****
Professor, Dept. of Landscape Architecture, Sungkyunkwan Univ.*****
원격탐사와 GIS를 이용한 대전광역시 토지이용 변화 검출*
안승만**·신진민***·신동훈****·이규석*****
(주)아세아 항측**·서울 금천구 시흥동***·성균관대학교 대학원 조경학과****·성균관대학교 조경학과*****
요 약
지난 몇 십 년 동안 한국에서는 도시의 확장으로 인해 인구 밀집지역에서의 토지이용이 급속 하게 변화되었으며, 그 결과 도시의 환경은 악화되었다. 도시화는 도시민에 필요한 녹지의 크기 와 수를 감소시킬 뿐만 아니라, 서식처 파괴의 원인이 되며, 적절한 녹지의 배치 또는 배열이 이뤄지지 않을 경우 도시내 생태적 기능의 결핍을 초래한다.
경관변화의 증명과 분석은 토지이용변화의 환경 요소의 인과관계 파악에 중요하다. 원격탐사 와 지형정보체계는 토지이용 변화의 경향과 영향을 이해할 수 있어 녹지공간변화 파악에 사용 된다. 원격탐사는 동일대상지의 다른 시기에서의 영상자료를 이용해 토지이용의 경년변화를 파 악하며 지형정보체계는 이를 저장, 분석에 활용되고 있다. 본 연구는 원격탐사와 지형정보체계 를 이용하여, 1989년부터 1998년 동안, 대전광역시의 토지이용 변화를 파악하며 그 원인을 살펴 보는데 있다.
주요어 : land use, change detection, remote sensing, GIS
* This work was supported by grant R01-1999-000-00173-0 from the Basic Research Program of the Korea Science & Engineering Foundation.
I. Introduction
The land use in the metropolitan area has been changed rapidly due to the urban expansion in Korea during the last few decades. And such changes result in environmental problems (Yokohari et al., 2000). Human activity is not only reducing the size and number of remaining nat- ural areas but also causing habitat fragmentation, which result in configurations, or arrangements of these areas that are poorly suited to maintain- ing ecological function(Smith and Hellmund, 1993). Planning always requires information and it is also true of landscape planning based on land information. Since the first launch of Landsat in 1972 land information has been updated periodically. Identification and analysis of landscape change have become key compo- nents in dealing with the environmental conse- quences of the land use change. Remote sens- ing(RS) and geographical information systems (GIS) can be used for land use change detection to understand the impact and trend of the land use change. Change detection is the process of identifying differences in the state of an object or phenomenon by observing it at different times(Singh, 1989). It can provide a quantitative and comparative information. The basic premise in using remote sensing data for change detection is that changes in land cover must result in
changes in radiance values. It must be large with respect to radiance changes caused by other fac- tor(Ingram et al., 1981). The purpose of this study is to detect and quantitatively evaluate urban land use changes in Daejon metropolitan region for the last decade.
II. Methods
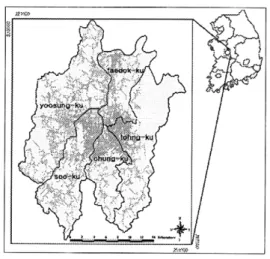
The study area is Daejon. Figure 1 shows Daejon metropolitan area located in the central part of South Korea. The area of Daejon metro- politan area is 540.1km2 and it consists of five districts, Yoosung-ku(17,504.7ha), Taedok-ku (6,870.3ha), Tohng-ku(13,790.8ha), Seo-ku (9,637.7ha), and Chung-ku(6,208.4ha). The popu-
Table 1. Area of each district in Daejon and population change between 1989 and 1998
Administration Yoosung-ku Taedok-ku Tohng-ku Seo-ku Chung-ku Sum
PO_1989 80,148 151,259 302,293 206,037 312,058 1,051,795
PO_1998 151,399 209,369 261,248 463,903 259,765 1,345,684
Changed population 71,251 58,110 -41,045 257,866 -52,293 293,889
Area(ha) 17,504.7 6,870.3 13,790.8 9,637.7 6,208.4 54,011.5
Administration Yoosung-ku Taedok-ku Tohng-ku Seo-ku Chung-ku Sum
(unit: person) Figure 1. Study Area
lation increased from 1,051,795 (1989) to 1,345,684 (1998). Table 1 shows the population change between 1989 and 1998.
Two Landsat TM scenes acquired on October 9, 1989, and October 2, 1998, respectively were used to detect land cover change in the study area. Korea Multi-Purpose Satellite-1(KOMP- SAT-1) Electro-Optical Camera(EOC) image with 6.6m resolution and aerial photographs (1/20,000) were also used as reference data. In terms of RS and GIS softwares, PCI(RS) and ArcView(GIS) were used in this study. PCI was used for image rectification, resampling, training area selection and classification and so on.
ArcView was used for storing and analyzing land cover classification data statistically. All scenes were rectified to the Korean Transverse Mercator coordinate system and geometrically corrected. In geometric correction, ground con- trol points(GCP’s) were selected by referring to dominant features in the topographic map such as bridge, reservoir and highway intersections.
Then, the first order nearest neighbor resampling
scheme was used to preserve the original digital numbers. After the land cover classification of each year, classification accuracy assessment was done by referring to KOMPSAT EOC image and 1:20,000 aerial photographs. For the 1989 accura- cy assessment, 1:20,000 aerial photos were used as reference data while KOMPSAT image was used for 1998 classification accuracy assessment.
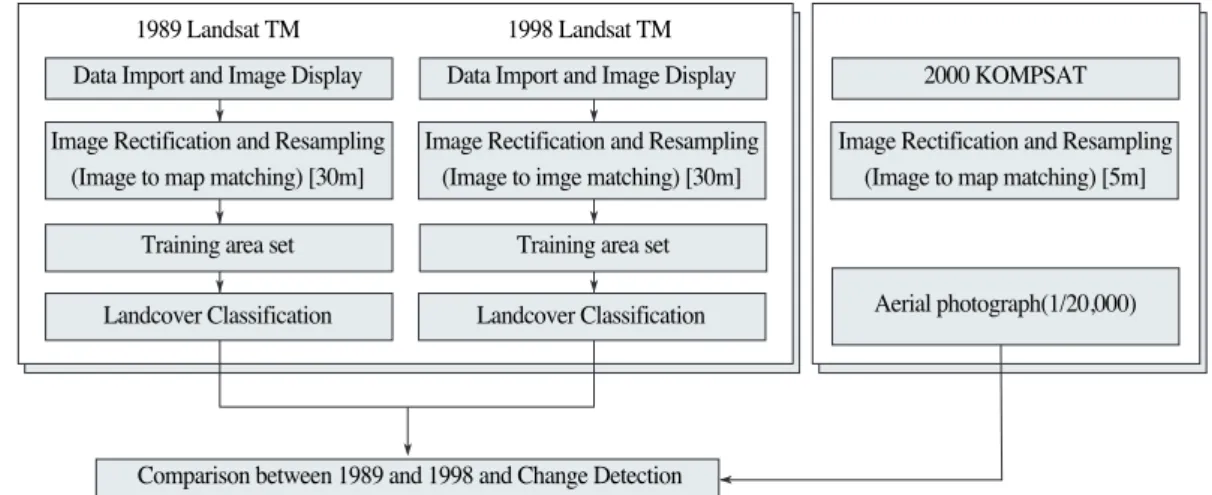
After generating both year land use maps, the land use change detection was done by compar- ing the land cover maps of 1988 and 1998. Figure 2 shows the study procedure.
III. Results and Discussion
The classification accuracy assessment was obtained for the study site and there were five classes classified as forest, agriculture, barren, urban and water. Classification accuracy assess- ment was done using PCI software based on three hundred random samples. The classified pixel was compared with the enhanced image by visual interpretation. However, the edge
Figure 2. Flowchart of classification and change detection for satellite data Data Import and Image Display
1989 Landsat TM
Comparison between 1989 and 1998 and Change Detection 1998 Landsat TM
Training area set
Landcover Classification Landcover Classification Training area set Image Rectification and Resampling
(Image to map matching) [30m]
Image Rectification and Resampling (Image to imge matching) [30m]
Image Rectification and Resampling (Image to map matching) [5m]
Aerial photograph(1/20,000) Data Import and Image Display 2000 KOMPSAT
area like lake or forest were not easy for dis- crimination. Most of the study area was checked in the field from the spring 2000 to the summer 2002.
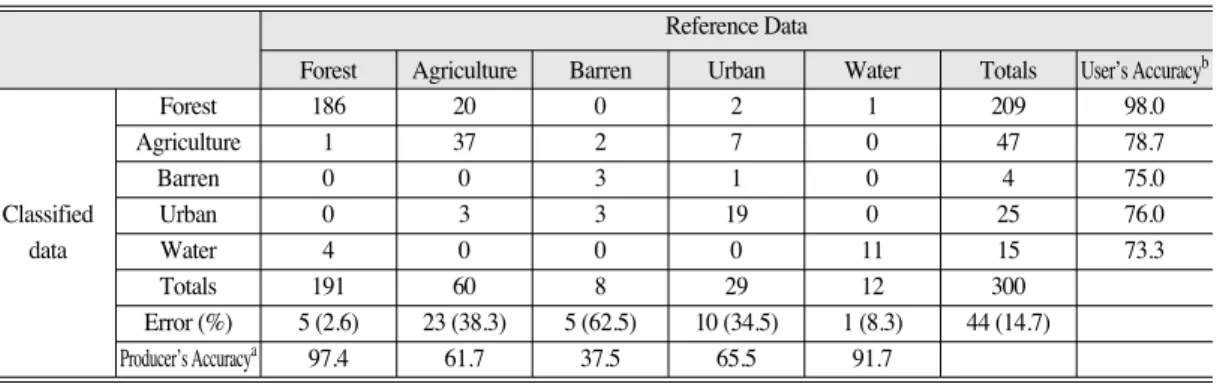
Tables 2 and 3 show the confusion matrices for the accuracy of 1989 and 1998 year. Overall accu- racy of the 1989 image classification was 85.3%(Table 2) and that of the 1998 image classi- fication was 78.3%(Table 3) based on the selected three hundred random sample pixels.
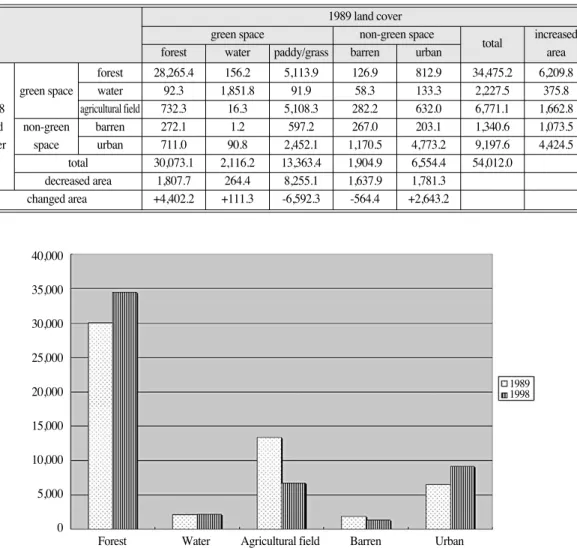
Figure 3 and Table 4 show the trend of land cover changes between 1989 and 1998. As we can
see in Table 4, the largest changed(sum of decreased area and increased area) land use type is green space - agricultural field and forest - . Of the green spaces, agricultural field decreased by 6,592.3ha and the forest increased by 4,402.1ha.
The main reason of forest increase is the growth of seedling tree forest which were classified as pasture(5,113.9 ha) in 1989 image. For the non- green space type, the urban area increased by 2,643.2ha, and the barren area decreased by 564.4ha.
The common trend of land cover change at Table 2. Confusion Matrix of classification image(1989)
Reference Data
Forest Agriculture Barren Urban Water Totals User’s Accuracyb
Forest 186 20 0 2 1 209 98.0
Agriculture 1 37 2 7 0 47 78.7
Barren 0 0 3 1 0 4 75.0
Classified Urban 0 3 3 19 0 25 76.0
data Water 4 0 0 0 11 15 73.3
Totals 191 60 8 29 12 300
Error (%) 5 (2.6) 23 (38.3) 5 (62.5) 10 (34.5) 1 (8.3) 44 (14.7)
Producer’s Accuracya 97.4 61.7 37.5 65.5 91.7
a, b: Producer’s accuracy and user’s accuracy mean measure of omission error and commission error respectively.
Overall Accuracy : 85.3%
Reference Data
Forest Agriculture Barren Urban Water Totals User’s Accuracyb
Table 3. Confusion Matrix of classification image(1998) Reference Data
Forest Agriculture Barren Urban Water Totals User’s Accuracyb
Forest 174 16 1 7 2 200 87.0
Agriculture 5 29 3 16 0 53 54.7
Barren 0 7 2 6 0 15 13.3
Classified Urban 0 0 1 19 0 20 95.0
data Water 0 0 1 0 11 12 91.7
Totals 179 52 8 48 13 300
Error (%) 5 (2.8) 23 (44.2) 6 (75.0) 29 (60.4) 2 (15.4) 65 (21.7)
Producer’s Accuracya 97.2 55.8 25.0 39.6 84.6
a, b: Producer’s accuracy and user’s accuracy mean measure of omission error and commission error respectively.
Overall Accuracy : 78.3 %
Reference Data
Forest Agriculture Barren Urban Water Totals User’s Accuracyb
each district is the decrease of agricultural field and increase of forest area. Figure 5 and Table 5 show land cover change for five districts, Yoosung-ku, Taedok-ku, Tohng-ku, Seo-ku, and Chung-ku. As we can see in Table 5, the forest area at each district increased by 1,609.8ha, 343.4ha, 1,370.3ha, 652.1ha, and 426.6ha respec- tively while agricultural field at each district decreased by 2,298.3ha, 924.2ha, 1,487.2ha, 1,347.5ha, and 535.1ha respectively. The most
important reason of decreasing agricultural field is the urbanization(2,643.2ha). The urban area increased 743.8ha, 613.6ha, 131.9ha, 944.6ha, and 209.4ha respectively. As we can see in Figure 5, the urbanization occurred mostly at Seo- ku(944.6ha), Yoosung-ku(743.8ha), and Taedok- ku(613.6ha) while the other two districts - Tohng- ku(131.9ha) and Chung-ku(209.4ha) - increased less. It is also true of barren land(1,170.5ha). At Seo-ku the urbanization were caused mainly due Table 4. Land cover changes in Daejon metropolitan area
1989 land cover
green spacenon-green space total increased area forest water paddy/grass barren urban
forest 28,265.4 156.2 5,113.9 126.9 812.9 34,475.2 6,209.8
green space water 92.3 1,851.8 91.9 58.3 133.3 2,227.5 375.8
1998 agricultural field 732.3 16.3 5,108.3 282.2 632.0 6,771.1 1,662.8
land non-green barren 272.1 1.2 597.2 267.0 203.1 1,340.6 1,073.5
cover space urban 711.0 90.8 2,452.1 1,170.5 4,773.2 9,197.6 4,424.5
total 30,073.1 2,116.2 13,363.4 1,904.9 6,554.4 54,012.0
decreased area 1,807.7 264.4 8,255.1 1,637.9 1,781.3
changed area +4,402.2 +111.3 -6,592.3 -564.4 +2,643.2
1989 land cover
green space non-green space
total increased
forest water paddy/grass barren urban area
(unit : ha)
Figure 3. land use change in Daejon between 1989 and 1998 40,000
35,000 30,000 25,000 20,000 15,000 10,000 5,000 0
Forest Water Agricultural field Barren Urban
1989 1998
to the development Doonsan new town. It is also true of development of military area(Jaundae) and Noheun Distrcit at Yoosung-ku and the
development of industrial area at Moonpyung- dong, Taedok-ku.
Figure 4. land use change area for five districts between 1989(left) and 1998(right) forest
water paddy/grass barren urban No Data
Table 5. Land cover change for each district
year forest wateragricultural field barren urban total
1989 9,275.7 132.2 6,247.6 793.7 1,055.5
Yoosung-ku 1998 10,885.5 198.7 3,949.3 671.9 1,799.3 17,504.7
changed (+)1,609.8 (+)66.5 (-)2,298.3 (-)121.8 (+)743.8
1989 3,191.6 552.2 1,484.1 302.0 1,340.6
Taedok-ku 1998 3,535.0 552.2 559.9 269.0 1,954.2 6,870.3
changed (+)343.4 (+)0.1 (-)924.2 (-)32.9 (+)613.6
1989 8,796.0 1,350.2 1,962.0 145.0 1,537.7
Tohng-ku 1998 10,166.2 1,379.5 474.8 100.7 1,669.5 13,790.8
changed (+)1,370.3 (+)29.3 (-)1,487.2 (-)44.3 (+)131.9
1989 5,059.6 66.2 2,755.2 496.9 1,259.8
Seo-ku 1998 5,711.7 87.6 1,407.7 226.4 2,204.4 9,637.7
changed (+)652.1 (+)21.3 (-)1,347.5 (-)270.5 (+)944.6
1989 3,750.2 15.4 914.5 167.4 1,360.9
Chung-ku 1998 4,176.8 9.5 379.4 72.5 1,570.3 6,208.4
changed (+)426.6 (-)5.9 (-)535.1 (-)95.0 (+)209.4
(+) : increased area, (-) : decreased area
year forest water agricultural field barren urban total
(unit : ha)
In summary, the urban land use change in Daejon is mainly due to the urbanization.
IV. Conclusions
After the comparative analysis approach of independently produced land cover classifications between 1989 and 1998 was done, the following conclusions are derived for the land use change.
First, there is a significant increase of forest land(4,402.2ha) which is mainly due to the growth of seedling forest during this period.
Second, the agricultural field area decreased by 6,592.3ha. Yoosung-ku and Tohng-ku occupies the major portion of that increase. It is mainly due to the urbanization. The urban area increased by 2,643.2ha while the barren land decreased by 564.4ha. Yoosung-ku, Seo-ku, and Taedok-ku occupies the major portion of that increase.
References
Bauer, M. E. et al., 1994, Satellite Inventory of Minnesota Forest Resources, Photogrammetric engineering & remote sensing, 60(3), 287-298.
Hermann, S., E. Osinski, 1999, Planning sustainable land use in rural areas at different spatial levels using GIS and modelling tools, Landscape and Urban Planning, 46, 93-101.
Ingram, K., E. Knapp, and J. W. Rominson, 1981, Change detection technique development for improved urbanized area delineation, technical memorandum CSC/TM-81/6067, Computer Sciences Corporation, Silver Springs, Maryland, U.S.A.
Jensen, J. R. 1996, Introductory Digital Image Processing: A Remote Sensing Perspective, Prentice Hall, Englewood Cliffs, New Jersey, 257-279.
Singh, A., 1989, Review article : Digital change detection techniques using remotely-sensing Figure 5. Land cover change for each districts between 1989 and 1998
2,000 1,500 1,000 500 0 -500 -1,000 -1,500 -2,000 -2,500
Seo-ku Yoosung-ku Taedok-ku Chung-ku Tohng-ku
Forest Agricultural field Barren Urban
data. International journal of remote sensing, 10(6), 989-1003.
Smith, D. S. and P. C. Hellmund, 1993, Ecology of greenways, University of Minnesota Press, Minneapolis, 1-21.
Yokohari, M., K. Takeuchi, T. Watanabe, S. Yokota, 2000, Beyond greenbelts and zoning: A new planning concept for the environment of Asian mega-cities, Landscape and Urban Planning, 47, 159-171.