Korean J Environ Agric (2012) Online ISSN: 2233-4173 Vol. 31, No. 3, pp. 205-211 http://dx.doi.org/10.5338/KJEA.2012.31.3.205 Print ISSN: 1225-3537
Effect of Nitrogen Application Rates on Nitrous Oxide Emission during Crop Cultivations in Upland Soil
Jong-Eun Lee,
1Yeo-UK Yun,
1Moon-Tae Choi,
1Suck-Kee Jung,
1Yun-Gyu Nam,
1Prabhat Pramanik
2and Pil Joo Kim
2,3*
1Chungcheongnam-do Agricultural Research and Extension Services, Yeasan 340-861, Korea
2Institute of Agriculture and Life Science, Gyeongsang National University, Jinju 660-701, South Korea
3Division of Applied Life Science (BK21 program), Gyeongsang National University, Jinju 660-701, South Korea
Received: 11 July 2012 / Accepted: 18 September 2012
ⓒ 2012 The Korean Society of Environmental Agriculture
*교신저자(Corresponding author),
Phone: +82-55-772-1966; Fax: +82-55-772-1969;
E-mail: [email protected]
205
Abstract
BACKGROUND: Generally, nitrogen (N) fertilization higher than the recommended dose is applied during vegetable cultivation to increase productivity. But higher N fertilization also increases the concentrations of nitrate ions and nitrous oxide in soil. In this experiment, the impact of N fertilization was studied on nitrous oxide (N
2O) emission to standardize the optimum fertilization level for minimizing N
2O emission as well as increasing crop productivity. Herein, we developed N
2O emission inventory for upland soil region during red pepper and Chinese milk vetch cultivation.
METHODS AND RESULTS: Nitrogen fertilizers were applied at different rates to study their effect on N
2O emission during red pepper and Chinese milk vetch cultivation. The gas samples were collected by static closed chamber method and N
2O concentration was measured by gas chromatography.
The total N
2O flux was steadily increased due to increasing N fertilization level, though the overall pattern of N
2O emission dynamics was same. Application of N fertilization higher than the recommended dose increased the values of both seasonal N
2O flux (94.5% for Chinese cabbage and 30.7% for red pepper) and N
2O emission per unit crop yield (77.9% for Chinese cabbage and 23.2% for red pepper).
Nitrous oxide inventory revealed that the N
2O emission due
to unit amount of N application from short-duration vegetable field in fall (autumn) season (6.36 kg/ ha) was almost 70% higher than that during summer season.
CONCLUSION: Application of excess N-fertilizers increased seasonal N
2O flux especially the N
2O flux per unit yield during both Chinese cabbage and red pepper cultivation.
This suggested that the higher N fertilization than the recommended dose actually facilitates N
2O emission than boosting plant productivity. The N
2O inventory for upland farming in temperate region like Korea revealed that N
2O flux due to unit amount of N-fertilizer application for Chinese cabbage in fall (autumn) season was comparatively higher than that of summer vegetables like red pepper. Therefore, the judicious N fertilization following recommended dose is required to suppress N
2O emission with high vegetable productivity in upland soils.
Key Words: N
2O emission inventory, N
2O flux, N fertilizer treatment, Vegetable cultivation
Introduction
Nitrous oxide (N
2O) is one of the key greenhouse gases emitted from soil and has a life time of about 170 years (Prinn et al. , 1990). This gas not only leads to the chemical destruction of ozone in stratosphere, but also is an important greenhouse gas with a global warming potential of 310 times higher than that of
Open Access
Research Article
carbon dioxide on per-molecule basis (Rodhe, 1990).
Battle et al. (1996) reported that the contemporary atmospheric N
2O concentration measured at the South Pole was about 311 nmol/mol and is increasing at a rate of 0.74 nmol/mol/year. Nitrous oxide emitted due to anthropogenic factors account up to 64% of the total global N
2O emission.
Though road transport, power generation and the preparation of acidic chemicals also produce notable releases, agriculture contributes almost 92% of the total anthropogenic N
2O emission (Duxbury et al. , 1993). Release of N
2O in the atmosphere is a microorganism-mediated process and several parameters like soil organic matter, temperature, forms of inorganic N (NO
3-N and NH
4-N) influence N
2O emission from soil. Soil organic matter acts as a carbon source for the soil microorganisms and an optimum temperature is required for maximum activity of these microorganisms (Sahrawat and Keeney, 1986). Nitrous oxide is generated due to both nitrification and denitrification in soil, and during these processes, microorganisms use NH
4+and NO
3-ions as initial substrates, respectively. Urea is the major nitrogen fertilizer applied in today’s agriculture and dissolution of urea releases both NH
4+and NO
3-ions in soil solution (Biswas and Mukherjee, 2000). Therefore, application of N fertilizer to the agricultural field is one of the primary sources of N
2O and emission of this gas due to N fertilization may be estimated 0.01-6.84%
of the applied fertilizers (Eichner, 1990).
In order to provide an estimate of current rates and to assess change in N
2O emissions, one of the obligations of signatory states to the United Nations Framework Convention on Climate Change (UNFCCC) is to establish
a national emission inventory that fully reports all anthropogenic sources of greenhouse gases, using complete methodologies.
In this study, the protocol of Intergovernmental Panel on Climate Change (IPCC, 1997) was modified to determine the inventory of N
2O emission from agricultural field as affected by different doses of N fertilizer. Among different vegetables, Chinese cabbage and red pepper, were selected as the study crop for this experiment. In case of vegetable cultivation in upland soil, N application rate was decided before only considering crop productivity. During this experiment, Chinese cabbage and red pepper were cultivated under optimum condition required for their growth, except the dose of N-fertilizer. For each crop, three doses of N-fertilizer [recommended dose (RD) and half and double of RD] were applied in soil to study their effect on N
2O gas emission and crop production and also to standardize the optimum N-fertilizer dose for these two crops. The objective of this study was to standardize the optimum N-fertilizer dose during upland cultivation of different vegetables in summer and fall (autumn) seasons through N
2O inventory methodology.
Materials and Methods
Experiment set up
The experiment was conducted at the Research Farm of Chungcheongnam-do Agricultural Research and Extension Services on 2010. Soils of this region belong to Yesan series having coarse loamy and mesic family of Dystrudepts (Red-Yellow soils, Table 1).
Parameter Crop plants
Chinese cabbage Red pepper
Soil properties
pH (1:5, H2O)
Electrical conductivity (dS/m) Organic matter (g/kg) Available P2O5 (mg/ kg)
Exchangeable cations (cmol+/ kg) K
Ca Mg
6.9 0.41 27 406 0.56 6.8 1.1
6.8 0.37 18 283 0.61 6.7 1.2
Cultivation background
Transplanting date
Transplanting interval (cm)
Recommending fertilization (kg/ ha) N
P2O5
K2O Compost Harvesting date
September 15 65×40 320 78 198 15,000 November 25
May 24 100×30 190 112 149 20,000
August 4, 12, 20, 30 Table 1. Characteristics of soil used for the field tests, and cultivation background of two vegetables
Climate condition
Cultivation period (day) Mean soil temperature (oC) Cumulative air temperature (oC) Mean soil moisture content (%) Total rainfall (mm)
77 15.1 1124 22.6 262
130 27.3 3484 18.8 739
Among the tested crops (Red pepper and Chinese cabbage), red pepper was cultivated in summer season, while Chinese cabbage was grown during fall (autumn) season. Information about cultivation background was presented in Table 1. During this study, compost was applied at 15 t/ ha and 20 t/ ha in each plot of Chinese cabbage and red pepper fields, respectively. The N content of compost was 1.17 g/kg; however, the effect of N application through compost could be nullified as it was applied in each treatment plot. The recommended chemical fertilizers for these crops are N-P
2O
5-K
2O =320-78- 198 kg/ haand 190-112-149 kg/ ha, respectively. In this experiment, plant nutrients (N, P
2O
5and K
2O) were supplied using urea, superphosphate and potassium chloride, respectively. The basal chemical fertilizers (N-P
2O
5-K
2O = 110-78-110 and 103-112-91 kg/ ha) were applied by broadcasting before transplantation of Chinese cabbage and red pepper, respectively. The remaining portions of N and K
2O were split as three side-dressing doses: in case of Chinese cabbage, split fertilizers were applied on 1
stOctober (70-0 kg/ ha), 15
thOctober (70-44 kg/ ha) and 30
thOctober (70-44 kg/ ha), while split doses were applied on 24
thJune (29-19 kg/
ha), 26
thJuly (29-19 kg/ ha) and 25
thAugust (29-20 kg/ ha) for red pepper.All matured red pepper fruits were harvested (plucked) on 4th, 12th, 20th and 30th August following standard protocol, while Chinese cabbage was harvested on 25th November.
Nitrous oxide gas sampling and analysis
A closed-chamber method was used to estimate periodical N
2O emissions as well as total N
2O fluxes throughout the cultivation duration (Rolston, 1986).
Three chambers were placed in each plot to collect the gas samples for N
2O analysis. The air gas samples from PVC chamber (diameter 27 cm and height 50 cm) were collected twice a week by air tight syringes 30 minutes after closing the lid of the chamber in each plot; however, the chamber was kept open except sampling time. Before starting the experiment, gas samples were collected after 15, 30, 45 and 60 minutes of closing the gas chamber to check the linearity and standardized that 30 minutes is the most optimum
time to collect gas samples for studying greenhouse gas emission from soil. Gas samplings throughout the study period were conducted within 11:00-13:00 hours, since the daily mean N
2O emission was recorded within this time of a day (Buendia et al. , 1997). Nitrous oxide concentrations were determined with gas chromatography equipped with
63Ni electron capture detector (ECD).
The temperature of column, injection and detector were adjusted at 65°C, 150°C and 300°C, respectively with a carrier gas flow rate of 60m/min and 1 ml of gas sample was injected during analysis.
Estimation of nitrous oxide emissions
The rates of N
2O emission from soil were estimated by calculating the increase in N
2O concentration per unit surface area of the chamber in a specific time intervals. The closed-chamber equation was used to estimate N
2O flux from each treatment (Rolston, 1986):
F = ρ × (V/A) × (∆c/∆t) × (273/T)
where, F was the N
2O flux (μg N
2O/ m
2/ hr); ρ was the gas density of N
2O under standardized state;
mg/ cm
3; V was the volume of chamber (m
3); ‘A’
indicated the area from which N
2O emitted into the chamber (m
2); ∆c/∆t = rate of accumulation of N
2O gas concentration in the chamber (mg/ m
3/ hr) and T was the absolute temperature [273+mean temperature in chamber (C)]. Total N
2O flux for the entire crop period was computed by the formula (Singh et al. , 1999); Total N
2O flux = ∑
in(R
ix D
i), where R
iwas the rate of N
2O flux (g/ m
2/d) in the i
thsampling interval, D
iwas the number of days in the i
thsampling interval, while ‘n’ was the number of sampling intervals.
Soil properties and statistical analyses
Soil temperature and moisture contents were recorded
during every gas sample collections. Soil samples were
collected from the surface layer (0-15 cm depth). The
samples were air-dried, sieved (<2 mm) and analyzed
for pH (1: 5 water extraction), organic matter content
(Allison, 1965), exchangeable Ca
2+, Mg
2+, and K
+(1 M NH
4-
acetate extract at pH 7.0, atomic absorption spectrophotometer,
Shimadzu 660), inorganic NO
3-N and NH
4-N (2M KCl
extraction, Automatic analyzer, FIAstar 5000), available
phosphate content using Lancaster method (Jackson, 1973; RDA, 1988).
N
2O emission inventory
The major potential sources of N
2O emission in arable soils are the N supplied for optimum plant growth.
Therefore, N
2O inventory correlating total N
2O flux will provide the optimum N dose for sustainable crop production with reduced N
2O emission. Following the methodology described by Intergovernmental Panel on Climate Change (IPCC, 2006), the direct N
2O emission (N
2O
Direct) could be explained by equation:
N
2O
Direct≈(F
SN+ F
ON)
ix EF
i+ (F
CR+ F
SOM) x EF
2+
F
OS+ F
PRP…….. (i)
In case of intensively managed upland cropping system, except synthetic N-fertilizers (F
SN) and applied compost (F
ON), the effects of other parameters like crop rotation (F
CR), N mineralization due to changes in land management practices (F
SOM) and effect of organic soil (F
OS) and animal grazing (F
PRP) are almost negligible. Therefore, equation (i) may be modified as
N
2O
Direct≈(F
SN+ F
ON)
ix EF
i=
F
SNx EF
i+ constant …….. (ii) Since, equal quantity compost was applied in all the treatments of same crop.
Statistical analysis
Statistical analyses were conducted using SAS software.
Rice growth and yield, soil properties and N
2O emissions data were subjected to the analysis of variance and regression. Fisher’s protected least significant difference (LSD) was calculatedat the 0.05 probability level to compare differences between treatment means.
Results and Discussion
Nitrous oxide (N
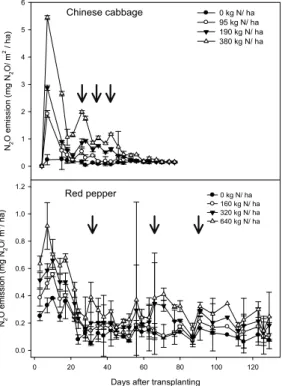
2O) emission from vegetable fields The pattern of N
2O emission during Chinese cabbage and red pepper cultivation were different, though the emission pattern for different treatments in same crop field was similar in nature (Fig. 1). Seasonal N
2O flux during cabbage and red pepper cultivation increased proportionately with increasing N-fertilizer dose (Fig.
2). In case of both Chinese cabbage and red pepper cultivations, periodical N
2O emission was increased with increasing amount of N-fertilizer, especially just after fertilizer application. Periodical N
2O emission in N-fertilizer treated plots was higher than that of control treatment. During this study, 50% of the total N dose
was applied as basal fertilizer and remaining portion of fertilizer was split in three top-dressing treatments.
The highest N
2O emission within first 10 days of cultivation, irrespective of crop type and fertilizer dose, might be attributed to the high N fertilizer application in basal dose and that was expected to release high amount of NO
3-N in soil solution. This NO
3-N acts as one of the initial substrates for N
2O formation in soil.
After initial increase, N
2O emission curve was dropped sharply and except immediately after top-dressing, N
2O emission from a particular vegetable crop field as affected by different treatments did not differ significantly.
Results indicated that higher dose of N fertilizer application enhanced N
2O flux from both Chinese cabbage and red pepper field. Meng et al. (2005) also found that higher rate of chemical N fertilizer application increased the total N
2O flux in different soils. Application of chemical N fertilizer immediately releases inorganic N to the soil (Okonwu and Mensah, 2012) and that higher NO
3-N concentration in soil solution might be responsible for enhanced N
2O emission.
Days after transplanting
0 20 40 60 80 100 120
N2O emission (mg N2O/ m2/ ha) 0.0 0.2 0.4 0.6 0.8 1.0 1.2
0 kg N/ ha 160 kg N/ ha 320 kg N/ ha 640 kg N/ ha N2O emission (mg N2O/ m2 / ha)
0 1 2 3 4 5 6
0 kg N/ ha 95 kg N/ ha 190 kg N/ ha 380 kg N/ ha Chinese cabbage
Red pepper
Days after transplanting
0 20 40 60 80 100 120
N2O emission (mg N2O/ m2/ ha) 0.0 0.2 0.4 0.6 0.8 1.0 1.2
0 kg N/ ha 160 kg N/ ha 320 kg N/ ha 640 kg N/ ha N2O emission (mg N2O/ m2 / ha)
0 1 2 3 4 5 6
0 kg N/ ha 95 kg N/ ha 190 kg N/ ha 380 kg N/ ha Chinese cabbage
Red pepper
Fig. 1. Changes of N2O emission rates in upland soils amended different rates of nitrogen fertilizer during two crop plant cultivations.
(Note: ↓ indicates days of fertilizer application for side-dressing)
Cabbage: Y=1.307+0.017X, R2=0.995***
0 100 200 300 400 500 600 Seasonal N2O flux (kg N2O-N/ ha)
0 2 4 6 8 10 12
14 Red pepper: Y=2.795+0.010X, R2=0.987***
Nitrogen fertilization (kg N/ ha)
0 50 100 150 200 250 300 350
Fig. 2. Responses of seasonal N2O emission fluxes to nitrogen application rates in upland soils during two vegetable cultivations.
N
2O emission inventory
Equation (ii) resembled with typical straight line equation (y = mx + c), and comparison of seasonal N
2O emissions with different N treatments gave the measure of emission factor (EF) for a particular agro-ecosystem.
The values of EF were expressed as kg N
2O gas emitted due to application of unit kg N fertilizer. Data indicated that seasonal N
2O flux for unit amount of N fertilizer application from cabbage field (0.017 kg N
2O/ kg N fertilizer) was comparatively higher than that of red pepper field (0.010 kg N
2O/ kg N fertilizer), so it suggested that 1.7% of the applied N fertilizer was lost as N
2O during Chinese cabbage cultivation, while it was 1.0% in case of red pepper. As mentioned in Table 1, Chinese cabbage is comparatively short-duration vegetable crop and high dose of N fertilizer is applied in soil to obtain desired crop yield. Therefore, higher N
2O emission from Chinese cabbage field might be attributed to the higher N dose applied during Chinese cabbage cultivation and almost 70% higher N
2O emission per unit N application was recorded due to increasing fertilizer application rate above the recommended dose.
Data indicated that Chinese cabbage cultivation in upland soil favoured N
2O emission as compared to red pepper.
These results also supported the finding of Hideyuki and Tooru (2001), who proposed that total N
2O flux from cabbage cultivated plots was comparatively higher than that of other vegetable plots.
N
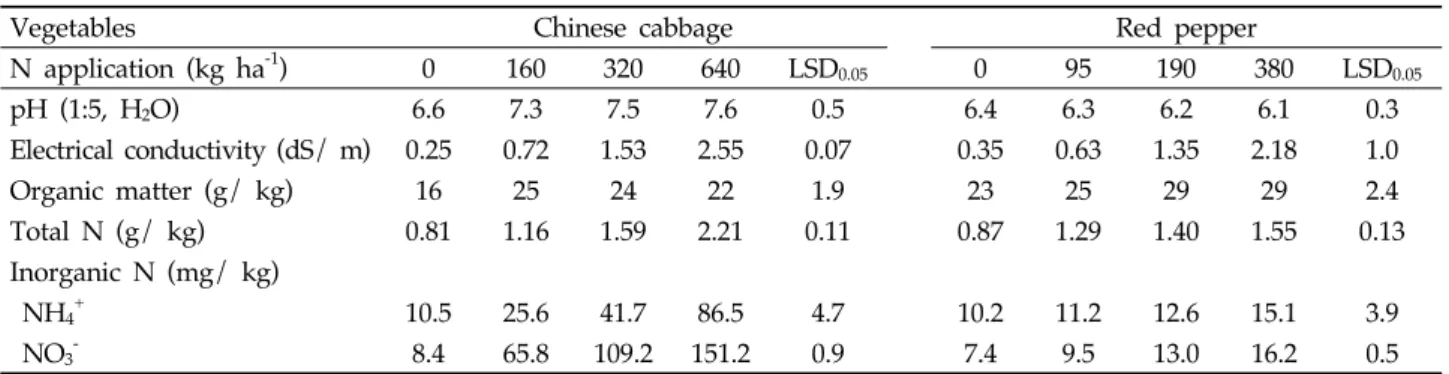
2O emission and soil properties
Electrical conductivity and both NH
4-N and NO
3-N concentrations of soil were steadily increased with increasing rate of N-fertilizer application (Table 2).
Comparatively higher N-fertilizer application during cabbage cultivation may be attributed to the drastic increase in soil NO
3-N content of these plots, and that in turn increased the emission of N
2O gas through both nitrification and denitrification processes. These are microorganism-mediated processes and NH
4-N and NO
3-N are used as initial substrates by specific group soil microorganisms during these processes, respectively (Klemdtsson et al. , 1988). Higher correlation coefficient (Table 3) of N
2O flux with inorganic N-fractions (NH
4-N and NO
3-N) also confirmed that rate of N
2O emission was strongly dependent on the concentrations of these two forms of inorganic N. Values of these correlation coefficients were comparatively higher for red pepper cultivated plots than those of cabbage cultivation. In this experiment, red pepper was cultivated during warm summer (May 24 to August 30) while Chinese cabbage was cultivated in fall (autumn) season (September 15 to November 25). Calculation of mean soil temperature as the ratio of cumulative soil temperature and total cultivation duration (Table 1) indicated that mean soil temperature of red pepper field (27.3
oC) was almost double of that for cabbage field soil (15.1
oC).
Therefore, the favourable soil temperature of pepper field might have hastened the rate of organic matter mineralization. Red pepper cultivation favoured organic C accumulation in soil as compared to Chinese cabbage.
Application of N fertilizers increased organic C content in upland soil, however, the difference among different fertilizer applied soils were not statistically significant.
Comparatively higher correlation of N
2O emission
flux with soil organic matter in red pepper field may
also be attributed to the comparatively faster organic
matter decomposition under favourable soil temperature
which in turn influenced rate of N
2O emission
possibly by activating soil microorganisms.
Vegetables Chinese cabbage Red pepper
N application (kg ha-1) 0 160 320 640 LSD0.05 0 95 190 380 LSD0.05
pH (1:5, H2O) 6.6 7.3 7.5 7.6 0.5 6.4 6.3 6.2 6.1 0.3
Electrical conductivity (dS/ m) 0.25 0.72 1.53 2.55 0.07 0.35 0.63 1.35 2.18 1.0
Organic matter (g/ kg) 16 25 24 22 1.9 23 25 29 29 2.4
Total N (g/ kg) 0.81 1.16 1.59 2.21 0.11 0.87 1.29 1.40 1.55 0.13
Inorganic N (mg/ kg) NH4+
10.5 25.6 41.7 86.5 4.7 10.2 11.2 12.6 15.1 3.9
NO3- 8.4 65.8 109.2 151.2 0.9 7.4 9.5 13.0 16.2 0.5
Table 2. Chemical properties of upland soils amended with different rates of nitrogen fertilizer at the harvesting stage
Parameter Vegetables
Chinese cabbage Red pepper Soil pH
Electrical conductivity Organic matter Total N Inorganic NH4-N Inorganic NO-N
0.844*
0.996**
0.424 0.820*
0.631 0.768*
0.585 0.992**
0.885*
0.841*
0.868*
0.877*
* and ** indicate significance at 5 and 1% confidence.
Table 3. Correlation coefficients between N2O emission flux and soil characteristics in upland soils amended with different rates of nitrogen fertilizer
N
2O emission and vegetable yield properties
Yields of both cabbage and red pepper were increased due to increasing dose of N-fertilizer (Fig. 3), though the rate of increase in crop yield was varied among treatments.
Total yields of Chinese cabbage and red pepper were increased linearly with increasing amount of N-fertilizer up to recommended dose. But the yield curve was flattened due to increasing N-fertilizer application above recommended dose. Application of higher N fertilizer increased both crop yield and N
2O flux during cultivation. During this experiment, N
2O flux per unit yield parameter was used as an indicator to standardize the optimum N fertilizer dose during Chinese cabbage and red pepper cultivation in upland soils. Nayak et al. , (2006) introduced CH
4emission per unit grain yield for explaining the treatment efficiency to increase rice productivity and also to suppress CH
4emission. In this experiment, N
2O flux per unit yield was calculated as the ratio of seasonal N
2O flux to the total yield of cabbage or red pepper. Data indicated that the values of N
2O flux per unit yield did not vary due to increasing N-fertilizer dose up to the recommended dose i.e., increasing N fertilizer application up to the recommended dose for Chinese cabbage or red pepper did not affect the magnitude of N
2O flux per yield, though it steadily increased total crop yield. But N
2O flux per unit yield was sharply increased by
increasing N-fertilizer dose beyond recommended dose.
Therefore, N-fertilization following the recommended dose is possibly the most environment-friendly practice to obtain maximum vegetable production for both summer and fall (autumn) vegetable crops.
Y=17125+235.2X-0.210X2, R2=0.988***
0 150 300 450 600
Yield (kg/ ha)
15000 30000 45000 60000 75000 90000
Chinese cabbage
Y=4633+20.3X-0.032X2, R2=0.997***
N fertilization (kg/ ha)
0 70 140 210 280 350
Yield (kg/ ha)
4000 5000 6000 7000 8000 Red pepper
Fig. 3. Yield responses of two vegetables to different nitrogen application rates in upland soils.
Chinese cabbage
N fertilization level (kg/ ha)
0 200 400 600
N2O flux per yield (g N2O-N/ Mg) 80 100 120 140 160
Y=88.5-0.0966X+0.0003X2, R2=0.991***
Red pepper
0 100 200 300 400
500 600 700 800 900 Y=580+0.1527X+0.0014X2, R2=0.963***
Fig. 4. Changes of N2O flux per each vegetable yield at different nitrogen application rates in upland soils.