ORIGINAL ARTICLE
Interannual Variability of Common Squid Fishing Ground in the East Sea derived from Satellite and In-situ Data
Sang-Woo Kim, Ji-Suk Ahn
1)*, Jin-Wook Lim, Hee-Dong Jeong, Jong-Hwa Park
Fisheries Resources and Environment Division, East Sea Fisheries Research Institute, Gangwon-Do, 210-861, Korea
1)Fishery and Ocean Information Division, NFRDI, Busan, 619-705
Abstract
In this study, we estimate the interannual spatial and temporal distributions of fishing grounds at night in the East Sea based on satellite and in-situ data. We observe that the 15℃ thermal front moves in the north-south direction according to the movement of the warm water (above 18℃) in the Tsushima Warm Current (TWC) area, forcing the cold water area (below 10℃) to either expand or shrink. The interannual variations of sea surface temperature (SST) in winter represented by the indicator SST of 6℃ are consistent with the east-west zonal areas in the central East Sea which represented over 1℃ standard deviation of SST in February during 1990-2000. Annual SST in the fishing grounds of common squid fishing vessels, observed both by fishing vessels and satellites range from 9-22℃, with the satellite-observed data having a larger range than the fishing vessel-based ones. The interannual distributions of the common squid fishing grounds in the East Sea are mostly concentrated in the TWC area in the southwestern part of the East Sea and in the coast of southern Honshu and Hokkaido in Japan. The interannual distributions of the nighttime fishing vessels are consistent with the catches investigated from the fishing vessel.
Key words : Interannual variability, East Sea, Squid fishing ground, SST, Satellite data
1. Introduction
1)The East Sea is commonly known as a miniature ocean as it mimics features found in larger oceans. In the middle part of this area, a thermal front is formed when the Tsushima Warm Current (TWC), which originates in the southern part, and transports warm salty water into the basin through the Korean Strait, meets the North Korea Cold Current (NKCC), which transports cold fresh water. The thermal front in the central East Sea highly variable, play an important role in creating a good fishing ground and migratory route for fishes like squid, saury, and mackerel (An et al., 1994; Kim et al., 2000; Kim et al., 2002).
Due to the effects of accelerating climate change, the East Sea has gradually been turning subtropical.
Temperature rise, one of the potential effects of climate change, has continuously brought subtropical aquatic organisms like the yellow ray and octopus into the East Sea. An increase in the number of warm jellyfish has caused damages to the fishery industry as well. In addition, temperature rise has caused changes in the stocks at the fisheries. While walleye pollack, a common cold water species in the 1960s and 70s has, mostly vanished, the common squid, a warm water species, is now mainly caught in the East Sea. Due to the limitations of in-situ boat surveys, studies on the long-term temporal and spatial variability
Received 4 October, 2013; Revised 21 October, 2013;
Accepted 22 October, 2013
*Corresponding author : Ji-Suk Ahn, Fishery and Ocean Information Division, NFRDI, Busan, 619-705
Phone: +82-51-720-2226 E-mail: [email protected]
ⓒ The Korean Environmental Sciences Society. All rights reserved.
This is an Open-Access article distributed under the terms of the Creative Commons Attribution Non-Commercial License (http://
creativecommons.org/licenses/by-nc/3.0) which permits unrestricted non-commercial use, distribution, and reproduction in any medium, provided the original work is properly cited.
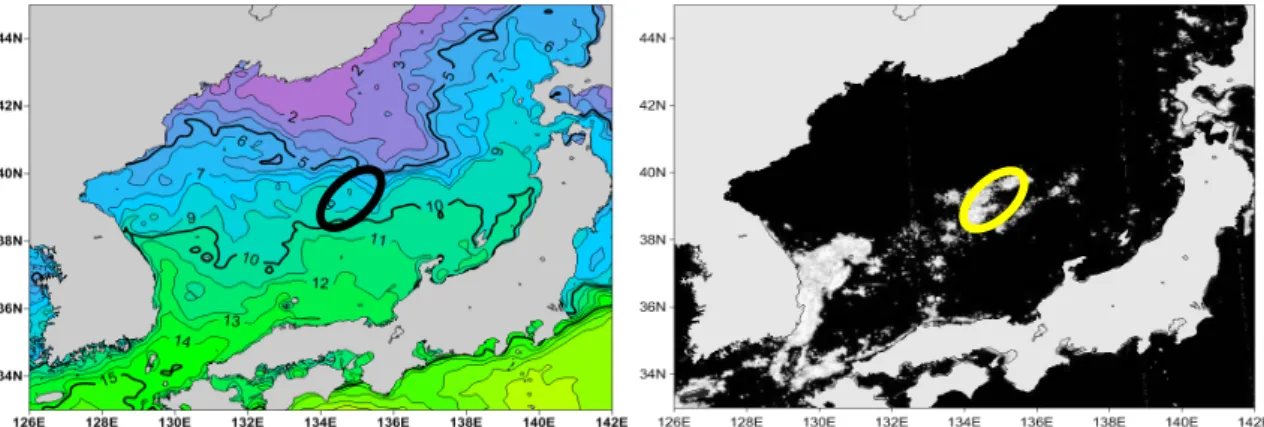
Fig. 1. NOAA/MCSST (left) and DMSP/OLS (right) images in the East Sea between 33‑45°N in latitude and 126‑142°E in longitude. The ellipse area indicates the Yamato Ridge.
of sea temperature are mostly based on satellite tools that are able to conduct several observations per day and thus considered as both economic and convenient.
Sea surface temperature (SST) data derived from NOAA AVHRR (Advanced Very High Resolution Radiometer), used for measuring the temporal and spatial variability of the water temperature, have frequently been used to monitor the coastal upwelling, which occurs every year in the southern East Sea (Suh et al., 2001; Lee et al., 2003; Kim et al., 2010), and variability of the Eastern Korean Warm Current (Isoda and Saitoh: 1988, Isoda et al., 1991). Being highly sensitive to temperature, the common squid, one of the major species in the East Sea as well pelagic fishes like saury can provide important physical oceanographic data to analyze the relationship of the SST images to these species.
The common squid is a major commercial species in the East Sea. Though it is being increasingly caught by trawls, it is mostly c aught at night by it jigging vessels, since this species is attracted to lights (Sakurai et al., 2000; Cho et al., 2004). The Defense Meteorological Satellite Program (DMSP) Operational Linescan System (OLS) sensor can effectively detects light emissions from squid vessels (Elvidge et al., 1999; Cho et al., 1999; Kiyofuji et al., 2001; Kim, 2002). Previous studies on the temporal analysis of
fishing conditions for common squid were mostly based on long-term oceanic conditions and catch data and those on the spatial distributions of the fishing grounds for common squid focused on monthly variabilities of the fishing grounds (Kiyofuji et al, 2001; Kim, 2002; Cho et al., 2004; Choi et al., 2008).
However, there are relatively few studies on the interannual variabilities of the fishing grounds.
For this study analysis of interannual oceanographic conditions in the East Sea utilizing SST derived from the NOAA satellite was carried out. Then, a combined analysis of in-situ squid catch data, SST images and DMSP/OLS nighttime visible band images was carried out to analyze the interannual temporal and spatial variabilities of the nighttime fishing grounds for common squid.
2. Materials and methods
In order to analyze the temporal and spatial
distributions of nighttime squid fishing boats in the
East Sea, we utilized interannual means of daily
DMSP/OLS visible band images during 1993-2000 in
areas bounded by the 33-45°N latitude and the
126-142°E longitude provided by the National
Geophysical Data Center, NOAA (Fig. 1). SST images
were obtained from annual means of daily Multi-
126E 128E 130E 132E 134E 136E 138E 140E 142E 34N
36N 38N 40N 42N
44N SST AVG (1990-2000)
126E 128E 130E 132E 134E 136E 138E 140E 142E 34N
36N 38N 40N 42N
44N SST STD (1990-2000)
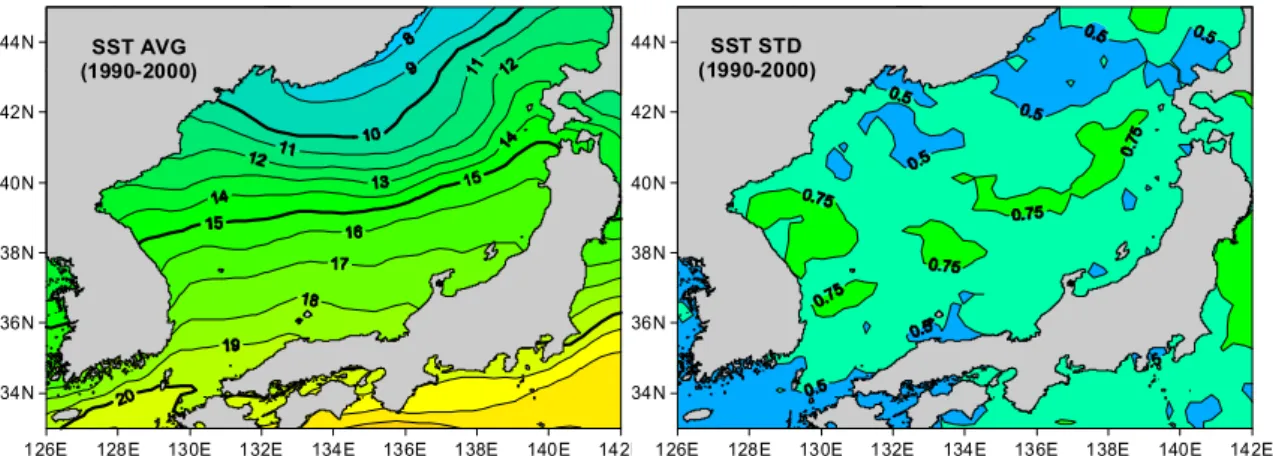
Fig. 2. Horizontal distribution of yearly mean and standard deviation of sea surface temperature(SST, ℃) from 1990 to 2000.
Channel Sea Surface Temperature (MCSST) for 11 years (1990-2000) based on NOAA AVHRR band 4 and 5 which were directly received by the National Fisheries Research & Development Institute (NFRDI) of Korea (McClain et al., 1985). Although we analysed the MCSST images for the same years as those for which DMSP/OLS images were obtained, we calculated mean and standard deviation from the MCSST images for the 11 years (1993-2000) to determine average variations of the oceanic conditions in the East Sea. SST anomalies were also calculated by subtracting the mean from the annual SST to identify interannual SST variations.
Coastal and offshore jigging fishery data grids (0.5°. latitude×0.5°. longitude) were obtained from the Fishing Conditions Survey Periodicals (NFRDI, 1993- 2000), published by the NFRDI, to analyze the catched of common squid.
3. Results and discussion
3.1. Temporal and spatial distributions of SST The yearly mean and standard deviations of SST in the East Sea during 1990-2000 are illustrated in Fig.
2. The mean SST ranges from 8-20℃ with the 15℃
thermal front forming in the 38-41°N area. The warm water with temperatures above 18℃ and flowing
from the Korean Strait was located south of the front, while the cold water below 10℃ was located north of the front. This showed a strong SST slope from north to south. The standard deviation of SST was derived as over 0.5℃ for the entire East Sea except for the south of the Korean Strait and north of 42°N. In particular, it was relatively higher over 0.75℃ in the central East Sea where the thermal front crossed the east-west direction.
With the movement of the north-south of the 15℃
thermal front, the interannual distribution of SST showed a steep slope north of the front (Fig. 3). This can be explained by the fact that the warm water over 18℃ from the TWC in the southern East Sea forced the thermal front to move north-south and the thermal front which was now running north caused the cold water below 10℃ in the north East Sea to either expand or shrink, causing a steeper slope in the SST as compared to the south East Sea. The movement of the front resulted in large meandering in the east-west direction, which showed an irregular pattern every year with large vertical fluctuations (Isoda et al., 1991; Choi et al., 1993).
In order to obtain a detailed understanding of the
spatial variations of the warm and cold water, we
drew 6℃ and 25℃ fronts, representing winter and
summer, respectively (Fig. 4). A SST of 6℃ has been
Fig. 3. Yearly mean SST images in the East Sea from 1990 to 2000.
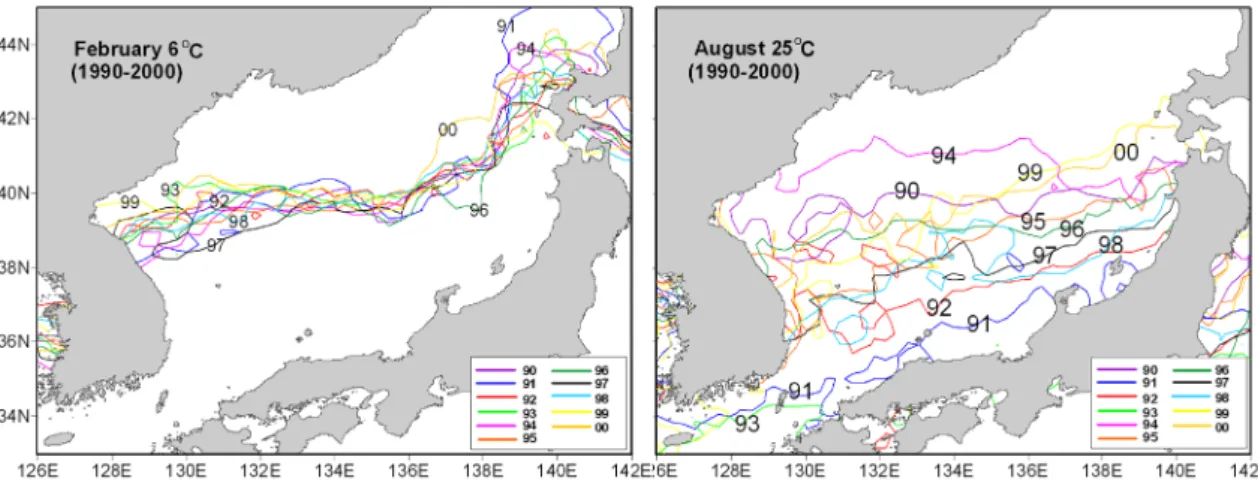
suggested as an indicator SST for the thermal front in winter by Choi et al.(1993). The interannual variations of SST of 6℃ for winter was distributed in a range of 2-3 degrees in latitude near the coasts of Korea and Hokkaido in Japan. The area in between the coast of Korea and Hokkaido had a narrow range of 1 degree of latitude for the SST distribution. Isoda (1994) has
suggested that the decadal variability of the thermal
front correlated with the TWC while the 2-4 year
long-term variability was influenced by the Asia
winter monsoon. Areas showing over 1℃ standard
deviation of SST as shown in Fig. 5 are quite
consistent with those subject to the horizontal and
vertical movement of the thermal front. It means that
Fig. 4. Interannual variations of SST derived from satellite data in February (left) and August (right) from 1990 to 2000.
Contour lines indicate the isothermal of 6℃ in February and 25℃ in August.
Fig. 5. Horizontal distributions of standard deviation of SST in February (left) and August (right) from 1990 to 2000.
data on the movement of the front can serve as an important source to estimate the strength of the TWC.
The SST of 25℃ for summer showed large interannual variations in the entire East Sea, ranging from 34°N in the south to 40°N in the north. The interannual variations showed the largest latitudinal fluctuation during 1993-1994. The isotherm of the SST of 25℃ in 1993 reached Tsushima Island near 34°N, the southernmost of the range while the one in 1994 formed near 40°N, which is the northernmost.
The largest spatial variations in SST in summer were
observed during the same period in this study. The result that the variations in summer SST were higher than those in winter is related to the variations in strength of the TWC, and the large distributions of the summer SST's are coincide with the areas having over 1.5℃ standard deviation of SST in August as shown in Fig 5.
3.2. Distributions of SST, squid catches and nighttime fishing vessels
SST, squid catches and DMSP OLS nighttime fishing
Fig. 6. Yearly mean distributions of SST(℃, isothermal lines), catch of common squid (M/T), and nighttime fishing boats (white color) from 1993 to 2000.
vessels are shown in Fig. 6. Here, the SST is expressed as contour lines derived from the data in Fig. 3, the squid catches as circles and the nighttime fishing vessels are the white color in the images.
Yearly distributions of SST in the fishing areas where common squid fishing vessels operate derived from in-situ data and satellite images as shown in Fig.
6 are tabulated in Table 1. Our analysis reveals that the SST in the East Sea where the catches were distributed ranged from 11-21℃ while those in the area where the nighttime fishing vessels were distributed ranged from 9-22℃, which shows a wider range than the catch area. Among the 8 survey years from 1993 to 2000, the year 1998 had the widest SST range of 9-22℃.
Table 1. Yearly SST observed both by fishing boats and DMSP/OLS images
Years In-situ fishing boats
Fishing boats derived from DMSP/OLS satellite
1993 14‑21℃ 11‑20℃
1994 14‑21℃ 11‑21℃
1995 13‑19℃ 10‑21℃
1996 11‑19℃ 9‑21℃
1997 12‑20℃ 10‑21℃
1998 15‑21℃ 9‑22℃
1999 13‑21℃ 9‑21℃
2000 13‑19℃ 10‑21℃
Range 11‑21℃ 9‑22℃