로스팅 조건에 따른 브라질산 Coffea arabica cv. Catuai 커피의 이화학적 특성
김은경1*․정윤화2,3*․구선영2,3․송가영3․김인용3․김기영1
1경기대학교 관광전문대학원 외식산업경영학과
2단국대학교 식품영양학과
3천연물식의약소재산업화연구센터
Physicochemical Characteristics of Brazilian Coffea arabica cv. Catuai Coffee Extracts with Different Roasting Conditions
Eunkyung Kim1*, Yoonhwa Jeong2,3*, Sunyoung Gu2,3, Ka-Young Song3, Inyong Kim3, and Ki-Young Kim1
1Department of Food Service Industry Management, Graduate School of Tourism Business Management, Kyonggi University
2Department of Food Science and Nutrition and
3Research Center for Industrialization of Natural Neutralization, Dankook University
ABSTRACT This study was conducted to investigate the physicochemical characteristics of Brazilian Coffea arabica cv. Catuai from extracts (espresso and drip) with different roasting conditions. Green coffee beans were roasted under four different conditions, light medium, medium, moderately dark, and very dark. The contents of titratable acidity, reducing sugar, and organic acids decreased as roasting degree increased, while the pH and contents of total dissolved solids increased in coffee extracts. Lightness (L*) decreased as roasting degree increased for both coffee beans and extracts. Caffeine contents increased to moderately dark, then decreased at very dark in the coffee extracts. Chlorogenic acid contents decreased as roasting degree increased in coffee extracts. Contents of organic acids such as citric acid, malic acid, and oxalic acid decreased as roasting degree increased; however, lactic acid levels did not differ significantly with roasting conditions.
Key words: Coffea arabica cv. Catuai, coffee, roasting, extraction, physicochemical characteristics
Received 7 May 2019; Accepted 4 June 2019
Corresponding authors: Ki-Young Kim, Department of Food Service Industry Management, Kyonggi University, Seoul 03746, Korea E-mail: [email protected], Phone: +82-2-390-5122
*These authors contributed equally to this work.
Author information: Eunkyung Kim (Graduate student), Yoonhwa Jeong (Professor), Sunyoung Gu (Graduate student), Ka-Young Song (Professor), Inyong Kim (Professor), Ki-Young Kim (Professor)
서 론
커피는 볶은 커피콩 가루를 따뜻한 물이나 차가운 물 또는 증기로 우려내어 마시는 음료로써 세계에서 가장 많이 소비 되는 음료 중 하나이다(Villanueva 등, 2006). 세계 커피 시장 규모는 2015년 기준 1,256억 달러였으며, 2020년에 는 1,680억 달러의 시장을 형성할 것으로 전망되고 있다 (Korea Agro-Fisheries and Food Trade Corporation, 2016). 커피의 주요 생산 국가로는 브라질이 세계 생산량의 총 32%를 차지하고 있으며, 베트남, 콜롬비아, 인도네시아, 온두라스 등이 있다(ICO, 2019). 커피 소비인구는 중국 및
인도 등의 대인구국의 경제성장으로 점차 증가하는 추세이 며, 지난 10년간 세계 커피 소비량은 큰 폭으로 상승해왔다 (USDA, 2017). 우리나라 커피 시장은 2017년 기준 11.7조 원으로 2007년 3.5조 원에 비해 3배 성장하였으며, 세계 10위권의 시장 규모로 10조 원을 돌파하였다(Korea Agro- Fisheries and Food Trade Corporation, 2016).
커피의 품종은 Coffea arabica(Arabica종), Coffea can- ephora(Robusta종), Coffea liberica(Liberica종) 세 품종 으로 구분되며, Arabica종과 Robusta종이 전 세계 산출량의 대부분을 차지하고 있다. Arabica종의 주요 생산지는 남아 메리카(주로 브라질)와 동아프리카의 고산지대이며, Rob- usta종은 중앙아프리카, 서아프리카 및 동남아시아(주로 베 트남)의 저지대이다(Jeszka-Skowron 등, 2016). Arabica 종은 향과 맛이 좋아 최고의 품질로 인정받고 있으며, Rob- usta종은 재배가 용이하나 전반적인 커피 품질이 낮고 카페 인 함유량이 Arabica종보다는 다소 높다(Jo 등, 2016).
Arabica종과 Robusta종의 생산 비중은 약 6:4 정도이다 (ICO, 2019).
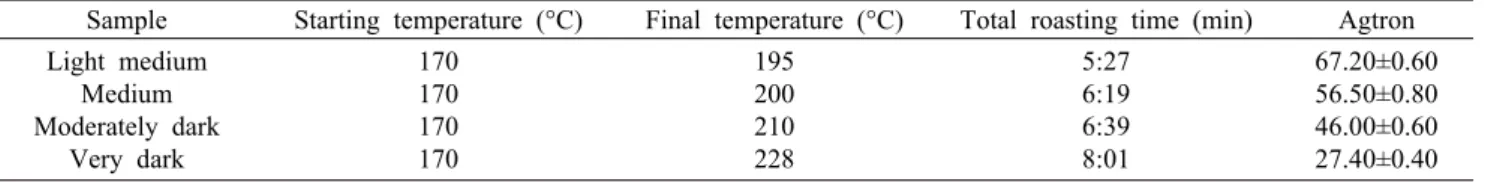
Table 1. Roasting conditions for the four roasting profiles
Sample Starting temperature (°C) Final temperature (°C) Total roasting time (min) Agtron Light medium
Medium Moderately dark
Very dark
170 170 170 170
195 200 210 228
5:27 6:19 6:39 8:01
67.20±0.60 56.50±0.80 46.00±0.60 27.40±0.40 로스팅은 생두 가열 시 갈변 반응을 일으키며 새로운 향미
를 만드는 과정으로 로스팅이 길어질수록 원두의 색이 진해 지고 크기가 커지며, 마이야르 반응 및 캐러멜화 등 여러 반응들이 발생한다(Mottram, 2007). 로스팅에 영향을 주는 요인으로는 가열온도, 가열시간 및 공기의 흐름 등이 있으며 (Lee, 2012), 이들의 변화로 커피의 항산화력이 달라진다는 연구보고가 있다(Kwak 등, 2017). 로스팅의 결과는 갈변 정도에 따라 구분되며 시나몬, 미디움, 다크, 풀시티, 이탈리 안, 프렌치 등이 있다(The Specialty Coffee Association, 2019). 로스팅이 진행될수록 신맛이 적어지고 단맛 및 향미 가 강화되며, 강하게 로스팅되면 쓴맛이 강해진다(de Az- eredo, 2011). 로스팅은 커피의 품질을 결정짓는 중요한 인 자로 커피 특유의 색과 향, 맛을 생성하는 중요한 과정이다 (Yoo, 2013).
커피의 로스팅 및 이화학적 특성 관련 연구로는 로스팅 조건에 따른 탈지 팜 시드 커피 추출액의 이화학적 특성 (Fikry 등, 2019), 콜롬비아산 생두의 가공법 및 로스팅에 따른 품질 특성(Ko 등, 2017), 로스팅 조건 변화에 따른 커 피 추출액의 화학성분 및 관능 특성(Kim과 Kim, 2017), 커 피의 로스팅 조건에 따른 이화학적 성분 및 관능 특성(Kim 등, 2016), 분쇄도 및 로스팅 조건이 수프리모 커피의 이화 학적 특성에 미치는 영향(Kang 등, 2015), 대륙별 원두의 로스팅에 따른 관능적 특성(Lee과 Pae, 2014), 로스팅 정도 에 따른 커피의 쓴맛 유도 화학성분 및 관능 특성(Kim과 Kim, 2014a) 등이 있다. 또한, 커피 생두에 발효 처리를 한 발효 커피(Kwak 등, 2018)와 과일액에 침지하여 커피의 맛 에 변화를 준 연구도 보고되었다(Lim 등, 2015).
본 연구에서는 세계 최대 커피 생산국인 브라질산 Coffea arabica cv. Catuai를 로스팅 조건별로 분석하여 로스팅에 따른 커피의 품질 특성 차이에 대해 알아보고자 하였다.
재료 및 방법
재료
생두는 Arabica종으로 2017년 6월에서 2018년 3월까지 수확된 Coffea arabica cv. Catuai(Cerrado/Brazil, Natural, NY2)를 모이커피컴퍼니(Yongin, Korea)에서 제공받아 사 용하였다.
로스팅
Aillio Bullet R1 Roaster(Aillio, Taipei, Taiwan)를 이
용하여 170°C로 예열된 로스터에 생두를 투입한 후, 스페셜 티 커피 협회(The Specialty Coffee Association, SCA)의 8단계 분류법을 바탕으로 light medium(Agtron 70.17~
60.36), medium(Agtron 60.07~50.00), moderately dark (Agtron 49.75~45.18), very dark(Agtron 30.07~20.50) 의 4단계로 로스팅하였다. Agtron 값은 CM-100(Light- tells, Zhubei City, Taiwan)을 이용하여 측정하였으며, 로 스팅한 원두는 사용 시까지 -18°C에서 냉동 보관하였다 (Table 1).
에스프레소 추출
에스프레소 전용 반자동 그라인더 900N(Yang-Chia Machine Works Co., Ltd., Taichung, Taiwan)을 이용하 여 입자크기 45 mesh로 분쇄한 후, 반자동 에스프레소 머신 (E98 President A2, Faema, Milano, Italy)을 이용하여 7 g을 30 mL까지 추출하였다. 에스프레소 추출액은 로스팅 강도에 따라 light medium(E1), medium(E2), moderately dark(E3) 및 very dark(E4)의 4가지 시료로 준비하였다.
드립 추출
Fuji coffee mill R-440(Fujikouki Co., Ltd., Osaka, Japan)을 이용하여 입자크기 25 mesh로 분쇄한 후 클레버 드리퍼(Mr. Clever, E.K, INT’L Co., Ltd., Taipei, Tai- wan)를 이용하여 시료 15 g을 260 mL까지 추출하였다. 드 립 추출액은 로스팅 강도에 따라 light medium(D1), me- dium(D2), moderately dark(D3) 및 very dark(D4)의 4가 지 시료로 준비하였다.
일반성분 분석
일반성분은 AOAC(2019)의 방법에 따라 수분은 상압가 열건조법, 조단백은 Micro-Kjeldahl법, 조지방은 Soxhlet 법, 조회분은 직접회화법을 이용하여 측정하였으며 백분율 로 나타내었다.
중량 손실
중량 손실은 AOAC(2019)의 방법에 따라 생두 250 g을 로스팅한 후 원두의 무게를 측정하여 다음 식에 따라 계산하 였다.
Weight loss (%)=[(Initial weight of coffee bean-
Weight of roasted coffee bean)/ Initial weight of coffee bean]×100
pH
추출액 10 g을 증류수 100 mL에 희석하여 pH meter (ORION STAR A211, Thermo Fisher Scientific, Wal- tham, MA, USA)를 이용하여 각 3회 반복 측정 후 평균값으 로 나타내었다.
가용성 고형분
추출액은 Brix meter(HI 96801, HANNA Instruments, Woonsocket, RI, USA)를 이용하여 각 3회 반복 측정하여 평균값으로 나타내었으며, 가용성 고형분(total dissolved solids; TDS)은 Luca(2008)의 방법에 따라 Brix 값에 0.85 를 곱하여 나타내었다.
총산도
총산도는 Berg(1963)의 방법을 응용하여 추출액 5 mL를 증류수 50 mL에 희석한 후 10 mL를 취하여 0.1 N NaOH 용액으로 pH 8이 될 때까지 적정하였다. 이때 소비된 NaOH 의 mL 수를 이용하여 다음 식에 따라 citric acid(%)로 환산 하여 계산하였다.
Citric acid (%)=V×F×A×D×(1/S)×100 V: 0.1 N NaOH 용액의 적정치 소비량(mL) F: 0.1 N NaOH 용액의 역가
A: 0.1 N NaOH 용액 1 mL에 상당하는 유기산(citric acid)의 양
D: 희석배수
S: 시료의 채취량(mL)
환원당
3,5-Dinitrosalicylic acid(DNS) 방법(Borel 등, 1952)에 따라 환원당 함량을 측정하였다. Sample 0.3 mL에 DNS 시 약 0.3 mL를 첨가한 후 100°C 항온수조에 5분간 넣어두었 다. 이후 증류수 0.9 mL를 넣고 15분간 실온에 방치 후 550 nm에서 흡광도를 측정하였다. Glucose(MB-G4398, Duk- san Science, Seoul, Korea)를 표준용액으로 사용하였다.
색도
색도는 분쇄 전 생두, 원두 및 추출액을 색도계(LC100, Tintometer Limited, Amesbury, UK)를 이용하여 측정하 였다. L*(명도), a*(적색도), b*(황색도) 및 ΔE(색차값)로 나 타내었으며, BI(갈색도)는 Virgen-Navarro 등(2016)의 방 법으로 계산하였다.
ΔE=
Browning index (BI)= z-0.310.17 ×100
(
z= 5.645La**+1.75L+a*-3.012b* *)
×100카페인 및 클로로겐산 분석
카페인 및 클로로겐산은 Jung 등(2017)의 방법을 응용하 여 HPLC(Ultimate 3000, Thermo Fisher Scientific)를 이 용하여 분석하였다. 추출액은 여과 후 에스프레소는 25배, 드립은 10배 희석하였다. 분석조건은 Column C18(5 µm, 4.6×150 mm), acetonitrile(mobile phase, 13% A)(75-05- 08, Burdick & Jackson, Porter, IN, USA), 0.4% H3PO4
(mobile phase, 87% B)(7664-38-2, Samchun, Pyeong- taek, Korea), mobile phase flow rate 0.5 mL/min, run- ning time 10 min, column temperature 40°C로 20 µL씩 주입하여 290 nm에서 검출하였다. 각 화합물 정량을 위해 caffeine(58-08-2, Sigma-Aldrich Co., St. Louis, MO, USA)과 chlorogenic acid(327-97-9, Sigma-Aldrich Co.) 를 구입하여 사용하였다.
유기산 분석
유기산은 Suh(2016)의 방법을 응용하여 HPLC(Ultimate 3000, Thermo Fisher Scientific)를 이용하여 분석하였다.
추출액은 여과 후 에스프레소는 25배, 드립은 10배 희석하 였다. 분석조건은 Column C18(5 µm, 4.6×150 mm), 0.1%
H3PO4(7664-38-2, Samchun), mobile phase flow rate 0.4 mL/min, running time 20 min, column temperature 30°C로 20 µL씩 주입하여 220 nm에서 검출하였다. 각 화 합물 정량을 위하여 acetic acid(64-19-7, Junsei Chemical Co., Ltd., Tokyo, Japan), citric acid(77-92-9, Junsei Chemical Co., Ltd.), lactic acid(908B 2223, Kanto, To- kyo, Japan), DL-malic acid(617-48-1, Junsei Chemical Co., Ltd.), oxalic acid(144-62-7, Junsei Chemical Co., Ltd.)를 구입하여 사용하였다.
통계처리
통계처리는 SPSS 25.0 program(SPSS Inc., Chicago, IL, USA)을 이용하여 분산분석(ANOVA)을 하였으며, Dun- can’s multiple range test에 의해 P<0.05 수준에서 유의적 인 차이를 검증하였다.
결과 및 고찰
일반성분
원두의 일반성분은 Table 2와 같다. 수분 함량은 생두가 10.01%로 가장 높았으며, 로스팅이 진행됨에 따라 light medium 2.28%에서 very dark 1.18%로 감소하였다. 조단 백 함량은 유의적인 차이가 없었다. 조지방 함량은 light medium(8.47%)< medium(9.20%)< moderately dark (13.83%)로 증가하였으며, moderately dark가 13.83%로 가장 높았다. Very dark에서는 조지방 함량이 10.56%로 감소하였다. 조회분 함량은 생두 3.78%에서 로스팅이 진행 됨에 따라 유의적으로 증가하였으며, very dark가 4.79%로
Table 2. Proximate composition of Coffea arabica cv. Catuai coffee beans from Brazil with roasting degree (%)
Properties Green bean Roasted bean
Light medium Medium Moderately dark Very dark Moisture
Crude protein Crude fat Crude ash Others1)
10.01 0.62 (0.70 2.07 (2.30 3.78 (4.20 83.52 (92.80
±0.03a2)
±0.21NS3)
±0.24NS)4)
±0.23d
±0.25d)
±0.02d
±0.02c)
±0.02b
±0.04a)
2.28 0.33 (0.35 8.47 (8.67 4.13 (4.23 84.77 (86.75
±0.08b
±0.29
±0.30)
±0.24c
±0.24c)
±0.10c
±0.10bc)
±0.50a
±0.47b)
1.75 0.50 (0.51 9.20 (9.37 4.14 (4.21 84.40 (85.90
±0.02c
±0.01
±0.00)
±0.50c
±0.51c)
±0.01c
±0.01c)
±0.52ab
±0.51b)
1.41 0.33 (0.34 13.83 (14.03 4.27 (4.33 80.16 (81.31
±0.00d
±0.29
±0.29)
±0.67a
±0.68a)
±0.02b
±0.02b)
±0.76d
±0.78d)
1.18 1.18 (1.19 10.56 (10.68 4.79 (4.85 82.30 (83.28
±0.06e
±1.16
±1.18)
±0.88b
±0.91b)
±0.07a
±0.07a)
±0.32c
±0.35c)
1)Others=100-(moisture+crude protein+crude fat+ash).
2)Means with the different letters (a-e) in same row are significantly different (P<0.05) by Duncan’s multiple range test.
3)NS: not significant.
4)Dry weight basis.
Table 3. Weight loss of Coffea arabica cv. Catuai coffee beans from Brazil with roasting degree
Properties Roasted bean
Light medium Medium Moderately dark Very dark Weight loss (%) 10.10±0.24c1) 13.49±4.94bc 15.51±0.99b 20.16±0.71a
1)Means with the different letters (a-c) in same row are significantly different (P<0.05) by Duncan’s multiple range test.
가장 높았다. 생두에는 단백질, 지질, 자당 외에 헤미셀룰로 오스, 셀룰로오스 및 클로로겐산 등의 성분이 주로 함유되어 있으며, 로스팅 과정 중 마이야르 반응, 열분해, 가수분해, 산화반응 등에 의해 지질 함량이 증가하고 헤미셀룰로오스, 셀룰로오스 및 클로로제닉산 성분은 감소하게 된다(Lee과 Pae, 2014). 생두의 적정 수분 함량은 ISO(International Standardization Organization)에서 정한 8~13%이며 이와 일치하였다(ISO, 2004; Ko 등, 2017). 원두의 수분 함량은 로스팅 초기 원두의 온도가 물의 비등점 이상으로 증가함에 따른 물의 증발에 기인한다. 첫 번째 균열이 끝나고 두 번째 균열이 시작될 때까지는 탄수화물의 열분해, 클로로겐산 및 유기산 등의 분해로 수분이 증가하다가 두 번째 균열 이후부 터 로스팅이 진행됨에 따라 수분 함량이 감소하게 된다 (Clarke과 Macrae, 1985; Ledl과 Schleicher, 1990). Vas- concelos 등(2007)의 연구에서도 로스팅이 진행됨에 따라 수분 함량이 9.4%(green bean)> 1.0%(light roast)> 0.8%
(medium roast)로 감소하였으며, 조단백 함량은 15.6%
(green bean), 14.4%(light roast), 14.5%(medium roast), 14.4%(dark roast)로 유의적인 차이가 없었다. 조지방 함량 은 8.1%(green bean)< 10.3%(light roast)< 11.4%(me- dium roast)< 12.3%(dark roast)로 로스팅이 진행됨에 따 라 증가하였다. 조회분 함량은 5.5~6.0%로 유의적인 차이 가 없었다. Kang 등(2015)의 연구에서도 로스팅 강도가 증 가함에 따라 원두의 수분 함량이 0.95~0.54%로 감소하였 고 조단백 함량은 1.32~1.60%, 조지방 함량은 19.49~
25.26%, 조회분 함량은 4.06~4.40%로 증가하여 본 연구 결과와 유사하였다.
중량 손실
로스팅 정도에 따른 원두의 중량 손실은 Table 3과 같다.
생두(0.00%)에서 10.10%(light medium)< 13.49%(medi- um)< 15.51%(moderately dark)< 20.16%(very dark)로 로스팅 강도가 증가함에 따라 중량 손실이 증가하였으며, very dark 단계까지 약 20%의 중량이 감소하였다. 이는 로 스팅에 의한 수분 손실에 의한 것으로 Suh 등(2015)의 연구 에서도 브라질산 아라비카 원두의 중량 손실이 생두(0.00%) 에서 11.20%(light), 14.50%(medium) 및 18.50%(dark)로 dark에서 약 20%의 중량 손실을 나타내어 본 연구 결과와 유사하였다.
pH
pH는 에스프레소와 드립 모두 로스팅 정도가 강해질수록 증가하였다(Table 4). 이는 Natural, Pulped 및 Washed의 pH가 로스팅이 진행됨에 따라 5.60~5.80에서 6.03~6.20 으로 증가하는 결과와 유사하였다(Ko 등, 2017). 로스팅 정 도에 따른 pH의 변화는 medium 로스팅 단계까지 formic acid, acetic acid, glycolic acid 및 lactic acid의 형성으로 감소하다가 첫 번째 균열 이후부터 유기산 등의 분해로 pH 가 급격히 증가하게 된다(Ginz 등, 2000). 커피의 산도는 품종, 재배고도, 수확 후 기간, 가공법, 배전강도 등 여러 요인의 영향을 받으며, Washed 커피는 로스팅 강도에 따라 서 4.9~5.4의 값을 가진다(Ko 등, 2017). Clarke과 Ma- crae(1988)의 연구에서 로스팅에 따른 아라비카 커피의 pH 는 5.20(210°C), 5.16(220°C), 5.10(230°C), 5.14(240°C) 였으며, Lee 등(2017)의 연구에서 240°C에서 로스팅한 아 라비카 원두의 pH는 5.80이었다. Kang 등(2015)의 연구에
Table 4. pH, °Brix, total dissolved solids, titratable acidity, and reducing sugar of Coffea arabica cv. Catuai coffee extracts from Brazil with roasting degree
Properties Espresso Drip
E1 E2 E3 E4 D1 D2 D3 D4
pH
°Brix TDS (%) TA (%) RS (mg/mL)
4.91±0.01g1) 5.83±0.06b 4.96±0.05b 0.20±0.02a 2.82±0.04a
4.99±0.02f 5.53±0.06c 4.71±0.05c 0.16±0.00b 2.64±0.09b
5.20±0.02d 5.77±0.06b 4.90±0.05b 0.12±0.02c 2.66±0.07b
5.78±0.02a 6.33±0.06a 5.39±0.05a 0.10±0.00d 2.48±0.11c
5.00±0.03f 1.70±0.00d 1.45±0.00d 0.06±0.00e 1.06±0.03d
5.15±0.02e 1.50±0.00e 1.28±0.00e 0.06±0.00e 0.84±0.05e
5.35±0.01c 1.40±0.00f 1.19±0.00f 0.06±0.01e 0.76±0.06ef
5.73±0.01b 1.40±0.00f 1.19±0.00f 0.03±0.00f 0.65±0.11f E1: light medium espresso, E2: medium espresso, E3: moderately dark espresso, E4: very dark espresso, D1: light medium drip, D2: medium drip, D3: moderately dark drip, D4: very dark drip.
TDS: total dissolved solids, TA: titratable acidity, RS: reducing sugar.
1)Means with the different small letters (a-g) in same row are significantly different (P<0.05) by Duncan’s multiple range test in all samples.
Table 5. Color of Coffea arabica cv. Catuai coffee beans from Brazil with roasting degree
Properties Green bean Roasted bean
Light medium Medium Moderately dark Very dark L*
a* b* ΔE
BI
43.77±0.39a1) 4.37±0.06d 20.33±0.21a 59.97±0.32d 68.05±0.60e
22.07±0.06b 9.70±0.36a 12.50±0.26b 79.53±0.15c 111.83±3.69b
16.63±0.42c 6.80±0.10b 8.50±0.20c 84.07±0.42b 99.05±4.51c
13.90±0.53d 6.73±0.06b 8.37±0.31c 86.77±0.49a 122.18±1.32a
13.80±0.26d 5.93±0.25c 5.73±0.32d 86.60±0.26a 83.59±4.60d BI: browning index.
1)Means with the different letters (a-e) in same row are significantly different (P<0.05) by Duncan’s multiple range test.
서도 로스팅 강도가 강해질수록 pH가 5.28에서 5.54로 증 가하여 본 연구 결과와 유사하였다.
가용성 고형분
에스프레소의 Brix 및 TDS 값은 로스팅 정도가 강해질수 록 감소하다가 E3에서 다시 증가하여 E4에서 6.33°Brix, TDS 5.39%로 가장 높았다(Table 4). 드립은 로스팅이 진 행됨에 따라 점점 감소하여 D3 및 D4에서 1.40°Brix, TDS 1.19%로 가장 낮았다. Kim 등(2016)의 연구에서 로스팅 시간이 길어질수록 드립의 Brix 값이 3.15%에서 2.80%로 감소하였으며, TDS 값은 2.51%에서 2.21%로 감소하였다.
이는 에스프레소의 TDS 값이 로스팅 정도가 강해질수록 증 가하다가 어느 최대점(무게손실 9.7%) 이후부터 감소하는 결 과와 유사하였다(Seo 등, 2003). Ko 등(2017)의 연구에서 Natural 커피의 TDS는 로스팅 정도에 따라 1.523~1.647 로 높아졌으며, Natural 커피의 TDS가 Washed 커피보다 높았다. 또한 에스프레소(4.61%)의 TDS는 레귤러 커피 (0.56%)보다 8~9배 높았다. TDS는 커피 향기성분의 잔류, 추출액의 점도 그리고 풍부함의 부여 등 중요한 역할을 한 다.
총산도
에스프레소의 총산도는 로스팅 정도가 강해질수록 감소 하였다(Table 4). 드립은 0.06%로 일정하다가 D4에서 0.03
%로 감소하였다. 산도는 생두, 로스팅 과정, 추출방법 등의 여러 요인에 의한 것으로 고품질 커피에 필수적인 요소 중
하나이다(Brollo 등, 2008). 산도는 pH와 함께 커피의 산미 에 영향을 주며 로스팅 단계가 medium에서 dark로 진행됨 에 따라 유기산 파괴로 감소하게 된다(Clarke, 1986).
환원당
환원당은 에스프레소와 드립 모두 로스팅 정도가 강해질 수록 유의적으로 감소하였다(Table 4). 에스프레소는 2.82 mg/mL에서 2.48 mg/mL로 로스팅이 진행됨에 따라 감소 하였으며, 드립은 1.06 mg/mL에서 0.65 mg/mL로 감소하 였다. Narita와 Inouye(2012)의 연구에서 추출 온도에 따른 coffee silverskin의 환원당 함량은 156 mg/g(25°C)에서 206 mg/g(180°C)으로 증가하다가 210°C 이후 137 mg/g 으로 감소하여 270°C에서는 70 mg/g이 되었다. Ginz 등 (2000)의 연구에서도 로부스타 원두의 당 함량이 220°C까 지는 증가하다가 이후부터 감소하여 본 연구 결과와 유사하 였다.
색도
로스팅에 따른 원두의 색도는 Table 5와 같다. L값은 생 두 43.77에서 very dark 13.80으로 유의적으로 감소하였 으며, a값은 생두가 4.37, 로스팅 원두는 light medium 9.70 에서 very dark 5.93으로 감소하였다. b값은 생두가 20.33 으로 가장 높았으며, 로스팅이 진행될수록 light medium 12.50에서 very dark 5.73으로 감소하였다. ΔE는 생두에 서 로스팅 단계가 강해짐에 따라 유의적으로 증가하였다.
BI는 생두가 68.05로 가장 낮았으며 moderately dark가
122.18로 가장 높았다. 커피의 경우 에스프레소는 E1, E2 및 E3의 L값이 10.03~12.53으로 높았으며 E4가 8.60으로 가장 낮았다(Table 6). a, b 값은 E1이 7.00 및 6.00으로 높았다. ΔE는 E4에서 91.40으로 가장 높았으며, BI는 E1이 134.68로 가장 높았다. 드립은 L, a, b 값 모두 로스팅 정도 가 강해질수록 감소하였다. ΔE는 D4에서 94.13으로 가장 높았으며, BI는 D1이 199.85로 가장 높았다. 로스팅 정도에 따른 색도의 변화는 마이야르 반응 및 캐러멜화의 비효소적 갈변에 의한 것으로 커피 원두에서 매우 중요한 요소이다.
특히 L값은 로스팅 시간 및 온도와 연관되어 로스팅 정도를 측정하며, 로스팅 과정에서 색상을 변경할 수 있는 매우 중 요한 지표이다(Bolek과 Ozdemir, 2017; Wang과 Lim, 2012; Massini 등, 1990). Ko 등(2017)의 연구에서도 로스 팅이 진행됨에 따라 모든 시료의 L값이 낮아졌으며, a, b 값 또한 감소하였다. BI는 항산화 활성에 영향을 주는 갈색 물질을 지표로 하며, 가열시간이 증가함에 따라 증가하나 어느 이상의 가열시간 이후부터는 감소하게 된다(Vande- walle과 Huyghebaert, 1980). Herawati 등(2019)의 연구 에서도 early yellow 및 brown 단계에서 갈색 물질을 다량 함유하였으며, 첫 번째 crack 이후 감소하여 본 연구 결과와 유사하였다.
카페인 함량
카페인 함량의 결과는 Table 7과 같다. 에스프레소는 E1 에서 E3로 로스팅 강도가 강해질수록 카페인 함량이 100 g당 30.77~52.29 mg으로 증가하였으며, 로스팅 강도가 가 장 강한 E4에서는 40.23 mg으로 감소하였다. 드립의 카페 인 함량은 D3에서 100 g당 6.21 mg으로 가장 높았으며, D4에서는 4.22 mg으로 낮아졌다. 이는 Kim과 Kim(2014b) 의 연구에서 로스팅 1단계 및 2단계까지 카페인 함량이 증 가하다가 이후 단계부터는 감소하여 10% 이상 분해되는 결 과와 유사하였다. 카페인은 쓴맛을 가지고 있는 성분으로 커피 쓴맛의 10% 정도 관여하며, 비교적 열에 안정적이다 (Kim 등, 2016). Kim 등(2016)의 연구에서도 로스팅 시간 이 짧은 원두에 비해 로스팅 시간이 긴 원두의 카페인 함량 이 높았다. 이는 로스팅 과정 중 발열 시 수분 증발과 함께 카페인 함량이 높아진 것으로 여겨진다. 휘발성 성분들은 로스팅 과정 중 제거되어 함량이 감소하였으나, 비휘발성 성분인 카페인은 손실되지 않아 함량이 높아지게 된다(Kim 과 Kim, 2014b). 그러나 강한 로스팅 단계 이후부터 카페인 함량은 감소하며 이는 본 연구 결과와 일치하였다. 아라비카 커피의 카페인 함량은 1.0~1.7% 정도이며 로부스타 커피의 카페인 함량은 2.0~2.4% 정도이다(Kim과 Kim, 2014b;
Ramalakshmi 등, 2007).
클로로겐산 함량
클로로겐산 함량은 에스프레소 및 드립 모두 로스팅 강도 가 강해질수록 감소하였다(Table 7). 에스프레소는 E1에서
E4로 갈수록 100 g당 39.24 mg에서 5.40 mg으로 감소하 였으며, 드립의 경우 D1에서 D4로 갈수록 5.88 mg에서 0.59 mg으로 감소하였다. 이는 로스팅 강도가 강해질수록 클로로겐산의 함량이 감소하는 결과와 일치하였으며, Kim 과 Kim(2014b)의 연구에서 강단계로 갈수록 클로로겐산 함 량이 90% 이상 감소하는 결과를 나타내었다. 클로로겐산은 quinic acid에 caffein acid가 ester 결합된 화합물로 CQA (caffeoyl quinic acid), Di CQA(di-caffeoyl quinic acid), FQA(feruoyl caffeoyl quinic acid) 등을 가지고 있다. 클로 로겐산은 3개의 이성질체 합을 의미하고 자극효과 및 쓴맛 에 기인하며 로스팅이 진행됨에 따라 caffein acid와 quinic acid로 분해된다(Kim 등, 2016). 일반적인 아라비카 커피의 클로로겐산 함량은 5.5~10%이다(Kim과 Kim, 2014b). 클 로로겐산은 착색 원인물질로 색도 변화와 연관이 있으며 로 스팅 시 색상의 변화에도 영향을 미친다(Kim 등, 2016).
유기산 함량
유기산 함량은 Table 8과 같이 에스프레소와 드립 모두 로스팅 시간이 길어질수록 감소하였다. Acetic acid는 에스 프레소에서는 유의적인 차이가 없었으며, 드립에서는 일정 하다가 로스팅 강도가 가장 강한 D4에서 37.37 mg/100 g 으로 증가하였다. Citric acid, malic acid 및 oxalic acid는 로스팅 시간이 길어짐에 따라 함량이 감소하였으며, lactic acid는 에스프레소 49.02~64.95 mg/100 g, 드립 20.89~
25.90 mg/100 g으로 유의적인 차이가 없었다. Kim 등 (2016)의 연구에서 로스팅이 강해짐에 따라 citric acid 및 malic acid 함량이 감소하였으며, 이는 본 연구 결과와 유사 하였다. 유기산 총량은 에스프레소가 585.70~1,350.46 mg /100 g으로 드립(178.25~579.28 mg/100 g)보다 많았다.
요 약
본 연구에서는 브라질산 Coffea arabica cv. Catuai 생두를 이용하여 로스팅 조건을 달리한 에스프레소 및 드립 커피 제조 후 일반성분, 중량 손실, pH, 가용성 고형분, 총산도, 환원당, 색도, 카페인, 클로로겐산 및 유기산의 이화학적 특 성을 분석하였다. 수분, 총산도, 환원당, 유기산 함량은 로스 팅이 진행됨에 따라 감소한 반면, 조지방, 조회분, pH 및 가용성 고형분 함량은 증가하였다. 명도는 로스팅과 밀접한 관련이 있으며 로스팅이 진행됨에 따라 감소하였다. 카페인 함량은 로스팅이 진행됨에 따라 moderately dark까지는 증 가하다가 very dark에서 감소하였으며, 클로로겐산 함량은 로스팅이 진행될수록 감소하는 경향을 보였다. 유기산 함량 은 citric acid, malic acid 및 oxalic acid가 로스팅이 강해 짐에 따라 감소하였다. 이상의 연구 결과 로스팅은 커피의 색, 맛, 성분 등에 매우 큰 영향을 미치며 기호도와 건강을 고려한 최적의 로스팅 조건은 커피의 품질에 큰 영향을 미칠 것으로 사료된다.
감사의 글
본 연구는 농림축산식품부 농림축산식품연구센터지원사업 (과제번호 714001-07)에 의해 수행되었으며 이에 감사드 립니다.
REFERENCES
AOAC. Official methods of analysis of AOAC International. 21st ed. Association of Official Analytical Chemists, Gaithersburg, MA, USA. 2019.
Berg HW. Stabilisation des anthocyanes. Comportement de la couleur dans les vins rouges. Ann Technol Agric. 1963. 12:
247-259.
Bolek S, Ozdemir M. Optimization of roasting conditions of Pistacia terebinthus in a fluidized bed roaster. LWT-Food Sci Technol. 2017. 80:67-75.
Borel E, Hostettler F, Deuel H. Quantitative zuckerbestimmung mit 3,5‐dinitrosalicylsäure und phenol. Helvetica Chimica Acta.
1952. 35:115-120.
Brollo G, Cappuccio R, Navarini L. Acidity in coffee: bridging the gap between chemistry and psychophysics. Proceeding of the 22nd International Conference on Coffee Science. 2008 Sep 14. Campinas, Brazil. p 270-280.
Clarke RJ, Macrae R. Coffee, Vol. 1: Chemistry. Elsevier Appli- ed Science, Dublin, OH, USA. 1985. p 42-48.
Clarke RJ, Macrae R. Coffee: Physiology. Elsevier Applied Sci- ence, Dublin, OH, USA. 1988. p 388.
Clarke RJ. The flavour of coffee. In: Morton ID, Macleod AJ, editors. Developments in Food Science 3B. Food Flavours, Part B. Elsevier, Amsterdam, Netherlands. p 1-47.
de Azeredo AMC. Coffee roasting: Color and aroma-active sul- fur compounds. University of Florida, ProQuest Dissertations Publishing, Gainesville, FL, USA. 2011. p 23-26.
Fikry M, Yusof YA, Al-Awaadh AM, Rahman RA, Chin NL, Mousa E, et al. Effect of the roasting conditions on the phys- icochemical, quality and sensory attributes of coffee-like pow- der and brew from defatted palm date seeds. Foods. 2019. 8(2):
E61. doi.org/10.3390/foods8020061
Ginz M, Balzer HH, Bradbury AGW, Maier HG. Formation of aliphatic acids by carbohydrate degradation during roasting of coffee. Eur Food Res Technol. 2000. 211:404-410.
Herawati D, Giriwono PE, Dewi FNA, Kashiwagi T, Andarwu- lan N. Critical roasting level determines bioactive content and antioxidant activity of Robusta coffee beans. Food Sci Bio- technol. 2019. 28:7-14.
ICO (International Coffee Organization). 2019 Coffee trade sta- tistics. [cited 2019 Apr 17]. Available from: www.ico.org/
trade_statistics.asp
ISO (International Organization for Standardization). Green cof- fee-defect reference chart. ISO 10470:2004. Geneva, Switz- erland. 2004.
Jeszka-Skowron M, Sentkowska A, Pyrzyńska K, De Peña MP.
Chlorogenic acids, caffeine content and antioxidant properties of green coffee extracts: influence of green coffee bean prepa- ration. Eur Food Res Technol. 2016. 242:1403-1409.
Jo SJ, In MJ, Kim DC. Effect of the roasting intensity and ex- traction time of coffee bean on the antioxidant activity of cof- fee extract. Food Eng Prog. 2016. 20:165-169.
Jung S, Kim MH, Park JH, Jeong Y, Ko KS. Cellular antioxidant and anti-inflammatory effects of coffee extracts with different roasting levels. J Med Food. 2017. 20:626-635.
Kang RK, Min KS, Kang MH. Physicochemical properties of supremo coffee according to grinding and brewing conditions.
J Korean Soc Food Sci Nutr. 2015. 44:89-96.
Kim AR, Kim JS. Flavor contributing nonvolatile chemical and sensory characterization of cold water extraction-based coffee by different extraction methods (dripping vs steeping) and time.
J Korea Soc Coffee Ind. 2014a. 3:1-9.
Kim SH, Kim JS. Chemical composition and sensory attributes of brewed coffee as affected by roasting conditions. Culinary Sci & Hos Res. 2017. 23(5):1-11.
Kim SH, Lee JK, Kim JS. Analysis of chemical and sensory characteristics of coffee brew differentiated by roasting con- ditions. J Korea Soc Coffee Ind. 2016. 5:33-41.
Kim YA, Kim JS. Bitter taste-inducing chemical composition profile and sensory characterization of arabica coffee as af- fected by the degree of roasting. J Korea Soc Coffee Ind.
2014b. 3:10-18.
Ko JG, Jung JH, Yoon HH. Sensory quality characteristics of colombia coffee under various processing and roasting con- ditions of green beans. J East Asian Soc Diet Life. 2017.
27:365-377.
Korea Agro-Fisheries and Food Trade Corporation, Ministry of Agriculture, Food and Rural Affairs. Current status of proc- essed food market: Coffee. Seoul, Korea. 2016.
Kwak HS, Jeong Y, Kim M. Effect of yeast fermentation of green coffee beans on antioxidant activity and consumer ac- ceptability. J Food Qual. 2018. Article ID: 5967130.
Kwak HS, Ji S, Jeong Y. The effect of air flow in coffee roasting for antioxidant activity and total polyphenol content. Food Control. 2017. 71:210-216.
Ledl F, Schleicher E. New aspects of the maillard reaction in foods and in the human body. Angew Chem. 1990. 29:565- 594.
Lee JC, Pae SI. A study on the sensory properties according to roasting conditions of coffee beans by continents. Int J Tour Hosp Res. 2014. 28:233-248.
Lee JK. Technological factors that determine the flavor of coffee.
J Korea Soc Coffee Ind. 2012. 1:56-62.
Lee SJ, Kim MK, Lee KG. Effect of reversed coffee grinding and roasting process on physicochemical properties including volatile compound profiles. Innov Food Sci Emerg Technol.
2017. 44:97-102.
Lim HH, Ji S, Kwak HS, Eom T, Kim M, Lee Y, et al. Quality characteristics of coffee brewed from green beans soaked in mulberry (Morus bombycis) extract. J Korean Soc Food Sci Nutr. 2015. 44:579-585.
Luca. 2017 Cheap brix refractometer-Is it useful?. 2008 [cited 2019 Apr 17]. Available from: http://www.coffeed.com/view topic. php?t=2489&f=17
Massini R, Nicoli MC, Cassar A, Lerici CR. Study on physical and physicochemical changes of coffee beans during roasting.
Ital J Food Sci. 1990. 2:123-130.
Mottram DS. The maillard reaction: source of flavour in ther- mally processed foods. In: Berger RG, editor. Flavours and Fragrances. Springer, Berlin, Heidelberg, New York. 2007. p 269-283.
Narita Y, Inouye K. High antioxidant activity of coffee silver- skin extracts obtained by the treatment of coffee silverskin with subcritical water. Food Chem. 2012. 135:943-949.
Ramalakshmi K, Kubra IR, Rao LJM. Physicochemical charac- teristics of green coffee: comparison of graded and defective beans. J Food Sci. 2007. 72:S333-337.
Seo HS, Kim SH, Hwang IK. Comparison on physicochemical properties and antioxidant activities of commonly consumed
coffees at coffee shops in Seoul downtown. Korean J Soc Food Cookery Sci. 2003. 19:624-630.
Suh YD. Physiochemical characteristics of dutch coffee depend- ing on different extraction conditions. Master’s thesis. Sung- kyunkwan University, Seoul, Korea. 2016.
Suh YS, Lee SH, Shang Y, Lee WJ. Effects of roasting con- ditions on the physicochemical properties of Coffea arabica beans. Korean J Food Preserv. 2015. 22:690-698.
The Specialty Coffee Association (SCA). 2019 Coffee standard.
[cited 2019 Apr 17]. Available from: https://sca.coffee/re search/coffee-standards
USDA. Coffee: world markets and trade. United States Depart- ment of Agriculture, Washington, DC, USA. 2017.
Vandewalle L, Huyghebaert A. The antioxidant activity of the non-enzymatic browning reaction in sugar-protein systems.
Mededelingen van de Faculteit Landbouwwetenschappen Rijks- universiteit Gent. 1980. 45:1277-1286.
Vasconcelos ALS, Franca AS, Glória MBA, Mendonça JCF. A
comparative study of chemical attributes and levels of amines in defective green and roasted coffee beans. Food Chem. 2007.
101:26-32.
Villanueva CM, Cantor KP, King WD, Jaakkola JJ, Cordier S, Lynch CF, et al. Total and specific fluid consumption as de- terminants of bladder cancer risk. Int J Cancer. 2006. 118:
2040-2047.
Virgen-Navarro L, Herrera-López EJ, Corona-González RI, Arriola-Guevara E, Guatemala-Morales GM. Neuro-fuzzy model based on digital images for the monitoring of coffee bean color during roasting in a spouted bed. Expert Syst Appl.
2016. 54:162-169.
Wang N, Lim LT. Fourier transform infrared and physicochem- ical analyses of roasted coffee. J Agric Food Chem. 2012.
60:5446-5453.
Yoo DJ. Coffee inside. 5th ed. Lion Company, Seoul, Korea.
2013. p 75-82.