매설환경에 따른 배수관망의 누수발생원인 특성분석
Development of a Probability Model for Burst Risks of Water Main using the Analysis Methods of Leakage Type
박상봉 1 ․최태호 2 ․구자용 2*
Sang Bong Park
1․Tae Ho Choi
2․Ja Yong Koo
2* 1 수자원기술(주), 2 서울시립대학교 환경공학부(2011년 2월 14일 접수 ; 2011년 3월 9일 수정 및 채택)
Abstract
In this study, we extracted effective factors of pipe burst from the status data of water asset, operating data of pressure, volume and etc. and 7 years' pipe burst and repair records. The extracted factors were sorted by each attribution and then a statistical analysis was performed to generate a pipe burst probability function using the logistic regression model.
As the result, material, diameter, length, laying year, pressure and road width affected to pipe burst significantly. Especially, in case of small diameter, laying year was most effective factor and in case of steel pipe, external loading was main cause of burst, and in case of cast iron, PE, PC, HP pipes, the deterioration of joint was main cause. The other side, as a result of Hosmer-Lemeshow goodness of fit test the models are turned out significant statistically. Also the classification criteria were determined to minimize the total cost from classification errors, when the predicted probability was more than 18% this pipe could have a chance of burst.
Key words : Water main, leakage, burst, bursting probability, logistic regression
주제어 : 대형 상수관로, 누수, 파손, 파손확률, 로지스틱 회귀분석
*Corresponding author Tel:+82-2-2210-2624, Fax:+82-2-2244-2245, E-mail: [email protected](Koo, J.Y.)
1. INTRODUCTION
Water is an indispensable resource for sustaining human life on earth. Therefore, its quality and quantity are the barometers for gauging life satisfaction. Waterworks were established supply drinking water convenient. Their history can be traced back to 2,200years ago in Egypt, where drinking water was acquired by digging wells.
In this paper, water supply facilities are defined as the facilities that purify water and provide it to its customers. The objective of the installation of water supply facilities is to provide sufficient and safe water to the customers at a reasonable cost. Unfortunately, South Korea has neglected the management of its 100-year-old waterworks, and natural corrosion has thus occurred. It can thus be said that South Korea has overlooked the quality of its water pipelines while
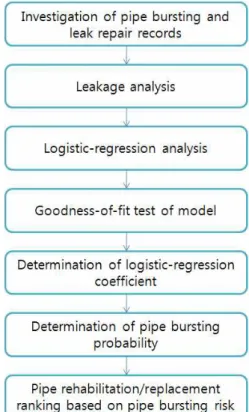
Fig. 1. Flowchart of the pipe burst probability model.
rapidly expanding its water supply networks.
Water pipes not only corrode with the passage of time but are also extremely difficult to maintain or repair because they are installed underground and because there is consistent water operating pressure within the tubes. Moreover, the pressure is unpredictable especially right before water is supplied, due to the variation in the amount of water being used at different times. Accordingly, the anxiety over the corrosion and leakage of the country’s aged water pipes and over the safety of the water supply has led to the people’s lack of confidence in the quality of the water supply services and has ultimately led the people to avoid drinking tap water.
To address the problems caused by the country’s aging water infrastructure, various solutions, such as regular check-ups, maintenance, and replacement, are required. Among these, regular repair and replacement of the water mains after a comprehensive and systematic evaluation of the aged water infrastructure may be the most crucial solution to the problem.
In this study, a new system for leakage maintenance was developed, and the statistical percentage of water pipe bursting was determined by identifying the factor that influences pipe bursting the most. The related accidents were also analyzed by case, using the data obtained from the research that was conducted on the different cases of damage and leakage of water mains that occurred over seven years, along with the information on the present condition of the water utilities throughout South Korea.
2. METHODS
Research procedure:
Various research data were used in this study: the report on the present condition of the wide pipe networks throughout South Korea, the detailed records of the water mains that were broken and that leaked from 2001 to 2007, and the data obtained from an analytical study on the present condition of the water services on GIS(theenvironmental factors in the areas where water pipes are installed). Research was conducted using the method shown in Fig. 1.
Data Collection and Scope of Research:
In this study, various data were analyzed(including GIS) to investigate and examine the documents or records of the aged water pipes of South Korea and their repair records, as well as the geologic conditions of the areas where water mains are installed.The precedent research focused mainly on pipes with small diameters, such as drainage pipes.
Therefore, the insufficiency of the available data made it challenging to conduct this study and to collect data regarding the maintenance and management of the country’s large water infrastructure.
This study on South Korea’s large water pipes was conducted because the direct and indirect impact of the bursting of large water pipes will be much more detrimental than that of the bursting of small water
pipes, even though the frequency of the bursting and leakage of large water pipes is not as high as that of small water pipes.
To determine the probability function and the specific characteristics of the bursting of the city water pipe system, research on 20 waterworks offices was conducted, and the extensive data on the restoration of broken pipes from 2001 to 2007 were organized. In addition, to obtain more accurate information, the field supervisors were interviewed in person.
Classification of pipe bursting characteristics for model development:
The attribute data that were used for the statistical analysis were chosen after considering the availability of the existing documents.The data regarding the pipe bursting caused by unrelated construction works or by fault of construction during water pipe installation were excluded.
The major large-water-pipeline research areas included the factors that influence the bursting of such pipelines, such as the surrounding environment, the areas where pipes are installed, the characteristics of pipes, the soil conditions, the cause of water leakage, the leaking pipe parts, and the specific time of leakage.
The factors related to the surrounding environment were classified into roads with two or more lanes, roads with four or less lanes, and unpaved roads. The areas of pipe installation were classified into farmlands, mountains, and lands specifically designated for waterworks. The factors related to the characteristics of pipes were categorized into material, diameters, year of installation, methods used for pipe binding, and ground depth above the water pipeline. The soil condition factors were classified into percentage of water content, pH, oxidation-reduction potential, and soil resistivity.
The causes of water leakage were classified into pipe expansion and contraction caused by temperature, external weight pressure, defective materials, aging process, and the surrounding construction works.
The damaged pipe parts that caused leakage were
determined to be the pipe body, the connecting device(flanges, pressing wheels, etc.), and valves.
The time of leakage was categorized into different seasons, months, and days and night. Moreover, the pipe burst probability model was designed by selecting the factors that influence pipe bursting.
Logistic-regression model:
Logistic regression predicts the probability of the occurrence of an incident but does not directly predict the occurrence of an incident. Consequently, the value of the dependent variable is between 0 and 1. As a result of the analysis, it was predicted that if the probability is closer to 1, an incident will occur, and if the probability is closer to 0, no incident will take place.The simple and multiple regression analyses that were done presumed the relationship between the dependent and independent variables to be linear.
Logistic regression, on the other hand, presumed the relationship to be an S-shaped curve. Logistic regression(also called “logit analysis”) is generally applied when there are two ranges of dependent variables: when the pipe breaks, it is 1; when the pipe does not break, it is 0. Logistic regression can be defined as formula (1) when the pipe bursting probability is
p
.0 1 1 2 2
ln 1 n n
p b b X b X b X
p
æ ö
= + + + +
ç - ÷
è ø
L (1)
The pipe bursting probability function after recalculating the pipe bursting probability
p
is shown in formula (2).0 1 1 2 2
1 ,
1 z n n
p Z b b X b X b X
e
-= = + + + +
+ L
(2)
where
X
i are the dependent variables, which are the factors influencing pipe failure, andb
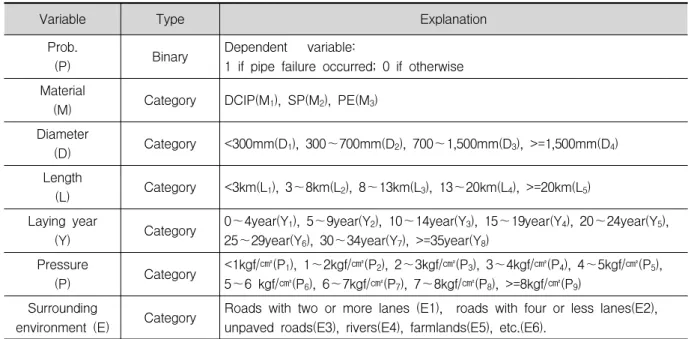
i are the coefficients, which are presumed by the regression of the model. Table 1 shows the range of the variables and the variables that were used in this study.Logistic regression was performed using the variable shown above, and forward selection, a
Variable Type Explanation Prob.
(P) Binary Dependent variable:
1 if pipe failure occurred; 0 if otherwise Material
(M) Category DCIP(M1), SP(M2), PE(M3) Diameter
(D) Category <300mm(D1), 300~700mm(D2), 700~1,500mm(D3), >=1,500mm(D4) Length
(L) Category <3km(L1), 3~8km(L2), 8~13km(L3), 13~20km(L4), >=20km(L5) Laying year
(Y) Category 0~4year(Y1), 5~9year(Y2), 10~14year(Y3), 15~19year(Y4), 20~24year(Y5), 25~29year(Y6), 30~34year(Y7), >=35year(Y8)
Pressure
(P) Category <1kgf/㎠(P1), 1~2kgf/㎠(P2), 2~3kgf/㎠(P3), 3~4kgf/㎠(P4), 4~5kgf/㎠(P5), 5~6 kgf/㎠(P6), 6~7kgf/㎠(P7), 7~8kgf/㎠(P8), >=8kgf/㎠(P9)
Surrounding
environment (E) Category Roads with two or more lanes (E1), roads with four or less lanes(E2), unpaved roads(E3), rivers(E4), farmlands(E5), etc.(E6).
Table 1. Variables used in the statistical analysis
stepwise regression, was chosen as the logistic-regression coefficient. As for the significance of the regression coefficient, using Wald statistics, a coefficient that was significant within the significance level of 5% was chosen. In addition, for the statistical analysis, SPSS ver.13.0, a popular statistical package, was used.
3. RESULTS AND DISCUSSION
Analysis of the characteristics of the bursting of large water pipes :
The research materials were accurate data from the actual field, where the city water pipelines are being managed. The total number of pipe bursting and leakage cases over the aforementioned seven-year period was 377; from these, damage artificially occurred in 11 cases. The specific characteristics of the pipe bursting were studied based on 326 cases, excluding the 11 cases where damage artificially occurred. The primary causes of pipe bursting were found to be aging(151 cases), defective materials(56 cases), external weight pressure(49 cases), pipe expansion and contraction caused by temperature changes(24 cases), water pressure within the pipes(21 cases),and others(25 cases). The most frequently damaged parts were the pipe body(178 cases), pipe fittings(108 cases), valves(26 cases), and flanges(14 cases). Even though the external pressure from the road traffic has a relatively lower impact on the large water pipes than on the small pipes and tubes, the potential damage from such should not be ignored. It was found in this study that aging and defective materials are the major causes of leakage, accounting for 64% of the cases. It was also found that there are various reasons for pipe bursting. Pipe bursting was classified and analyzed according to the material, diameters, installation environment, water pressure, age, seasonal or monthly changes, causes of bursting, and damaged parts.
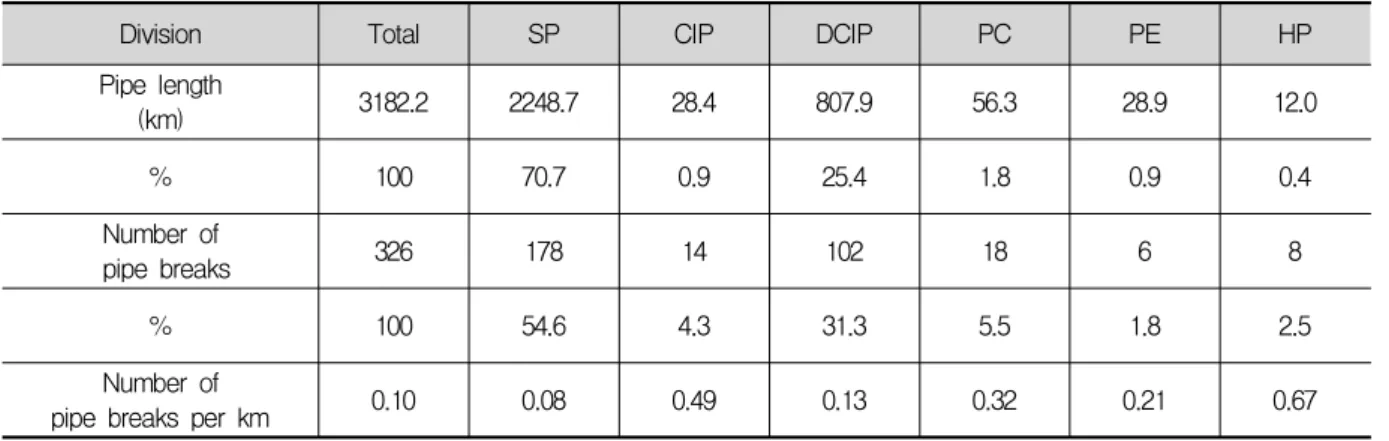
After a careful examination of the characteristics of pipe bursting according to the different types of pipes, as following Table 2, it was found that 178 out of 326 pipe bursting incidents(54.6%) occurred in steel pipes, which represented 70% of the entire length of the pipeline. The rate of pipe bursting, however, was 0.08 case/km, which was far lower than the average number of bursting cases in general pipes, since steel welding makes the water-pipe-connecting device very sturdy, and the
Division Total SP CIP DCIP PC PE HP Pipe length
(km) 3182.2 2248.7 28.4 807.9 56.3 28.9 12.0
% 100 70.7 0.9 25.4 1.8 0.9 0.4
Number of
pipe breaks 326 178 14 102 18 6 8
% 100 54.6 4.3 31.3 5.5 1.8 2.5
Number of
pipe breaks per km 0.10 0.08 0.49 0.13 0.32 0.21 0.67
Table 2. Examination of the characteristics of pipe bursting according to the pipe materials.
Division(mm) total <=500 500~
1,000 1,000~
1,500 1,500~
2,000 >=2,000 Pipe length
(km) 3182.2 464.9 1014.6 871.8 465.7 365.3
% 100 14.6 31.9 27.4 14.6 11.5
Number of
pipe breaks 326 120 94 69 31 12
% 100 36.8 28.8 21.2 9.5 3.7
Number of
pipe breaks per km 0.10 0.26 0.09 0.08 0.07 0.03
Table 3. Examination of the characteristics of pipe bursting according to the pipe diameters.
diameter of the pipes are determined after careful consideration of the external weight and internal water pressure before laying them underground.
Further, the large-diameter pipes whose inner parts can be directly welded are usually steel pipes. Ductile cast iron pipes account for 25.4% of the total length of the pipeline, and their bursting rate is 31.3%, which is 0.13case/km. Ductile cast iron pipes have been used for only 20 years in South Korea, and they are frequently used for small-diameter tubes as they are harder and more durable than grey cast iron pipes.
The grey cast iron and Hume pipes burst more frequently than other kinds of pipes because they were installed a long time ago. Moreover, the old grey cast iron and Hume pipes are becoming shorter because they were the first pipes that had to be replaced. Plastic pipes such as polyethylene(PE) pipes, which are becoming increasingly popular, are
often used in small diameter pipes. Plastic pipes, however, are adopted in large-diameter pipes in areas where metal pipes cannot be installed owing to soil decay and stray current corrosion. As the connecting parts of the plastic pipes are weak, they frequently burst regardless of their age.
In the examination of the characteristics of pipe bursting depending on the different types of pipes, as following Table 3, it was found that the larger the pipe diameters are, the lower the burst rates. Iron pipes with diameters of 700mm or less, PE, and HP pipes use pipes connected by joints while large-diameter pipes with diameters of 800mm or more are welded with steel pipes. Therefore, large pipes have stronger than small pipe resistance against the pressure from the external load, temperature, and water current.
Division Total 2 lanes 4 lanes Unpaved Rivers Farmlands Etc.
Pipe length
(km) 3182.2 650.5 818.8 558.2 75.3 912.4 167.1
% 100 20.4 25.7 17.5 2.4 28.7 5.3
Number of
pipe breaks 326 68 128 21 5 73 31
% 100 20.9 39.3 6.4 1.5 22.4 9.5
Number of
pipe breaks per km 0.10 0.10 0.16 0.04 0.07 0.08 0.19
Table 4. Examination of the characteristics of pipe bursting according to the installation environment.
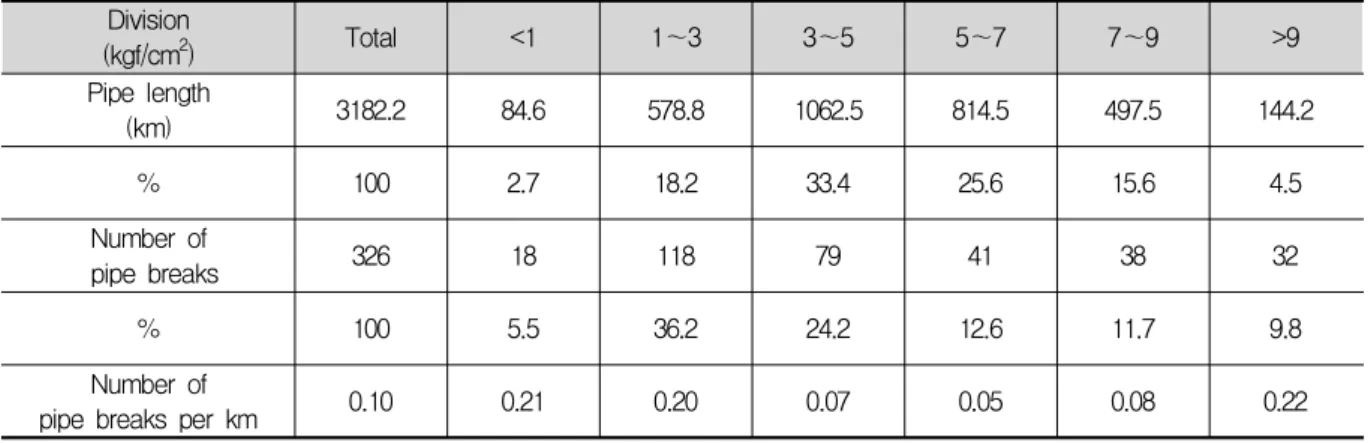
Division
(kgf/cm2) Total <1 1~3 3~5 5~7 7~9 >9
Pipe length
(km) 3182.2 84.6 578.8 1062.5 814.5 497.5 144.2
% 100 2.7 18.2 33.4 25.6 15.6 4.5
Number of
pipe breaks 326 18 118 79 41 38 32
% 100 5.5 36.2 24.2 12.6 11.7 9.8
Number of
pipe breaks per km 0.10 0.21 0.20 0.07 0.05 0.08 0.22
Table 5. Examination of the characteristics of pipe bursting according to the water pressure.
As for the characteristics of pipe bursting according to the installation environment, as following Table 4, the report shows 0.19case/km in the “Others”
category. The pipes that include bridges experience frequent damage due to the bridge constructions and vibrations. On the other hand, small-diameter pipes, which have a shorter life span than large pipes, are laid under sidewalks and roadsides. It is assumed that they showed the highest bursting rate because of the frequent pipe bursting reports in each category.
Moreover, pipe bursting was high under four-lane paved roads(0.16 case/km). It is presumed that the frequent traffic of trucks and other heavy vehicles on roads with wider widths can cause pipe bursting due to ground subsidence and vibration.
As for the characteristics of pipe bursting according to the water pressure, as following Table 5, the pipe
bursting rates were as low as 0.07, 0.05, and 0.08 cases under the water pressure of 3~9kgf/㎠. This is attributed to the fact that the water pressures of the large water pipes in the cities’ water networks are mostly maintained under 3~9kgf/㎠. To be specific, the pipes with water pressures of 3~9 kgf/㎠ account for 77% of the total pipeline. The pipe bursting caused by water pressure depends on the connecting and binding method used in the case of the large water pipes, while the pipes that are connected by joints have higher bursting rates owing to their weak resistance against repeated vibration and land subsidence.
The year of pipe installation has been considered an important factor for determining the aging process of the pipes and the sole factor for predicting bursting. To predict bursting more accurate,
Division <5year 5~10year 11~15year 16~20year 21~25year 25~30year >=30year
SP 5 26 61 21 14 26 25
CIP 0 0 0 0 2 4 8
DCIP 21 35 17 27 2 0 0
PC 0 0 2 1 0 5 10
PE 0 0 0 6 0 0 0
HP 0 0 0 0 1 0 7
Table 6. Examination of the characteristics of pipe bursting according to the pipe ages.
Division Jan. Feb. Mar. Apr. May Jun. Jul. Aug. Sep. Oct. Nov. Dec.
SP 23 10 11 13 8 14 19 22 17 12 13 16
CIP 0 1 0 0 3 1 4 0 0 1 3 1
DCIP 14 8 10 3 4 8 6 5 11 10 16 7
PC 8 0 0 1 0 1 0 0 1 2 1 4
PE 4 0 1 0 0 0 0 1 0 0 0 0
HP 2 1 0 0 2 0 0 0 0 0 0 3
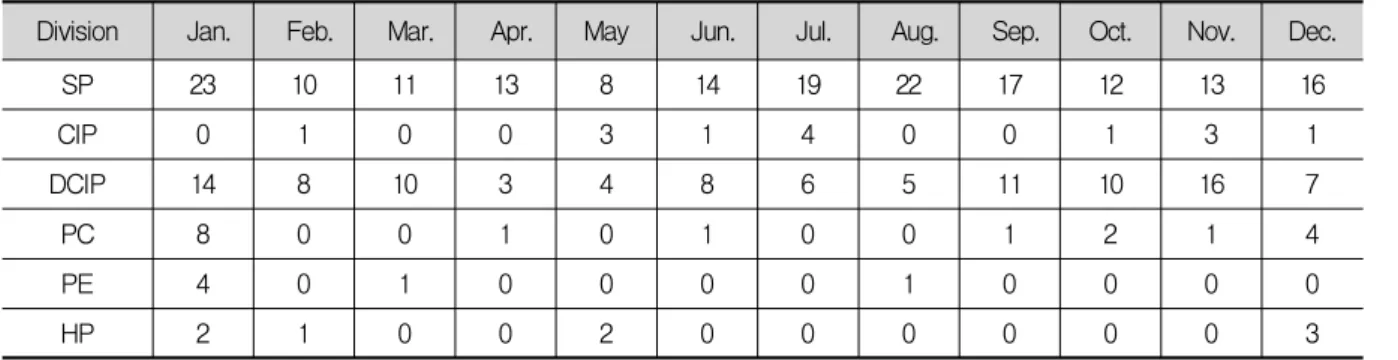
Table 7. Examination of the characteristics of pipe bursting according to the months.
however, the frequency of pipe bursting was determined by calculating the number of years that elapsed from the initial installation of the pipes before the pipes broke rather than simply looking at the installation year when the pipes were installed. Above all, as for the frequency of pipe bursting according to the year of installation, as following Table 6, SP was found to have the highest bursting rate(61 cases) 11~15 years after its installation. The repetitive bursting of specific pipe parts led to this conclusion.
As for DCIP, it showed the highest rate of bursting(35 cases) 5~10 years after its installation, even though it was introduced in South Korea only 20 years ago and is newer than steel pipes and other kinds of pipes. The frequent damage of DCIP was found to be caused by joint dislocation. CIP and PC pipes experience dramatic increases in bursting rate especially in the old pipe bodies and connecting device, and the fact that they are 20 years old aggravates the problem. Therefore, CIP and PC pipes must be the first to be replaced or repaired in the pipe restoration project.
As for the frequency of pipe bursting according to the month and season, as following Table 7, SP experiences 22~23 bursting cases in January and August. As for the seasonal impact, the highest numbers of accidents were recorded in summer and winter(49~55cases). It is assumed that pipe failure is caused by the pipe contraction due to the low temperature in winter and the soil movement in spring after the evaporation of water within the frozen soil. The heavy rainfall during summer monsoon in South Korea also significantly influences pipe bursting.
The biggest cause of pipe failure was found to be aging, as following Table 8, which caused 151 out of 326 pipe bursting cases(46.3%). Defective quality(17.2%), external weight(15.0%), pipe expansion and contraction caused by temperature change, and water pressure were found to be the other causes of pipe failure. Especially, defective pipes and accessory structures, including valves, have brought about frequent pipe bursting and
Division Temperature
change Aging External weight Water pressure Defective quality Etc.
SP 15 101 18 7 34 3
CIP 0 9 3 1 1 0
DCIP 3 21 23 13 20 22
PC 2 12 3 0 1 0
PE 4 2 0 0 0 0
HP 0 6 2 0 0 0
Table 8. Examination of the characteristics of pipe bursting according to the pipe bursting cause.
Division Pipe body Connecting device Valves Flanges Etc.
SP 123 30 19 6 0
CIP 8 4 0 2 0
DCIP 35 56 5 6 0
PC 4 12 2 0 0
PE 2 4 0 0 0
HP 6 2 0 0 0
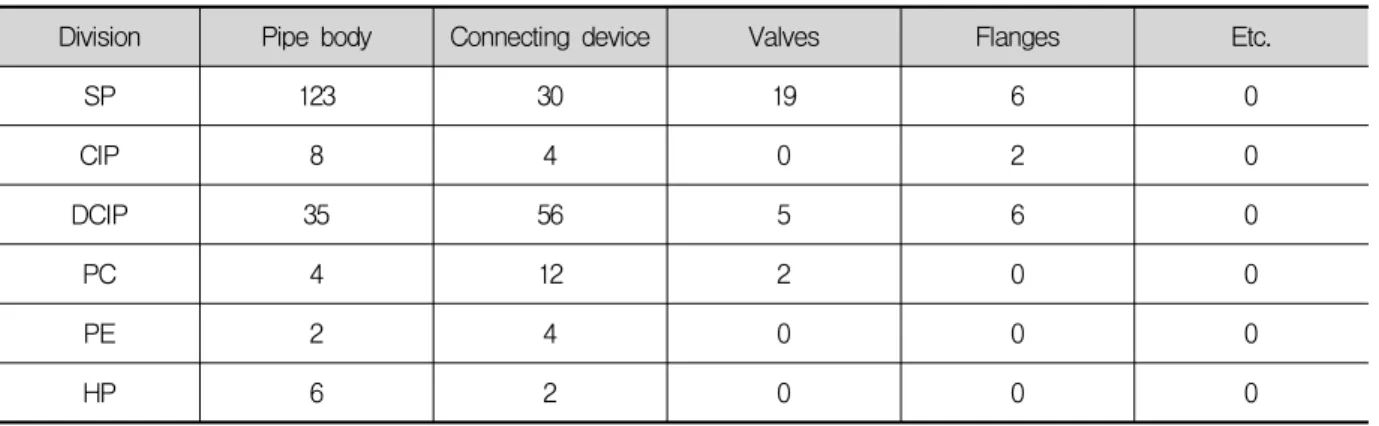
Table 9. Examination of the characteristics of pipe bursting according to the pipe bursting parts.
leakage. This attributed to the poor management of water pipe production in factories as well as the problems that occurred during the pipe installation process in the field. Therefore, it is crucial to execute strict quality screening of the products and to thoroughly inspect construction projects onsite.
As for the bursting of different parts of pipes, as following Table 9, the bursting was found to occur mostly in the pipe body, connecting device, valves, and flanges, and old pipe bodies were found to be the major cause of the bursting. In the case of SP, CIP, and HP, the frequency of bursting of the pipe body was found to be the highest(123, 8, and 6 cases).
This is mainly due to the thinning of the old pipe walls and pinholes. As for DCIP, PC, and PE, the frequency of bursting of the connecting device was 56, 12, and 4 cases. Joint-caused vibration in the connecting device, subsidence, and weakened resistance caused
by water pressure were found to be the major causes of frequent pipe bursting.
Development of a pipe bursting probability model:
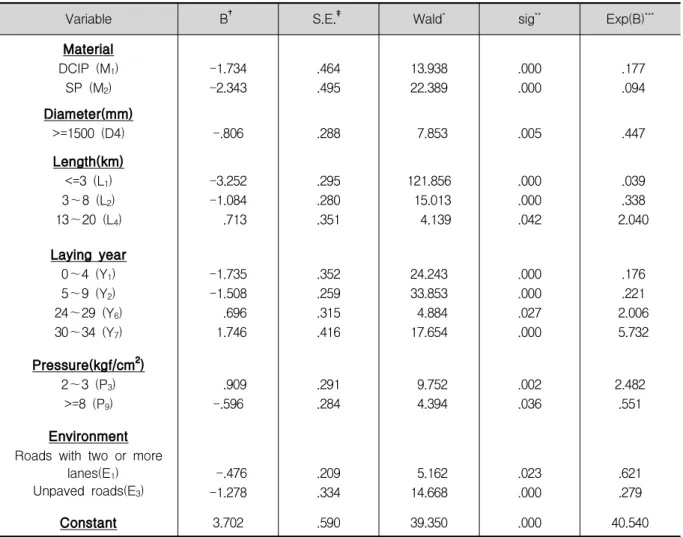
Through logistic regression, it was found that the major factors that increase the pipe bursting rate are the material/diameter/length/age, water pressure, and installation environment. For the test of statistical significance, independent variables with a significance level of 5% were selected using the Wald statistic of forward selection. The pipe bursting probability was determined according to formula (3).
1 2 4
1 2 4
1 2 6 7
3 9 1 3
1 1
3.702 ( 1.734 2.343 ) ( .806 ) ( 3.252 1.084 0.713 )
( 1.735 1.508 0.696 1.746 ) (0.909 0.596 ) ( 0.476 1.278 ) P
ze
Z M M D
L L L
Y Y Y Y
P P E E
=
--
= + - - + -
+ - - -
+ - - + +
+ - + - -
(3)
Variable B† S.E.‡ Wald* sig** Exp(B)***
Material DCIP (M1)
SP (M2)
-1.734 -2.343
.464 .495
13.938 22.389
.000 .000
.177 .094 Diameter(mm)
>=1500 (D4) -.806 .288 7.853 .005 .447
Length(km)
<=3 (L1) 3~8 (L2) 13~20 (L4)
-3.252 -1.084 .713
.295 .280 .351
121.856 15.013 4.139
.000 .000 .042
.039 .338 2.040 Laying year
0~4 (Y1) 5~9 (Y2) 24~29 (Y6) 30~34 (Y7)
-1.735 -1.508 .696 1.746
.352 .259 .315 .416
24.243 33.853 4.884 17.654
.000 .000 .027 .000
.176 .221 2.006 5.732 Pressure(kgf/cm2)
2~3 (P3)
>=8 (P9)
.909 -.596
.291 .284
9.752 4.394
.002 .036
2.482 .551 Environment
Roads with two or more lanes(E1)
Unpaved roads(E3) -.476 -1.278
.209 .334
5.162 14.668
.023 .000
.621 .279
Constant 3.702 .590 39.350 .000 40.540
Table 10. Variables in the equation
At the significance level of 5%, the null hypothesis of the pipe bursting model developed in this study(“No difference between the predicted dependent variable and the observed values was detected”) was not rejected because the significance value was larger than 0.05 by Chi-square statistic.
Therefore, the pipe bursting model is a valid model.
The pipe bursting probability model that was developed in this study was determined to be valid because it had a significance level of 0.085.
Determination of the standard for the categorization of the pipe bursting risk :
In this study, the observed values were analyzed by assigning “1” for bursting and “0” for no bursting. The errors in the predicted variable found through the functional formula can bedemonstrated in two ways. The type I error categorizes the pipes that have actually been broken into pipes that have never been broken, and the type II error categorizes the pipes that have never been broken into pipes that have actually been broken. It is believed that correctly identifying the pipes that have been damaged is crucial, for which reason the prior mistake was designated as type I error. To identify the optimal criteria of pipe bursting probability for pipe replacement and rehabilitation, the amounts of loss incurred by the two aforementioned errors were determined through approximate calculation. That is, for the type I error, as the pipes that have actually been broken were categorized into pipes that have never been broken, the amount of leaking water caused by the neglect of
Chi-square df sig.
Step1 Step
Block† Model‡
193.026 193.026 193.026
1 1 1
.000 .000 .000
Step2 Step
Block† Model‡
39.265 232.282 232.282
1 2 2
.000 .000 .000
Step3 Step
Block† Model‡
27.794 260.076 260.076
1 3 3
.000 .000 .000
Step4 Step
Block† Model‡
23.127 283.203 283.203
14 4
.000.000 .000
Step5 Step
Block† Model‡
28.810 312.013 312.013
1 55
.000 .000.000
Step6 Step
Block† Model‡
19.356 331.369 331.369
16 6
.000.000 .000
Step7 Step
Block† Model‡
22.461 353.830 353.830
17 7
.000.000 .000
Step8 Step
Block† Model‡
19.333 373.163 373.163
1 88
.000 .000.000
Step9 Step
Block† Model‡
9.055 382.219 382.219
1 99
.003 .000.000
Step10 Step Block† Model‡
5.864 388.083 388.083
1 1010
.015 .000.000
Step11 Step Block† Model‡
4.896 392.979 392.979
111 11
.027.000 .000 Step12 Step
Block† Model‡
5.574 398.553 398.553
121 12
.018.000 .000 Step13 Step
Block† Model‡
4.821 403.374 403.374
1 1313
.028 .000.000
Step14 Step Block† Model‡
4.574 407.948 407.948
1 1414
.032 .000.000
Table 11. Omnibus tests of model coefficients
Fig. 2. Nodal flow of the individual leakage distribution method applied to the distribution networks computed in area A.
the pipe bursting was regarded as the amount of loss.
As for the type II error, the cost incurred by categorizing the pipes that have never been broken into pipes that have actually been broken was regarded as the amount of loss. To decide on the foregoing, the total amount of money invested into the restoration of the broken city water pipelines was analyzed. The amount of loss due to pipe bursting, such as the direct restoration cost and the expense incurred by water leakage, and the missed-opportunity cost during the repair, were calculated by computing the average. The total amount of money invested into the prevention of pipe bursting was also calculated.
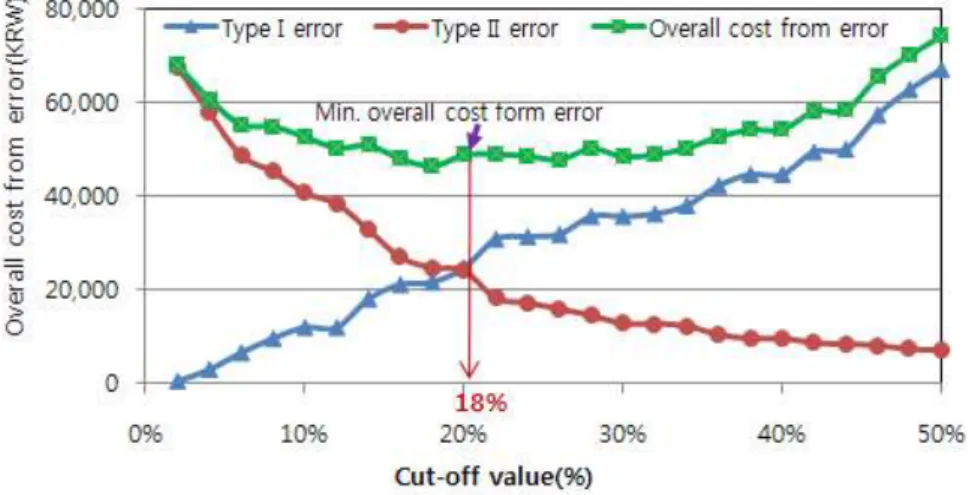
The amount of loss incurred by the type I error was found to be KRW 18,000. This amount was determined by dividing the direct expense for water leakage restoration over seven years and the amount of water loss by the total number of pipe bursting cases. The amount of loss incurred by the type II error was found to be KRW 7,500. This amount was determined by dividing the service expense for the regular inspection of the pipes as preventive measures by the average number of pipe bursting cases. The amount of loss incurred by the errors was computed according to the classification standard, by multiplying the amount of loss in one case with the
misclassification error rate. The point at which the total amount of loss in all the cases was minimal was chosen as the classification standard.
The minimum amount of loss was found to be 18%
in the classification criteria, as shown in Fig. 2.
4. CONCLUSION
In this study, models for leakage management and statistical bursting probability were developed. Data on pipe bursting and leakage cases were used to improve the large water pipeline management system and to facilitate pipe replacement projects. As a result, the factors that influence pipe bursting the most were identified, and each pipe bursting and leakage case was analyzed by studying the characteristics of the leakage cases.
(1) Above all, explanatory variables and the category of explanatory variables that was selected through the analysis of the characteristics of large-water-pipeline bursting were used. As for the variable selection, a logistic-regression model was developed using the forward selection method. As a result of such development, the null hypothesis that
“the coefficient of the independent variables
included in the models is 0” was rejected. Moreover, the null hypothesis that “no difference between the predicted dependent variable and the observed values was detected” was chosen. Therefore, the logistic-regression model that was developed in this study was found to be valid.
(2) In addition, the optimal classification standard was chosen to minimize the amount of loss incurred by the errors in the categorization of the pipes with past bursting records, and it was concluded that pipes with 18% bursting probability have a considerable potential to burst. This shows that the pipes with 18%
bursting probability should be the first to be repaired or replaced when applying the pipe bursting probability model to the actual situation.
The significance level of the regression coefficient in the pipe bursting probability model depends on the accuracy and validity of the data.
In this study, the factors affecting the water quality and soil condition were not applied due to the insufficiency of the related information. Therefore, it is assumed that a more accurate pipe bursting probability model can be designed if a more systematic standard will be applied from the early stage of data acquisition and management, and if certain factors that are significantly influential will be added or deleted.
ACKNOWLEDGEMENT
This work was supported by the 2009 sabbatical-year research grant of the University of Seoul.