Introduction
Chronic obstructive pulmonary disease (COPD) is a glob- ally prevalent disease with serious complications and high mortality. COPD is currently the fourth leading cause of death.
Recently, its prevalence has rapidly increased and is expected to be the third leading cause of death worldwide by 2030
1.
COPD is known to be a heterogeneous lung disease that includes many different phenotypes. Asthma can coexist with COPD, particularly in older adults, a condition known as
“asthma COPD overlap (ACO)
2.” ACO is an inflammatory con- dition of both asthma and COPD, characterized by increased variability of airflow and incompletely reversible airway flow obstruction. ACO prevalence is estimated to be about 20% of
Clinical Features of Chronic Obstructive Pulmonary Disease with High Fractional Exhaled Nitric Oxide
Seong Ahn, M.D. , Tae-Ok Kim, M.D., Jinsun Chang, M.D., Hong-Joon Shin, M.D., Yong-Soo Kwon, M.D., Ph.D., Sung-Chul Lim, M.D., Ph.D. and Yu-Il Kim, M.D., Ph.D.
Division of Pulmonology, Department of Internal Medicine, Chonnam National University Medical School, Gwangju, Korea
Background: The fractional exhaled nitric oxide (FENO) test is useful in asthma patients. However, a few studies on its usefulness in chronic obstructive pulmonary disease (COPD) patients have been reported. We analyzed the FENO level distribution and clinical characteristics according to the FENO level in COPD patients.
Methods: From December 2014 to June 2019, COPD patients who underwent pulmonary function and FENO tests at Chonnam National University Hospital were retrospectively evaluated for FENO, comorbidities, asthma history, blood eosinophil, and pulmonary function test. The high FENO group was defined as those with FENO level>25 parts per billion (ppb).
Results: A total of 849 COPD patients (mean age, 70.3±9.4 years) were included. The mean forced expiratory volume at 1 second was 66.5±21.7% and the mean FENO level was 24.3±20.5 ppb. Patients with FENO ≤25 ppb were 572 (67.4%) and those with FENO >25 ppb were 277 (32.6%). Blood eosinophil percentage was significantly higher (4.2±4.8 vs. 2.7±2.5, p<0.001) in patients with the high FENO group than the low FENO group. The high FENO group revealed a significantly higher frequency of patients with blood eosinophil percentage >3% (46.9% vs. 34.8%, p=0.001) and asthma history (25.6% vs. 8.6%, p<0.001) than the lower FENO group. Asthma history, blood eosinophil percentage >3%, and positive bronchodilator response (BDR) were independent risk factors for the high FENO level (adjusted odds ratio [aOR], 3.85;
p<0.001; aOR, 1.46; p=0.017; and aOR, 1.57, p=0.034, respectively) in the multivariable analysis.
Conclusion: The FENO level distribution varied in COPD patients and the mean FENO value was slightly elevated.
Asthma history, eosinophil percent, and positive BDR were independent risk factors for the high FENO level.
Keywords: Nitric Oxide; Pulmonary Disease, Chronic Obstructive; Asthma-Chronic Obstructive Pulmonary Disease Overlap Syndrome
Address for correspondence: Yu-Il Kim, M.D., Ph.D.
Division of Pulmonology, Department of Internal Medicine, Chonnam National University Medical School, 42 Jebong-ro, Dong-gu, Gwangju 61469, Korea
Phone: 82-62-220-6296, Fax: 82-62-225-8578 E-mail: [email protected]
Received: Dec. 20, 2019 Revised: Feb. 27, 2020 Accepted: May. 11, 2020 Published online: Jun. 18, 2020
cc It is identical to the Creative Commons Attribution Non-Commercial License (http://creativecommons.org/licenses/by-nc/4.0/).
Copyright © 2020
The Korean Academy of Tuberculosis and Respiratory Diseases.
obstructive airway disease
3. ACO increases the disease bur- den because it increases acute exacerbation and hospitaliza- tion
4. Also, it is known that ACO treatment is quite different from COPD treatment
5; therefore, it is important to distinguish ACO from COPD. However, no clear diagnostic biomarker or criteria are available and the fraction of exhaled nitric oxide (FENO) test may help in ACO diagnosis.
Nitric oxide is produced in the epithelial cells and regulates vascular and bronchial tone in respiratory system
6. It can be detected in exhaled gas as FENO. FENO can be easily and quickly measured with NIOX MINO (Aerocrine AB, Solna, Sweden), which is a portable hand-held and simple device providing consistent and accurate results in clinical practice
7.
The American Thoracic Society (ATS) published an evidence-based clinical practice guideline that primarily rec- ommends the use of FENO for diagnosis and treatment of asthma, and ATS suggests no eosinophil airway inflammation in patients with FENO <25, and eosinophil airway inflamma- tion and glucocorticoid responsiveness in patients with FENO
>50
8. Previously, several FENO-related studies have been performed in patients with COPD and ACO. In one study in- cluding patients with COPD, the FENO measurement was not helpful in COPD typing into eosinophilic or neutrophilic sub- type
9. In recent studies, FENO measurement has been useful to distinguish between ACO from COPD
10,11. However, the ex- act role of FENO in patients with established COPD remains unclear.
This study aimed to analyze the distribution of FENO levels and the clinical characteristics of high FENO in patients with COPD.
Materials and Methods
1. Patient population and study design
This study retrospectively reviewed patients over 40 years of age who underwent pulmonary function test (PFT) and FENO tests at Chonnam National University Hospital, Gwangju, Ko- rea, from December 2014 to June 2019. Among them, patients who were likely to be COPD were selected. These participants were defined according to the Global Initiative for Chronic Obstructive Lung Disease (GOLD) criterion, which is a ratio of forced expiratory volume in 1 second (FEV
1) to forced vital capacity (FVC) of <70% after bronchodilator use
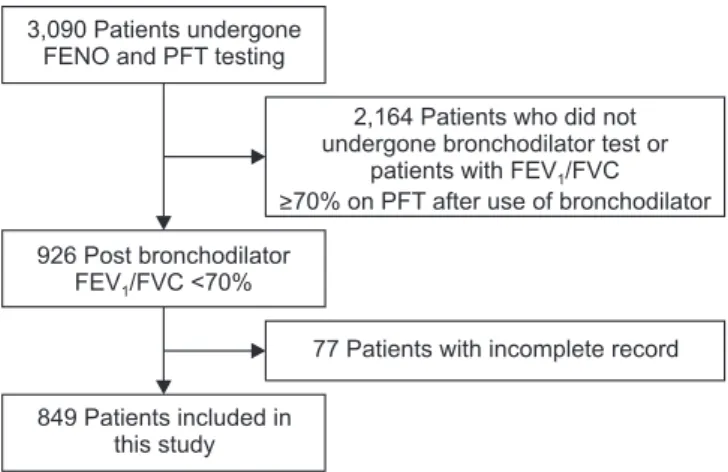
2. A total of 849 patients were enrolled. Study flow chart is shown in Fig- ure 1. This study protocol was approved by the Institutional Review Board of Chonnam National University Hospital (IRB number: CNUH-2016-196). The requirement of informed consent was waived because of the retrospective nature of the study. All the data, including FENO, PFT, and blood eosino- phil percent from participants, were estimated under stable conditions. Majority of the participants were examined on an
outpatient basis. Medical information and patients’ character- istics, including age, pack-years of tobacco use, smoking status, height, weight, body mass index, medical history, including asthma and bronchiectasis, and current inhaler components, were reviewed.
2. Pulmonary function test
PFTs were performed under stable conditions. PFTs were performed according to the ATS/European Respiratory So- ciety (ERS) guidelines
12. Parameters collected were FVC, FEV
1, percent predicted values of these parameters (% FVC, % FEV
1), and FEV
1/FVC ratio. All the parameters were checked after the use of bronchodilator. The severity rankings of COPD were according to the GOLD guideline
2. A positive broncho- dilator response (BDR) is defined as an increase of ≥12% and
≥200 mL as an absolute value compared with a baseline in the FEV
1.
3. FENO measurements
FENO measurements were performed using a device (NIOX MINO) by a trained measurer according to the standard op- erating procedures recommended by the manufacturer. The FENO levels were acquired from all participants under a sta- ble condition and expressed as parts per billion (ppb). Several cutoff values of FENO were proposed in recent studies
8,13-15. However, there is no clear cutoff value dividing high and low FENO levels. Hence, we divided patients with COPD into two groups by referring to the ATS guideline
8and have defined the group as “low FENO group” with FENO ≤25 and as “high FENO group” with FENO >25.
Figure 1. Study flow chart of patients in this study. FENO: fractional exhaled nitric oxide; PFT: pulmonary function test; FEV
1: forced expiratory volume in 1 second; FVC: forced vital capacity.
3,090 Patients undergone FENO and PFT testing
926 Post bronchodilator FEV /FVC <70%1
849 Patients included in this study
2,164 Patients who did not undergone bronchodilator test or
patients with FEV /FVC
>70% on PFT after use of bronchodilator
1
77 Patients with incomplete record
4. Statistical analyses
Means and standard deviations of quantitative variables or median and interquartile ranges were used. The relation- ship between blood eosinophil percent and FENO value was analyzed using Pearson’s correlation coefficients. Continuous variables were compared using the Student’s t test for those with normal distribution. The Pearson’s chi-square test was used to compare the categorical variables and the associated p-value was determined. Multivariable analysis using logistic regression model was performed to rule out the influence of each variable, which is meaningful in univariable analysis, and identify independent risk factors.
Statistical analyses were performed using SPSS version 25.0 (IBM, Armonk, NY, USA). p<0.05 indicated statistical signifi- cance.
Results
1. Prevalence
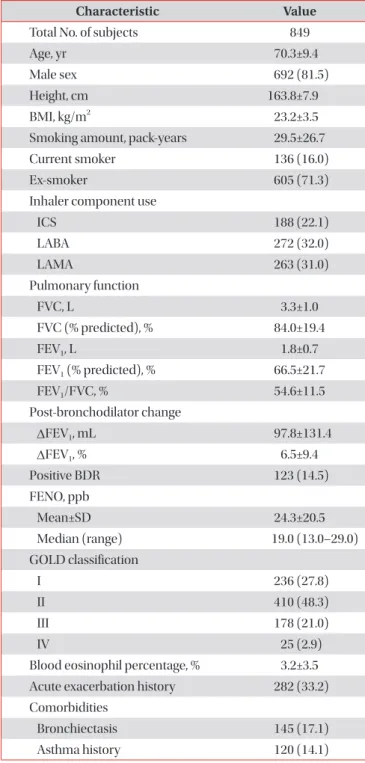
The patient characteristics in this study are summarized in Table 1. The mean value of FENO was 24.3±20.5 and median value of FENO was 19.0 (13.0–29.0). A subtotal of 692 of the 849 patients with COPD (81.5%) were males and 136 patients (16.0%) were current smokers. The mean FVC value was 3.3±1.0 L, and the mean % FVC value was slightly decreased (84.0±19.4). The mean FEV
1value was 1.8±0.7 L, and the mean % FEV
1value was significantly reduced (65.9±24.2). In the classification of FEV
1severity according to the GOLD clas- sification, 236 (27.8%), 410 (48.3%), 178 (21.0%), and 25 (2.9%) patients corresponded to GOLD I, GOLD II, GOLD III, and GOLD IV, respectively, with highest number of patients in the GOLD II group.
Long-acting β2-agonist was the most commonly used inhal- er component in 272 (32.0%) patients, long-acting muscarinic antagonist in 263 (22.5%), and inhaled corticosteroid (ICS) in 188 (22.1%). Mean eosinophil percent was 3.2±3.5 (%). Pa- tients with COPD and bronchiectasis were 145 (17.1%), and those with asthma history were 120 (14.1%).
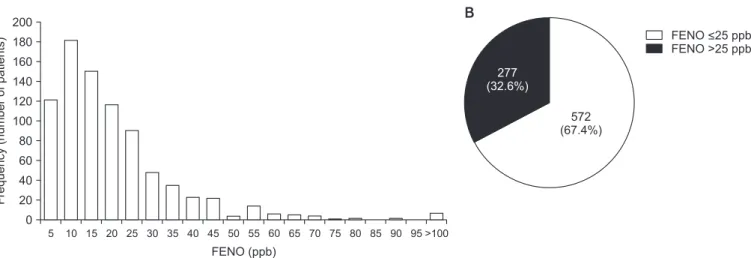
A histogram of the FENO levels distribution of 849 patients is shown in Figure 2A. Those with FENO ≤25 were 572 (68%) and FENO >25 were 277 (32%) (Figure 2B). FENO levels showed various distributions.
2. Correlation analysis of FENO in overall patients Overall, the association between FENO levels and eosino- phil percentage (%) was weakly positive with correlation coef- ficients at 0.224 (p<0.001). The results are shown in Figure 3.
Table 1. Characteristics of the subjects
Characteristic Value
Total No. of subjects 849
Age, yr 70.3±9.4
Male sex 692 (81.5)
Height, cm 163.8±7.9
BMI, kg/m
223.2±3.5
Smoking amount, pack-years 29.5±26.7
Current smoker 136 (16.0)
Ex-smoker 605 (71.3)
Inhaler component use
ICS 188 (22.1)
LABA 272 (32.0)
LAMA 263 (31.0)
Pulmonary function
FVC, L 3.3±1.0
FVC (% predicted), % 84.0±19.4
FEV
1, L 1.8±0.7
FEV
1(% predicted), % 66.5±21.7
FEV
1/FVC, % 54.6±11.5
Post-bronchodilator change
∆FEV
1, mL 97.8±131.4
∆FEV
1, % 6.5±9.4
Positive BDR 123 (14.5)
FENO, ppb
Mean±SD 24.3±20.5
Median (range) 19.0 (13.0–29.0)
GOLD classification
I 236 (27.8)
II 410 (48.3)
III 178 (21.0)
IV 25 (2.9)
Blood eosinophil percentage, % 3.2±3.5 Acute exacerbation history 282 (33.2) Comorbidities
Bronchiectasis 145 (17.1)
Asthma history 120 (14.1)
Values are presented as mean±standard deviation or number (%) unless otherwise indicated.
BMI: body mass index; ICS: inhaled corticosteroid; LABA: long- acting β2 agonists; LAMA: long-acting muscarinic antagonists;
FVC: forced vital capacity; FEV
1: forced expiratory volume in 1
second; ∆: change; BDR: bronchodilator response; FENO: fractional
exhaled nitric oxide; ppb: parts per billion; GOLD: Global Initiative
for Chronic Obstructive Lung Disease; acute exacerbation his-
tory: history treated with antibiotics or systemic steroid within one
year; asthma history: patient who once told the doctor that asthma
seemed to be present.
3. Comparison of low FENO group versus high FENO group
The comparison of clinical characteristics between low FENO group and high FENO group in this study is summa- rized in Table 2. Male sex was more frequent in the high FENO group than the low FENO group (86.6% vs. 79.0%, p=0.007).
Height was slightly higher in high FENO group than low FENO group (164.8±7.6 cm vs. 163.3±8.1 cm, p=0.006). Lung function was significantly lower in low FENO group (FVC [L], FEV
1[L], 3.2±1.0 vs. 3.5±0.9, p<0.001; 1.8±0.7 vs. 1.9±0.7, p=0.001) compared with high FENO group. Positive BDR was more frequent in high FENO group than low FENO group (19.5%
vs. 12.1%, p=0.004). Blood eosinophil percentage was signifi- cantly higher in high FENO group (4.2±4.8 vs. 2.7±2.5, p<0.001) than low FENO group. The frequency of patients with blood
eosinophils >3% was also significantly higher in high FENO group (46.9% vs. 34.8%, p=0.001) than low FENO group. Bron- chiectasis was less prevalent in the high FENO group (12.6%
vs. 19.2%, p=0.017) than low FENO group. Asthma history was much prevalent in the high FENO group (25.6% vs. 8.6%, p<0.001) compared with low FENO group.
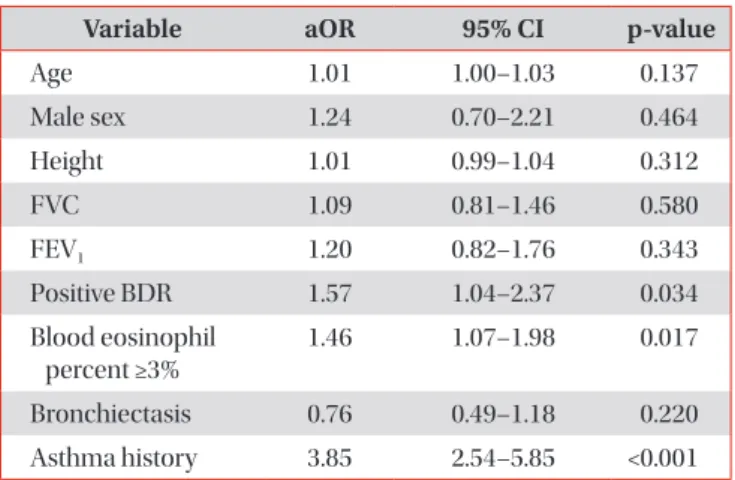
Multivariable analysis was performed to find independent factors, excluding mutual interference between each factor related to high FENO level. These results are summarized in Table 3. Asthma history, blood eosinophils >3%, and positive BDR were independent risk factors for high FENO level (ad- justed odds ratio [aOR], 3.85; p<0.001; aOR, 1.46; p=0.017; and aOR, 1.57; p=0.034, respectively). However, the association between high FENO and other factors (age, sex, height, lung function [FVC (L) and FEV
1(L)], and bronchiectasis) was not significant in multivariable analysis.
Discussion
Two recent Korean studies have reported normal ranges of FENO levels for the adult population. Kim et al.
16reported that mean FENO level in non-atopic males was 33.9±14.3, 37.3±12.1 in atopic males, 24.1±10.6 in non-atopic females, and 28.6±17.7 in atopic females. Jo et al.
17reported that mean and median FENO levels in healthy populations were 14.4±9.0, 13.0 (8–19). In two previous studies conducted in Korea, there was a large difference in normal FENO level. This difference in mean FENO levels may be attributed to two reasons; firstly, various confounding factors, including measurement tech- nique, exhalation flow rate, nasal nitric oxide contamination, the nitric oxide analyzer used, age, height, smoking status can affect FENO levels. Secondly, the somewhat smaller subjects of the previous two studies may have caused this difference.
Hence, it was difficult to compare the mean FENO level from
Bloodeosinophil(%)
0 40
30
20
10
FENO (ppb) 0
50 100 150 200 250 300
Blood eosinophil (%) Fitted value
r=0.224 p<0.001
Figure 3. Correlation analysis of fractional exhaled nitric oxide and blood eosinophil percentage (%). FENO: fractional exhaled nitric oxide; ppb: parts per billion.
FENO <25 ppb FENO >25 ppb 277
(32.6%)
572 (67.4%)
5 200 180 160 140 120 100 80 60 40 Frequency(numberofpatients) 20
FENO (ppb) 0
10 15 20 25 30 35 40 45 50 55 60 65 70 75 80 85 90 95 >100