Variation of Tocopherol Composition and Morphology in Soybean [ Glycine max (L.) Merr.]
Germplasms
Young-Jin Kim*, Young-Jin Oh*, Sang-Kyun Cho*, Mi-Ja Lee*, Kwang-Won Lee*, and Kee-Jong Kim*
†*Department of Rice and Winter Cereal Crops, NICS, RDA, Iksan 570-080, Korea
83
†
Corresponding author: (Phone) +82-63-840-2107 (E-mail) [email protected]
<Received 7 March, 2012; Revised 9 March, 2012; Accepted 13 March, 2012>
ABSTRACT In order to get information on tocopherol content and composition in fifty-six soybean germplasms were evaluated by HPLC. From the principle component analysis, the first three components accounted for 71.6% of the total variance of tocopherol content in the germplasms.
Principal component 1 showed significant correlations with all the morphological markers except 100-seed weight.
Soybean germplasms were divided into three groups by the first two principal components. The highest content of α -tocopherol was 38.6 μg per g in Tanner, while that of γ -tocopherol was 195.6 μg in PI 91073. In case of δ -tocopherol, IT 105622 showed the highest value as 29.8 μg. The contents of tocopherol were gradually increased from the late August to late September, which was 10 days before maturity, in Alchankong and PI 96322. The tocopherol content was higher in seeds from the plants sown early than those sown late. Total tocopherol contents of PI 96188, Geomjeongkong 2, and Suwon 183 grown in Gimje were higher than those grown in Iksan, but the difference was not observed in PI 96322. These results suggest that the contents of tocopherol in soybean were affected not only by the genotypes but also by environment.
Keywords : soybean, principle component, tocopherol content, HPLC
Tocopherols are a class of lipid-soluble antioxidants known collectively as vitamin E, which are essential in- gredients in human nutrition (Traber & Sies, 1996). Vitamin E is a powerful antioxidants that helps protect cells from the harmful unhealthy oxidative free radicals that can induce potentially damaging by-products of the body’s metabolism.
Clinical and epidemiological evidences suggest that vitamin E decreases the risk of cancer and cardiovascular and Alzheimer’s diseases, promotes immune system and circulatory function,
defense against light-induced eye and dermal pathologies, and prevents or slows various chronic degenerative diseases and premature aging (Pryor, 2000; WCRF, 1997). However, obtaining these therapeutic levels of vitamin E requires daily intake of vitamin E in excess of the recent Korean reco- mmended daily allowance of 10 mg α-tocopherol (KNS, 2000).
The vitamin E group consists of α-, β-, γ- and δ-tocopherols and four corresponding unsaturated derivatives, α-, β-, γ- and δ-tocotrienols. The four isoforms of tocopherols are synthesized in plants and other photosynthetic organisms.
The isoforms differ by the numbers and positions of methyl substitutes on the aromatic head group. Biosynthesis path- way of tocopherol in plant has been studied by Janiszowska
& Pennock (1976) and Hirschberg (1999). Munné-Bosch &
Alegre (2002) reviewed the function of tocopherols and tocotrienols in plants and emphasized advances in research over the last decade.
Seeds and oils of crops, especially soybean oils contain high content of tocopherols and they are good sources of vitamin E in human diet (Kwon & Brown, 1984). The major tocopherols found in the seeds and oils are γ- and α-tocopherols. The in vivo antioxidant activity of α-tocopherol is higher than that of the other isoforms and vitamin E activity of α-tocopherol is about 10-fold higher than that of its precursor γ-tocopherol (Fukuzawa et al., 1982; Kamal- Eldin & Appelqvist, 1996). The α- to γ-tocopherol ratios of soybean, sesame, and corn oils are about 0.09, 0.47, and 0.18, respectively, indicating composition of tocopherols in major oil crops is nutritionally poor (Sheppard & Pennington, 1993). The activity of natural-source vitamin E (dα-tocopherol) may be up to 100 percent greater than synthetic forms (dlα-).
Many researchers (Wolfgang, 1976; Carpenter, 1979; Speek
et al., 1985) have carried out the analysis of tocopherols in
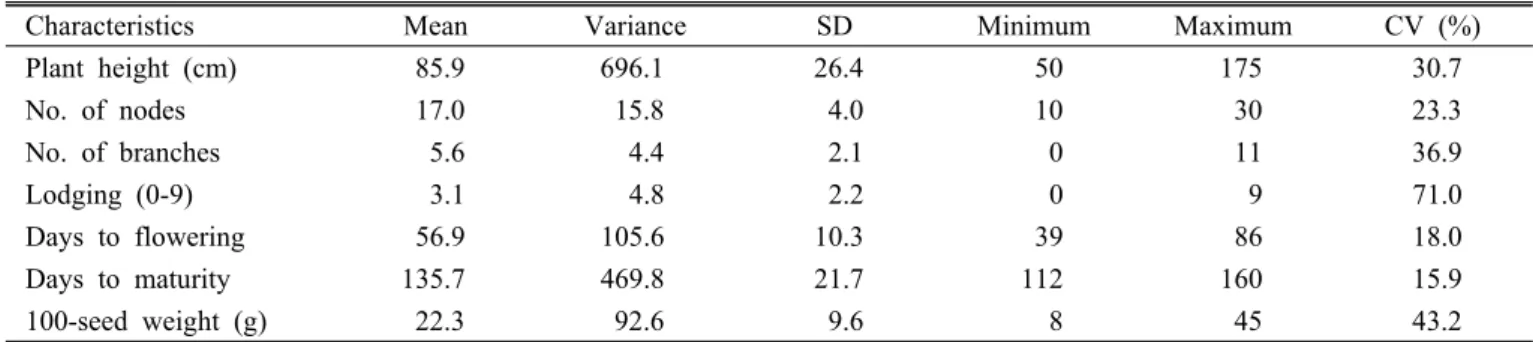
Table 1. Average values of agronomic characteristics of 56 soybean germplasms.
Characteristics Mean Variance SD Minimum Maximum CV (%)
Plant height (cm) 85.9 696.1 26.4 50 175 30.7
No. of nodes 17.0 15.8 4.0 10 30 23.3
No. of branches 5.6 4.4 2.1 0 11 36.9
Lodging (0-9) 3.1 4.8 2.2 0 9 71.0
Days to flowering 56.9 105.6 10.3 39 86 18.0
Days to maturity 135.7 469.8 21.7 112 160 15.9
100-seed weight (g) 22.3 92.6 9.6 8 45 43.2
oils by the high performance liquid chromatography (HPLC).
This experiment was conducted to get fundamental data required to develop soybean cultivars with high tocopherol contents and to analysis the relationship between the tocopherol contents and the major agronomic characters in the selected groups of soybean germplasms.
MATERIALS AND METHODS
Fifty-six soybean germplams (21 Korean cultivars, 13 domestics and 22 foreign varieties) were selected among 687 soybean germplams which were cultivated in Iksan.
The materials were selected to maximize variation on the bases of the previous morphological and genetic analyses (Kim et al., 1997). To know the effects of the seeding dates and growth locations on tocopherol contents, seeds (PI 96322, Geomjeongkong 2, Suwon 183, PI 96188) were sown in Iksan and Gimje experimental fields of Department of Rice and Winter Cereal Crops, National Institute of Crop Science (NICS) in the late May and June, respectively.
Seeds were planted with spacings between rows at 60 cm and between hills at 15 cm and 10 cm in Iksan (May 24) and Gimje (May 26 and June 28), respectively. Three seeds were sown per hill and thinned to one plant 15 days after emergence. The amount of fertilizer applied as basal application was 3, 3 and 3.4 kg 10 a
-1for N, P
2O
5and K
2O, respectively.
Seeds of soybean germplams grown at NICS and seeds of several varieties harvested at different seed growth stages and locations were used for tocopherol analysis.
Freeze-dried seeds were ground under liquid nitrogen into fine powder. The dry sample (2.5 g) was weighed into a 25 ml volumetric flask. The sample was brought to volume
with 1.5% iso-propyl alcohol in hexane and then vigorously mixed. The mixture was centrifuged at 10,000 rpm and the supernatant was used for tocopherol analysis. The isoforms of tocopherol were separated and determined according to the method of Carpenter (1979) using HPLC (Hitach Co., Japan) equipped with μ-porasil column (10 μm, 3.9 mm×300 mm) at room temperature. The UV detector (Hitach Co.) set at 280 nm was stabilized with mobile phase (1.5%
iso-propyl alcohol in hexane) at a flow rate of 1 ml/min.
Sample injection was made with a 50 ㎕ injector. Eluent was detected at 280 nm and chromatogram was recorded for 20 min. Standards for α-,γ- and δ-tocopherol were purchased from Sigma (USA) and the standard for each tocopherol was made up in 1.5% iso-propyl alcohol in hexane at the concentrations ranging from 50 to 500 ppm.
The experiment was laid out in a completely randomized design with 3 replications. Principal components analysis (PCA) was used to reduce dimensionality of variability in the germplasms. The scores of calculated variables were used to visualize germplasms in two demensional PCA scatter plots. PCA was performed using SPSS program (SPSS Inc., Chicago, Illinois, USA).
RESULTS AND DISCUSSION
Table 1 shows the average values of morphological charac- teristics among 56 soybean germplasms. The traits with higher CV values have larger genetic variations in the germplasms used.
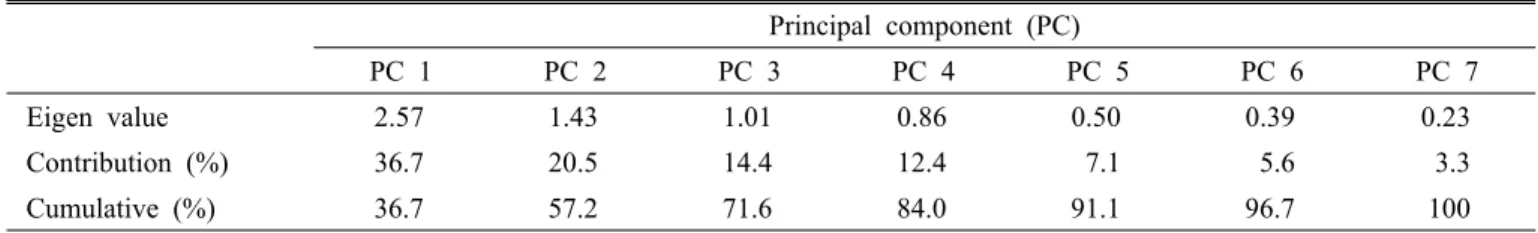
Eigen values and their contribution percentages obtained from PCA are listed in Table 2. Principal component 1 was composed of 2.57 characters and it contributed 36.7%
of the total variance. The first three major components
Table 2. Eigen values of principal components and their contribution.
Principal component (PC)
PC 1 PC 2 PC 3 PC 4 PC 5 PC 6 PC 7
Eigen value 2.57 1.43 1.01 0.86 0.50 0.39 0.23
Contribution (%) 36.7 20.5 14.4 12.4 7.1 5.6 3.3
Cumulative (%) 36.7 57.2 71.6 84.0 91.1 96.7 100
Table 3. Correlation coefficients between agronomic traits and principal component.
Characters Principal component (PC)
PC 1 PC 2 PC 3 PC 4 PC 5
Plant height 0.859
**-0.205 -0.020 0.111 0.307
*No. of nodes 0.695
**-0.570
**-0.067 -0.187
**-0.218
No. of branches 0.308
*-0.030 -0.890
**0.251 0.235
Lodging (0-9) 0.512
**0.052 0.386
**0.738
**0.117
Days to flowering 0.752
**0.085 0.116 -0.431
**0.253
Days to maturity 0.633
**0.565
**0.130 -0.155 0.245
100-seed weight (g) 0.155 0.860
**-0.201 0.012 -0.402
***
,
**: Significantly difference at 5% and 1% level, respectively.
-2 -1 0 1 2
-2 -1 0 1 2
P C.1
PC. 2
A
B
C
Fig. 1. Scatter diagram of 56 soybean germplasms by the first two principal components. A, high γ-tocopherol varieties; B, high total tocopherol varieties; C, high α -tocopherol varieties.
accounted for 71.6% of the total variance (Table 2).
Correlations between morphological markers and principle components were analyzed. Principal component 1 showed significant correlation with all morphological markers except 100-seed weight. Plant height and days to flowering among 7 characters were the largest contributors for classi- fication (Table 3). Similar results were observed by Kim et al. (1999).
The scatter diagram was made with the first two principal components (Fig. 1). The relationship between morphological characters and tocopherol content of soybean seeds was considered. Group A was consisted of genotypes the high γ-tocopherol seeds and showed early flowering, short plant height and small seed weight. Group B was consisted of the seeds with high total tocopherol content, while group C was belonged to the high α-tocopherol seeds and late flowering, long plant height, many nodes and weak to lodging.
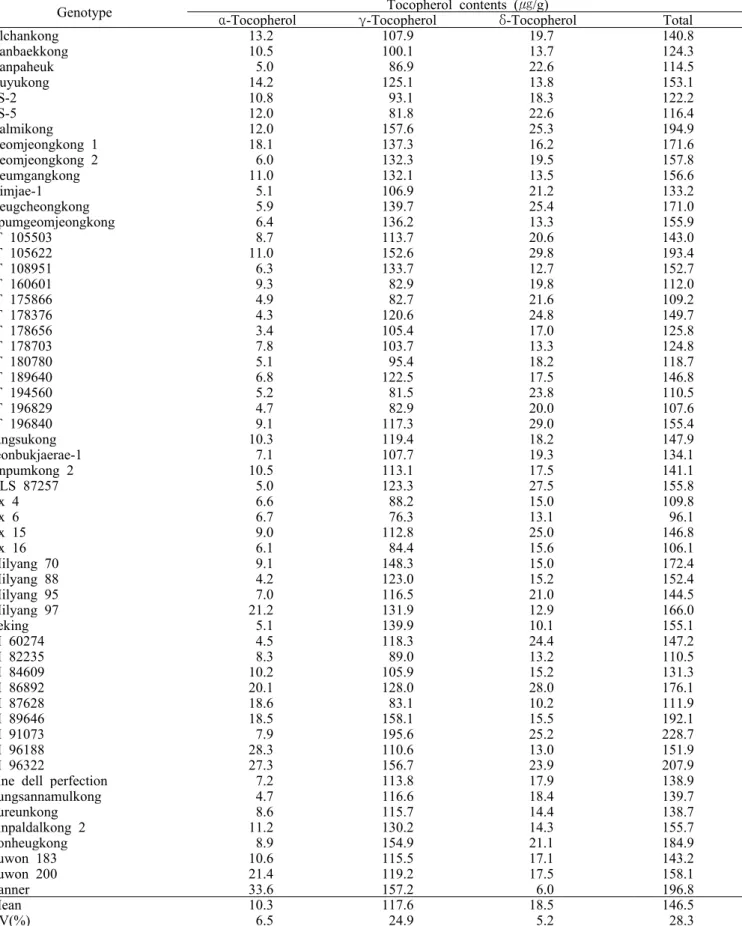
Among 56 soybean genotypes content of α-tocopherol was highest in Tanner as 33.6 μg/g, while that of γ-tocopherol in PI 91073 as 195.6 μg/g. Content of δ-tocopherol was highest in IT 105622 as 29.8 μg (Table 4). δ-Tocopherol
is synthesized at the earliest of biosynthesis pathway and α-tocopherol is a final type at the process of biosynthesis in plant. An increase in α-tocopherol is generally associated with improved stress tolerance especially, protection against water deficit (Moran et al., 1994), UV-B radiation (DeLong
& Steffen 1997), salt stress (Gossett et al., 1994), chilling
Table 4. Tocopherol contents in seeds of 56 soybean genotypes.
Genotype Tocopherol contents (㎍/g)
α -Tocopherol γ -Tocopherol δ -Tocopherol Total
Alchankong 13.2 107.9 19.7 140.8
Danbaekkong 10.5 100.1 13.7 124.3
Danpaheuk 5.0 86.9 22.6 114.5
Duyukong 14.2 125.1 13.8 153.1
FS-2 10.8 93.1 18.3 122.2
FS-5 12.0 81.8 22.6 116.4
Galmikong 12.0 157.6 25.3 194.9
Geomjeongkong 1 18.1 137.3 16.2 171.6
Geomjeongkong 2 6.0 132.3 19.5 157.8
Geumgangkong 11.0 132.1 13.5 156.6
Gimjae-1 5.1 106.9 21.2 133.2
Heugcheongkong 5.9 139.7 25.4 171.0
Ilpumgeomjeongkong 6.4 136.2 13.3 155.9
IT 105503 8.7 113.7 20.6 143.0
IT 105622 11.0 152.6 29.8 193.4
IT 108951 6.3 133.7 12.7 152.7
IT 160601 9.3 82.9 19.8 112.0
IT 175866 4.9 82.7 21.6 109.2
IT 178376 4.3 120.6 24.8 149.7
IT 178656 3.4 105.4 17.0 125.8
IT 178703 7.8 103.7 13.3 124.8
IT 180780 5.1 95.4 18.2 118.7
IT 189640 6.8 122.5 17.5 146.8
IT 194560 5.2 81.5 23.8 110.5
IT 196829 4.7 82.9 20.0 107.6
IT 196840 9.1 117.3 29.0 155.4
Jangsukong 10.3 119.4 18.2 147.9
Jeonbukjaerae-1 7.1 107.7 19.3 134.1
Jinpumkong 2 10.5 113.1 17.5 141.1
KLS 87257 5.0 123.3 27.5 155.8
Lx 4 6.6 88.2 15.0 109.8
Lx 6 6.7 76.3 13.1 96.1
Lx 15 9.0 112.8 25.0 146.8
Lx 16 6.1 84.4 15.6 106.1
Milyang 70 9.1 148.3 15.0 172.4
Milyang 88 4.2 123.0 15.2 152.4
Milyang 95 7.0 116.5 21.0 144.5
Milyang 97 21.2 131.9 12.9 166.0
Peking 5.1 139.9 10.1 155.1
PI 60274 4.5 118.3 24.4 147.2
PI 82235 8.3 89.0 13.2 110.5
PI 84609 10.2 105.9 15.2 131.3
PI 86892 20.1 128.0 28.0 176.1
PI 87628 18.6 83.1 10.2 111.9
PI 89646 18.5 158.1 15.5 192.1
PI 91073 7.9 195.6 25.2 228.7
PI 96188 28.3 110.6 13.0 151.9
PI 96322 27.3 156.7 23.9 207.9
Pine dell perfection 7.2 113.8 17.9 138.9
Pungsannamulkong 4.7 116.6 18.4 139.7
Pureunkong 8.6 115.7 14.4 138.7
Sinpaldalkong 2 11.2 130.2 14.3 155.7
Sonheugkong 8.9 154.9 21.1 184.9
Suwon 183 10.6 115.5 17.1 143.2
Suwon 200 21.4 119.2 17.5 158.1
Tanner 33.6 157.2 6.0 196.8
Mean 10.3 117.6 18.5 146.5
CV(%) 6.5 24.9 5.2 28.3
Fig. 2. Changes of tocopherols in developing soybean seeds.
0 40 80 120 160 200
α γ δ
PI 96322 T oco ph ero l co n te n ts ( ㎍ /g )
May 24, Iksan May 26, Gimje June 28, Gimje
0 40 80 120 160 200
α γ δ
Geomjeongkong 2 T oco ph ero l co n te n ts ( ㎍ /g )
May 24, Iksan May 26, Gimje June 28, Gimje
0 40 80 120 160
α γ δ
Suwon 183
T oco ph ero l co n te n ts ( ㎍ /g )
May 24, Iksan May 26, Gimje June 28, Gimje
0 40 80 120 160 200
α γ δ
PI 96188 T oc op hero l co n ten ts ( ㎍ /g )
May 24, IksanMay 26, Gimje June 28, Gimje