Isoflavones in soybean are called natural phytoestrogens because they have a structure and efficacy similar to estro- gen, a female hormone. Several studies have shown that soybean isoflavones have effects on bone health, anticancer and antioxidant activities (Peterson, 1995; Uesugi et al., 2002; Messina, 2014). In particular, consumption of various soybean food products has been recommended, considering the bioactivity of isoflavone in relieving menopausal syn- drome in women, and in physiological activations that pre- vent osteoporosis and reduce blood cholesterol. Recently,
as the interest in soybean isoflavone has increased, its products were developed into various types such as dietary supplements, cosmetics, and beverages for health purposes, and are now commercially available in the market.
Soy-isoflavone is a flavonoid compound that exists in the form of 12 chemical structures, including the aglycone forms (daidzein, glycitein and genistein), the glucoside derivatives (daidzin, glycitin, genistin), the glucosides with malonyl-esters (6’’-O-malonyldaidzin, 6’’-O-malonylgenistin, 6’’-O-malonylglycitin) and the glucosides with acetyl-esters
Quantitative Variation of Total Seed Isoflavone and its Compositions in Korean Soybean Cultivars (Glycine max (L.) Merr.)
Hong-Sik Kim
1,†, Beom-Kyu Kang
2, Jeong-Hyun Seo
2, Tae-Joung Ha
1, Hyun-Tae Kim
2, Sang-Ouk Shin
2, Chang-Hwan Park
3, and Do-Yeon Kwak
1ABSTRACT The variation of content of 12 soybean seed isoflavone components was determined in the aglycone, glucoside, malonylglucoside and acetylglucoside groups of 44 Korean soybean cultivars grown in 2016 as well as in 2017. The total isoflavone content of the 44 cultivars averaged at 2935.4 ㎍/g and was in the range of 950.6 to 5226.3 ㎍/g for two years.
Malonylglucoside group averaged at 2437.2 ㎍/g with the highest proportion of isoflavone composition (83.0%). Significant differences were observed between cultivars, years and their interactions for both the total isoflavone and each composition group contents (P < 0.0001); however, no year-wise differences were observed for daidzein and genistin. The broad-sense heritability (h
2) within the set of 44 Korean soybean cultivars was as high as 0.93 for the total isoflavone content and was in the range of 0.8 – 0.92 for each composition group of isoflavone except for acetylglucoside. The total isoflavone content in cultivar group for soy-sprout was higher (3850.4 ㎍/g) than that for the other cultivar groups of soy-paste and tofu (3082.8 ㎍/g), black or green soybean cooked with rice (2345.8 ㎍/g), and early maturity group (1298.6 ㎍/g). The total isoflavone content of ‘Sowonkong’, a soybean cultivar for soy-sprout, was the highest (5226.3 ㎍/g). In the cultivar group for soy-paste and tofu, the average isoflavone contents of ‘Daepung’, ‘Daepung2ho’, ‘Saegeum’, ‘Uram’, and ‘Jinpung’ were higher than 4000 ㎍/g. With the exception of small seeded cultivars with low isoflavone contents such as ‘Sohwang’ and ‘Socheongja’, the seed size and total isoflavone content were significantly negatively correlated in 2016 and 2017, respectively (r = -0.47
**and -0.49
**). The number of days of growth from flowering to maturity did not affect the variations observed in isoflavone content.
Keywords : acetylglucoside, aglycone, glucoside, heritability, isoflavone, malonylglucoside, soybean, variation
DOI : https://doi.org/10.7740/kjcs.2019.64.2.089Original Research Article
ⓒ 본 학회지의 저작권은 한국작물학회지에 있으며, 이의 무단전재나 복제를 금합니다.
This is an Open-Access article distributed under the terms of the Creative Commons Attribution Non-Commercial License (http://creativecommons.org/licenses/by-nc/3.0) which permits unrestricted non-commercial use, distribution, and reproduction in any medium, provided the original work is properly cited.
1)
Senior Researcher, Upland Crop Breeding Research Division, Department of Southern Area Crop Science, National Institute of Crop Science, RDA, Miryang 50424, Republic of Korea
2)
Researcher, Upland Crop Breeding Research Division, Department of Southern Area Crop Science, National Institute of Crop Science, RDA, Miryang 50424, Republic of Korea
3)
Senior Researcher, Crop Post-harvest Technology Division, Department of Central Area Crop Science, National Institute of Crop Science, RDA, Suwon 16429, Republic of Korea
†
Corresponding author: Hong-Sik Kim; (Phone) +82-55-350-1226; (E-mail) [email protected]
<Received 23 April, 2019; Revised 10 June, 2019; Accepted 18 June, 2019>
(6’’-O-acetyldaidzin, 6’’-O-acetylgenistin, 6’’-O-acetylglycitin) (Yu & McGonigle, 2005). While the aglycone forms of isoflavones exist in small quantities, isoflavones in the glucoside forms are dominant quantitatively. Specifically, the malonylglucosides are the highest proportion of the soy isoflavones (Kim et al., 2018; Ahmad et al., 2017).
Isoflavones in the form of glucosides are inactive, and are known to be absorbed more rapidly in the body when converted to the aglycone form through hydrolysis meta- bolism by intestinal microbiota in the human digestive tract (Izumi et al., 2000). Soy-isoflavone content and bio- activity were mainly investigated in earlier studies focusing on the aglycone forms of isoflavones such as daidzein and genistein (Shin et al., 2006; Omoni & Aluko, 2005). In recent years, researches have been underway to complement the absorption efficiency by converting isoflavones in the form of glucoside into aglycone through microbial enzyme process (Kim et al., 2014; Kim et al., 2010).
A wide range of isoflavone contents in soybean cultivars has been reported in food sources such as soy-milk and soy-paste (Kim et al., 2018; Lee et al., 2016; Park et al., 2012; Choung et al., 2006). It was known that 90% of the total isoflavones in soybean seeds were distributed in cotyledon, while the rest in hypocotyl areas (Tsukamoto et al., 1995). The content of total isoflavones present in soy- bean seeds varies by cultivars and genetic resources, from less than 300 ㎍/g to more than 3000 ㎍/g. According to Kim et al. (2018), the total isoflavone contents for 172 soybean varieties developed in Korea from 1913 to 2013 were 206.3 to 2666.2 ㎍/g. Park et al. (2012) also found that the total isoflavones ranged from 527.9 to 3436.5 ㎍/g for 106 soybean cultivars released in Korea from 1913 to 2006. Choung et al. (2006) analyzed 43 major Korean soybean cultivars for aglycone isoflavone content indicating 277 to 2002 ㎍/g. The isoflavone content of soybeans grown overseas in the U.S. and other countries also varies, indicating the range of 880 to 4220 ㎍/g, 683 to 2441 ㎍/g, and 570 to 1880 ㎍/g for the U.S, Chinese, and Brazilian cultivars, respectively (Xu & Chang, 2008; Wang & Murphy, 1994; Chung et al., 2008; Genoverse et al., 2005).
The development of soybean cultivars in Korea has been specialized for traditional food processing and cropping system applications such as soy-sauce and paste, tofu, soy-
sprouts, cooking with rice and short-term cropping properties.
With recent market trends towards health functional property, new soybean cultivars are required to create new demand.
The objective of this study was to determine the variation of contents of 12 soybean seed isoflavone components in the aglycone, glucoside, malonylglucoside and acetyglucoside groups and to select for the optimum source of soy-isoflavone in the 44 Korean soybean cultivars. These cultivars were developed by the National Institute of Crop Science (NICS) of the Rural Development Administration (RDA), Republic of Korea. Considering the genetic and environmental factors affecting the contents of the total isoflavones and 12 com- ponents among the soybean cultivars, the possibility to improve soy-isoflavones in the soybean breeding programs was reviewed in this study.
MATERIALS AND METHODS Plant materials
In this study, 44 soybean cultivars were used, which included recently developed new cultivars and the cultivars known to have isoflavone content at the time of their release. These cultivars were classified by their end-uses : 17 cultivars for soy-paste and tofu, 13 cultivars for soy- sprouts, 8 cultivars for cooking with rice, 4 cultivars for cropping system, and 2 for vegetable soybeans (Table 1).
They were grown in each of 2016 and 2017 with planting on June 14, 2016 and on June 19, 2017 at the Daegu experimental field site in the Department of Southern Area Crop Science, NICS, RDA in Habin-myeon, Dalseong-gun, Gyeongsangbuk-do, Republic of Korea.
Seeds of individual cultivars were planted in rows 4 m long, 0.7 m apart and with a space of 15 cm between plants. The plants were thinned to two plants/hill to main- tain a uniform density at 14 days after planting in the plots.
Fertilizers were applied at a ratio of N : P
2O
5: K
2O = 3 :
3 : 3.4 kg/10a, and other field management was conducted
in accordance with the RDA’s standard cultivation
protocols. Soybean cultivars were completely randomized
in the plots, and two and three replicates for individual
cultivars in 2016 and in 2017, respectively were applied to
analysis. Number of days to flowering and/or maturity
from planting were examined for individual cultivars in
Table 1. List of 44 Korean soybean cultivars classified by their end-uses.
No. Name End-use Year Flower
color
†Seedcoat color
§100-seed wt.(g)
1 Taekwangkong Soy-paste & Tofu 1991 P Y 25.3
2 Shinpaldalkong#2 Soy-paste & Tofu 1992 W Y 19.5
3 Danbaegkong Soy-paste & Tofu 1993 P Y 13.9
4 Jinpumkong#2 Soy-paste & Tofu 1996 P Y 22.0
5 Daewonkong Soy-paste & Tofu 1997 W Y 25.6
6 Daepung Soy-paste & Tofu 2002 W Y 20.7
7 Daemang#2 Soy-paste & Tofu 2005 W PG 25.3
8 Saedanbaek Soy-paste & Tofu 2010 W Y 20.7
9 Uram Soy-paste & Tofu 2010 W Y 25.8
10 Neulchan Soy-paste & Tofu 2011 W Y 21.7
11 Jinpung Soy-paste & Tofu 2012 P Y 23.0
12 Taeseon Soy-paste & Tofu 2013 P Y 22.2
13 Seonpung Soy-paste & Tofu 2013 W Y 25.9
14 Saegeum Soy-paste & Tofu 2013 W Y 25.4
15 Daepung2ho Soy-paste & Tofu 2014 W Y 20.9
16 Daechan Soy-paste & Tofu 2014 W Y 24.5
17 Miso Soy-paste & Tofu 2014 W Y 28.2
18 Pungsannamulkong Soy-sprout 1996 P Y 10.1
19 Sowonkong Soy-sprout 1999 P Y 9.3
20 Sorog Soy-sprout 2001 P PG 11.9
21 Bosug Soy-sprout 2003 P Y 8.6
22 Jangki Soy-sprout 2005 P Y 11.9
23 Pungwon Soy-sprout 2006 W Y 10.9
24 Sinhwa Soy-sprout 2007 P Y 12.1
25 Wongwang Soy-sprout 2007 P Y 10.9
26 Sohwang Soy-sprout 2008 P Y 8.5
27 Haepum Soy-sprout 2012 W Y 10.4
28 Haewon Soy-sprout 2014 P Y 8.1
29 Soyeon Soy-sprout 2015 W Y 10.1
30 Aram Soy-sprout 2016 P Y 9.9
31 Cheongja#3 Cooked w/ rice & others 2004 P B 32.1
32 Ilpumgeomjeong#2 Cooked w/ rice & others 2005 P B 25.0
33 Socheong Cooked w/ rice & others 2006 W B 15.7
34 Socheong2 Cooked w/ rice & others 2009 W B 12.2
35 Cheongmiin Cooked w/ rice & others 2013 W G 34.3
36 Socheongja Cooked w/ rice & others 2014 W B 12.0
37 Cheongja4 Cooked w/ rice & others 2015 P B 30.1
38 Taecheong Cooked w/ rice & others 2016 P B 44.5
39 Saeolkong Cropping system 1998 W Y 25.2
40 Danmi#2 Vegetable 2005 W PG 30.6
41 Nogwon Vegetable 2006 W PG 30.6
42 Hwangkeumol Cropping system 2010 W Y 28.6
43 Chamol Cropping system 2011 W Y 27.7
44 Duruol Cropping system 2014 W Y 27.7
†
flower color : P purple, W white
§
Seedcoat color : Y yellow, B black, G green, PG pale green
each year. The harvested seeds were dried for 3 days, threshed, and then selected for analysis. The trait of 100- seed weight of individual cultivars was measured by three repetitions.
Determination of contents of soybean isoflavone components
Soybean seed samples were crushed to 100-mesh size without breaking the seed coat with vibrating sample mill (T1-100 model, CMT Co Ltd., Tokyo Japan) and stored in a 4 °C refrigerator for isoflavone analysis. Standards of daidzein, glycitein, genistein, daidzin, glycitin and genistin were purchased from Sigma (St. Louis, MO, USA). Other standards of 6"-O-malonyldaidzin, 6"-O-malonylglycitin, 6"- O-malonylgenistin, 6"-O-acetyldaidzin, 6"-O-acetylglycitin and 6"-O-acetylgenistin were used and purchased from Nacalai Tesque INC. (Kyoto, Japan).
For the analysis of soybean isoflavone, 20 mL of 50%
methanol was added to 1.0 g of seed pulverized sample and stirred for 24 hours at 250 rpm to elute the isoflavone.
After the extraction was completed, the samples were allowed to be left unattended for one hour at room temperature and the supernatant was taken and filtered again with a filter paper (No. 1 Whatman) and the 1 mL of the filtered solution was filtered through a 0.2 μm syringe filter and used as an analysis sample for HPLC.
HPLC analysis was conducted using Dionex Ultimate 3000 (Thermo, USA). HPLC column was LiChrospher RP-C18 (5 μm, 125×4.0 mm). The 10 ㎕ filtrate of sample was injected to HPLC and analyzed with mobile phase (H
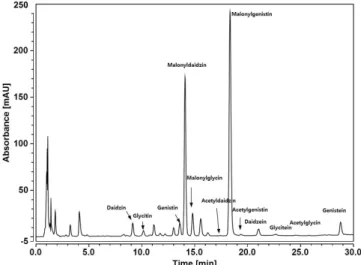
2O (0.1% acetic acid) and acetonitrile (0.1% acetic acid)) at a flow rate of 1.0 mL/min. The detection wavelength was UV 260 nm and the column temperature was limited to 30°C. Isoflavone compositions in soybean seeds were separated according to the retention time (Fig. 1). To calculate the standard calibration curve for quantitative analysis of isoflavones, each of 12 standard substances was dissolved in a methanol containing 1% dimethylsulfoxide (DMSO) and diluted to prepare for 50, 40, 30, 25, 20, 10 μg/ml, respectively. The standard of isoflavone components for each prepared concentration was calculated by the calibration equation derived from the corresponding peak area through the HPLC chromatogram under the same
condition. For all standard reference materials, the standard calibration curves showed high linearity (R
2> 0.997).
Statistical analysis
Analysis of variance (ANOVA) of the isoflavone data across multiple year environments was performed using the general linear model (PROC GLM) in SAS 9.4 (SAS Institute Inc., USA). This linear model had the effect of environment of year, replication, genotype, and environment x genotype interaction. Variance components were determined in ANOVA to estimate heritability in broad-sense. Com- parisons between means of cultivars for each isoflavone component were made using LSDs at a 0.05 probability level. Pearson correlation was calculated with PROC CORR in SAS 9.4 (SAS Institute Inc., USA) to determine the relationship among the same pairs of variables of agronomic traits and isoflavone components.
Broad-sense heritability (h
2) was estimated for the contents of the total isoflavone and its 12 components by using the following formula (Toker, 2004):
phenotypic variance (
) :
,
where y, g, and r are number of year, genotype and replication, respectively;
,
and
are the components of variance for genotypes, genotype x year and error, respectively. Broad-sense heritability (h
2) was calculated as
Fig. 1. HPLC chromatogram showing the 12 components of
soybean isoflavone.
genotypic variance/phenotypic variance :
h gp
RESULTS AND DISCUSSION
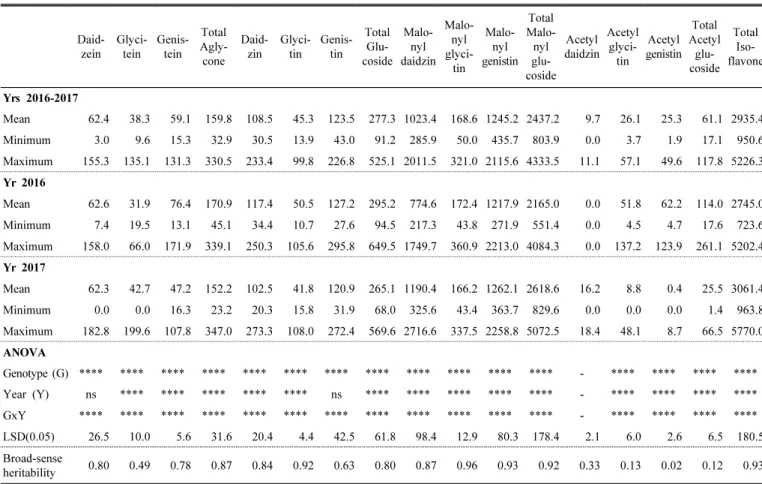
Distribution of total isoflavones and their compositions Table 2 shows the results of the total isoflavone content as well as the mean, minimum and maximum values of the isoflavone contents of the 12 composition groups for all 44 soybean cultivars in each growing year or over both 2016 and 2017. The total isoflavone content of the 44 cultivars averaged at 2935.4 ㎍/g and was in the range of 950.6 to 5226.3 ㎍/g over the two years. The isoflavone content of seeds harvested in 2016 averaged at 2745.0 ㎍/g and ranged from 723.6 to 5202.4 ㎍/g. For 2017, the average was 3061.4 ㎍/g and 963.8 to 5770.0 ㎍/g. The
content of isoflavones increased by about 11.5% on average in 2017 as compared to 2016.
The average contents in 2016 –2017 were analyzed for the four composition groups of isoflavones such as aglycone, glucoside, malonylglucoside, and acetylglucoside : the average amount of malonylglucoside group was 2437.2 ㎍/g with the highest proportion of isoflavone composition (83.0%) and ranges from 803.9 –4333.5 ㎍/g. The other groups of isoflavone were small in contents in order of glucoside groups (average of 277.3 ㎍/g, range of 91.2 to 525.1 ㎍/g)
> aglycone groups (average of 159.8 ㎍/g, range of 32.9 to 330.5 ㎍/g) > acetylglucoside group (average of 61.1 ㎍ /g, range of 17.1 to 117.8 ㎍/g). The tendency of variation in the contents of isoflavone composition groups was similar in each year. The malonylglucoside group showed the highest level with 78.9 –85.5% and the acetylglucoside group had the lowest level with 0.8 –4.1%.
Table 2. Total isoflavone content as well as the mean, minimum and maximum values of the isoflavone contents of the 12 composition components for all 44 soybean cultivars in each growing year or over 2016 –2017.
Daid- zein
Glyci- tein
Genis- tein
Total Agly- cone
Daid- zin
Glyci- tin
Genis- tin
Total Glu- coside
Malo- nyl daidzin
Malo- nyl glyci-
tin Malo-
nyl genistin
Total Malo- nyl glu- coside
Acetyl daidzin
Acetyl glyci- tin
Acetyl genistin
Total Acetyl
glu- coside
Total Iso- flavone
Yrs 2016-2017
Mean 62.4 38.3 59.1 159.8 108.5 45.3 123.5 277.3 1023.4 168.6 1245.2 2437.2 9.7 26.1 25.3 61.1 2935.4 Minimum 3.0 9.6 15.3 32.9 30.5 13.9 43.0 91.2 285.9 50.0 435.7 803.9 0.0 3.7 1.9 17.1 950.6 Maximum 155.3 135.1 131.3 330.5 233.4 99.8 226.8 525.1 2011.5 321.0 2115.6 4333.5 11.1 57.1 49.6 117.8 5226.3 Yr 2016
Mean 62.6 31.9 76.4 170.9 117.4 50.5 127.2 295.2 774.6 172.4 1217.9 2165.0 0.0 51.8 62.2 114.0 2745.0 Minimum 7.4 19.5 13.1 45.1 34.4 10.7 27.6 94.5 217.3 43.8 271.9 551.4 0.0 4.5 4.7 17.6 723.6 Maximum 158.0 66.0 171.9 339.1 250.3 105.6 295.8 649.5 1749.7 360.9 2213.0 4084.3 0.0 137.2 123.9 261.1 5202.4 Yr 2017
Mean 62.3 42.7 47.2 152.2 102.5 41.8 120.9 265.1 1190.4 166.2 1262.1 2618.6 16.2 8.8 0.4 25.5 3061.4 Minimum 0.0 0.0 16.3 23.2 20.3 15.8 31.9 68.0 325.6 43.4 363.7 829.6 0.0 0.0 0.0 1.4 963.8 Maximum 182.8 199.6 107.8 347.0 273.3 108.0 272.4 569.6 2716.6 337.5 2258.8 5072.5 18.4 48.1 8.7 66.5 5770.0 ANOVA
Genotype (G) **** **** **** **** **** **** **** **** **** **** **** **** - **** **** **** ****
Year (Y) ns **** **** **** **** **** ns **** **** **** **** **** - **** **** **** ****
GxY **** **** **** **** **** **** **** **** **** **** **** **** - **** **** **** ****
LSD(0.05) 26.5 10.0 5.6 31.6 20.4 4.4 42.5 61.8 98.4 12.9 80.3 178.4 2.1 6.0 2.6 6.5 180.5 Broad-sense
heritability 0.80 0.49 0.78 0.87 0.84 0.92 0.63 0.80 0.87 0.96 0.93 0.92 0.33 0.13 0.02 0.12 0.93
*, **, ***, **** statistically significant at p < 0.05, p < 0.01, p < 0.001, and p < 0.0001, respectively. ns - not significantly
different.
When comparing the content by isoflavone type, the malonylglucoside group was the major constituent of soybean isoflavone, and specifically, the highest ratio of malonylgenistin content was observed in the malonyl- glucoside group, which was almost similar to the previous results (Lee et al., 2018; Kim et al., 2018). The average contents of genistein and daidzein, known to have high bio-activity among the aglycone components, were almost the same level with 59.1 ㎍/g and 62.4 ㎍/g, respectively, accounting for about 2% of the total isoflavone content. In contrast, glycitein had an average of 38.3 ㎍/g for over two years, which was relatively small in the aglycone composition. Choung et al. (2006) also found that the proportions of daidzein and genistein in the aglycone form were almost similar with each other in Korean soybean genetic resources except for the early-matured cultivars. A similar trend was notable with the small difference between daidzin and genistin components for the glucoside and malonylglucoside groups as well as the aglycone except for the acetylglucoside (Table 2). Even in the group of malonylglucoside with the highest rate of isoflavone composition, malonylglycitin was shown to be less than malonylgenistin and malonyldaidzin in the isoflavone com- position ratio. Acetylglucoside group was present in very small amounts in each composition and could not be analyzed in the study. In particular, acetyldaidzin was rarely detected in the seed samples produced in 2016.
Analysis of variance of isoflavone contents
Analysis of variance (ANOVA) for the content of total isoflavones and 12 composition components for the 44 soybean cultivars developed by NICS, RDA showed highly significant differences among the cultivars (P < 0.0001) (Table 2). Environmental effects between years were signi- ficant for the contents of isoflavone group components except daidzein and genistin. The interactions of genotypes with cropping years were also significant in total isoflavone content and its components. This indicates that variation of soybean isoflavone levels is affected by all genotypic, environmental and g x e interaction effects. According to Hoeck et al. (2000), even a single cultivar might have a 1.7-fold difference in single cultivation conditions.
Heritability is an estimate of the genetic difference
contributed to the phenotypic variation. As seen in Table 2, the estimated heritability (h
2) in a broad-sense ranged 0.8 –0.93 for the total isoflavone and its components except for the lowest acetylglucoside group. Considering variation due to environmental factors over years, the estimates of heritability were high within the set of 44 Korean soybean cultivars. According to ANOVA in this study, genotypic variance contributing to the observed variability of the levels of isoflavone components was greater than the variances of nonheritable components of environment and g x e interactions (data not shown). Overall, this result suggests that isoflavone content in soybean seed is influenced by genetic and environmental factors, and that the magnitude of each contribution of variance components to phenotypical expression is different. In the present study, difference between cultivars due to genetic factors in isoflavone content are large as compared with environ- mental variation and interactions with cultivars, and hence the heritability can be expected to increase. According to Seker et al. (2014), heritability estimate increased as the difference between the values of genotypic and phenotypic variance in percentage of mean decreased for a target trait.
The heritability estimate of malonylglucoside components was relatively high with the range of 0.87 –0.96. Unlike other component groups, heritability of acetylglucoside group was low due to a greatly significant g x e interaction and yearly variation as well as its low detection level of composition. The results were almost similar to the high range of heritability values for the soybean isoflavone content in the former studies (Gutierrez-Gonzalez et al., 2009; Chiari et al., 2004). Gutierrez-Gonzalez et al. (2009) found that heritability values of genistein, daidzein and total isoflavone were 0.83, 0.86 and 0.86, respectively, except glycitein (0.43) in the genetic analysis of isoflavone content using F
7-derived RIL population of Essex × PI 437654. In addition to the existing results, high heritability values in this study indicates that selection for high isoflavone on the individual plant base might be allowed in the early breeding generations (Chiari et al., 2004).
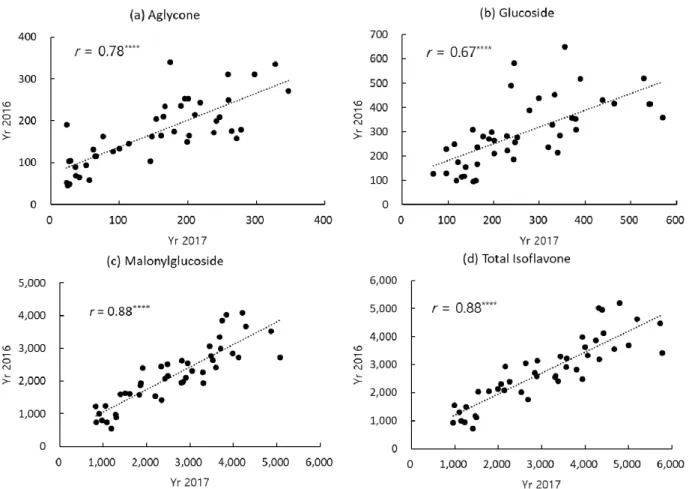
The correlations of 44 Korean soybean cultivars for the
contents of total isoflavone and three composition groups
(aglycone, glucoside and malonylglucoside) between two
cropping years of 2016 –2017 were highly significant
except for acetylglucoside group (r = 0.15
ns) (Fig. 2). The correlations for total isoflavone and malonylglucoside group contents were similar each other (r = 0.88
****) between 2016 and 2017. On the other hand, correlations for the contents of aglycone and glucoside group were lower than malonylglucoside, but all statistically significant with r = 0.78
****and 0.67
****, respectively. This result of high correlation among the soybean cultivars over the two years suggests that some cultivars have relatively consistent level of high or low isoflavone contents controlled pre- dominantly by the genetic factors rather than environmental factors as shown in the heritability results for isoflavone content.
Variation of isoflavone contents by soybean cultivars for their end-use
Table 3 shows ANOVA results for the content of total isoflavone and 12 individual components indicating signi-
ficant variance in the genotype and g x e interactions for each of four groups of 44 soybean cultivars classified by their end-uses such as soy-paste and tofu, soy-sprout, cooking with rice, and early maturity. Significant differences were also observed between years for the isoflavone composition groups except for glucoside content in the cultivar group of soy-paste and tofu, and aglycone content in the cultivar group of soy-sprout. The total isoflavone content in cultivar group for soy-sprout was higher (3850.4 ㎍/g) than that for the other cultivar groups of soy-paste and tofu (3082.8
㎍/g), black or green soybean cooked with rice (2345.8 ㎍ /g) and early maturity group (1298.6 ㎍/g). There were significant differences among the cultivar groups in the contents for total isoflavone and four composition groups (Fig. 3). The variation of total isoflavone content in soybean cultivars grouped by end-use was also consistent with the previous report (Park et al., 2006). The trend of variations of average content of each isoflavone composition group Fig. 2. The correlations of 44 Korean soybean cultivars for the content (unit ㎍/g) of total isoflavone and three component
groups (aglycone, glucoside, and malonylglucoside) between 2016 and 2017.
was the same as that of total isoflavone content in rankings of soy-sprout > soy-paste and tofu > cooked with rice >
early maturity group (Fig. 3). The content of acetyldaidzin belonging to acetylglucoside, which was relatively low in content of isoflavone composition, was low or almost not
detected in all cultivars regardless of their end-uses (Table 3).
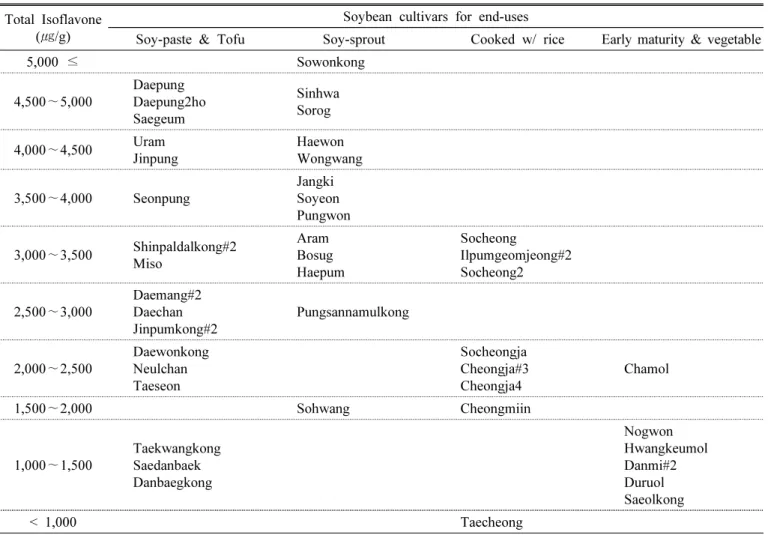
Distribution of soybean cultivars by their average content of total isoflavone over two years is shown in Table 4 and Fig. 4, respectively. The total isoflavone content of ‘Sowonkong’, a soybean cultivar for soy-sprout, Table 3. Mean, minimum and maximum values and ANOVA results for the content of total isoflavone and 12 individual
components for four groups of 44 soybean cultivars classified by their end-uses.
Daid- zein
Glyci- tein
Genis- tein
Total Agly- cone
Daid- zin
Glyci- tin
Genis- tin
Total Gluco-
side Malo-
nyl gaidzin
Malo- nyl glyci-
tin Malo-
nyl genis-
tin Total Malo- nyl gluco-
side Acetyl daidzin
Acetyl glycitin
Acetyl genistin
Total Acetyl gluco- side
Total Iso- flavon
e
Soy-paste & Tofu
Mean 63.2 41.1 64.7 169.0 113.0 44.6 129.6 287.2 1066.7 187.6 1309.5 2563.9 7.6 28.5 26.7 62.8 3082.8 Minimum 7.0 9.6 15.3 35.3 35.9 18.7 47.5 123.3 413.2 101.7 553.0 1123.7 0.0 8.8 7.4 17.1 1337.0 Maximum 148.3 135.1 131.3 330.5 233.4 76.8 226.8 491.1 1752.9 309.0 2115.6 4037.1 11.1 53.9 44.4 103.2 4961.9 LSD(0.05) 21.0 10.8 4.8 27.4 18.1 3.9 38.7 57.4 61.6 10.2 54.4 113.2 2.7 5.3 2.5 5.9 107.2 Genotype (G) **** **** **** **** **** **** **** **** **** **** **** **** **** **** **** **** ****
Year (Y) ns **** **** **** **** **** ns ns **** **** ** **** **** **** **** **** ****
G×Y **** **** **** **** **** **** **** **** **** **** **** **** **** **** **** **** ****
Soy-sprout
Mean 93.4 48.9 69.1 211.3 152.7 60.0 160.7 373.4 1412.0 221.0 1554.9 3188.0 11.1 35.2 31.5 77.8 3850.4 Minimum 24.0 23.5 30.6 85.8 83.4 25.9 83.4 192.7 689.4 108.2 763.3 1560.9 11.1 9.8 13.3 45.5 1894.8 Maximum 155.3 71.0 96.1 316.8 215.9 99.8 210.7 525.1 2011.5 321.0 2115.5 4333.5 11.1 57.1 49.6 117.8 5226.3
LSD(0.05) 29.8 5.6 5.0 32.3 20.6 3.5 38.3 57.1 114.1 12.6 91.2 208.7 - 3.6 2.1 3.9 215.4
Genotype (G) **** **** **** **** **** **** **** **** **** **** **** **** - **** **** **** ****
Year (Y) ns **** **** ns *** **** * *** **** *** **** **** - **** **** **** ****
G×Y **** **** **** **** **** **** **** **** **** **** **** **** - **** **** **** ****
Cooked w/ rice
Mean 44.7 28.6 53.4 126.7 67.7 33.9 92.4 194.0 750.3 113.5 1108.5 1972.3 10.9 18.1 23.7 52.7 2345.8 Minimum 3.0 12.4 16.5 32.9 30.5 14.2 46.4 91.2 285.9 63.9 454.0 803.9 9.2 6.3 5.2 22.6 950.6 Maximum 115.7 54.0 95.1 211.5 113.7 52.9 134.9 255.0 1458.4 223.3 1674.3 2881.3 11.1 30.3 41.2 80.7 3411.2
LSD(0.05) 3.6 6.0 3.1 9.3 6.1 4.1 30.4 32.8 75.7 11.5 55.8 123.4 - 8.5 2.3 8.7 124.6
Genotype (G) **** **** **** **** **** **** **** **** **** **** **** **** - **** **** **** ****
Year (Y) **** **** **** *** **** *** **** **** **** ns **** **** - **** **** **** ****
G×Y **** **** **** **** **** **** *** *** **** **** **** **** - **** **** **** ****
Early maturity
Mean 16.6 19.4 28.1 64.1 54.5 29.9 65.4 149.7 422.5 70.9 560.9 1054.2 11.1 10.0 9.4 30.5 1298.6 Minimum 5.5 12.5 18.2 36.3 39.3 13.9 43.0 109.1 305.1 50.0 435.7 900.0 11.1 3.7 1.9 18.7 1088.3 Maximum 39.5 32.8 53.9 126.1 89.3 41.6 130.5 261.4 558.0 131.5 920.9 1610.4 11.1 16.7 25.1 52.9 2050.8
LSD(0.05) 3.0 5.7 4.1 9.6 3.5 2.6 8.9 10.2 31.5 4.8 25.9 56.3 - 0.7 0.8 1.3 64.1
Genotype (G) **** *** **** **** **** **** **** **** **** **** **** **** - **** **** **** ****
Year (Y) **** *** **** **** **** * ns * **** ns ** **** - **** **** **** *
G×Y **** **** **** **** **** **** **** **** **** **** **** **** - **** **** **** ****
*, **, ***, **** statistically significant at p < 0.05, p < 0.01, p < 0.001, and p < 0.0001, respectively. ns - not significantly
different.
was the highest (5226.3 ㎍/g) and was about 5.5 times higher than that of ‘Taecheong’, a black soybean cultivar with green cotyledon and the lowest isoflavone content (950.6 ㎍/g). In the cultivar group for soy-paste and tofu, the average contents of total isoflavone for ‘Daepung’,
‘Daepung2ho’, ‘Saegeum’, ‘Uram’, and ‘Jinpung’ were higher than 4000 ㎍/g. However, ‘Taekwangkong’, ‘Saedanbaek’,
‘Danbaegkong’ in the same cultivar group were relatively low with less than 1500 ㎍/g. In particular, these cultivars at the upper and lower levels of isoflavone content were stable without significant annual variations. In the small seeded cultivar group for soy-sprout, in addition to
‘Sowonkong’, such cultivars as ‘Sinhwa’, ‘Sorog’ and
‘Haewon’ were high in isoflavone content with ≥ 4480
㎍/g despite their annual variation. The colored soybean cultivars with black or green seed coats were in the range of 950.6 to 3411.2 ㎍/g in total isoflavone. Early-matured soybean cultivars for cropping system or green bean vegetables only had 1000 to 1500 ㎍/g except for ‘Chamol (2050.8 ㎍/g)’, and generally had lower isoflavones than
the other cultivars of soy-paste, tofu, and soy-sprouts. The early-matured cultivars were expected to have a short growth period, which would have prevented isoflavone synthesis due to high temperature from flowering to maturity (Park et al., 2012; Tsukamoto et al., 1995).
Effect of growth characteristics on isoflavone content Since the soybean cultivar group for soy-sprout, which had a 100-seed weight of about 12 g or less, had a higher content of isoflavones on average than other cultivars, so the relationship between seed size and isoflavone content was analyzed (Table 5). Seed weight and total isoflavone content of 44 soybean cultivars were significantly negatively correlated in 2016 and 2017, respectively (r = -0.47
**and -0.49
**). This means that the smaller the seed size, the higher the isoflavone content. However, isoflavone contents of some cultivars with small seed size were exceptionally lower than the average cultivars within the group : the isoflavone contents of ‘Sohwang’ for soy-sprout and
‘Socheongja’, a small black soybean with green cotyledon Fig. 3. Difference of soybean cultivar groups for the average content (unit ㎍/g) of total isoflavone and four component groups
(aglycone, glucoside, malonylglucoside, and acetylglucoside) over 2016 and 2017.
were 1895 ㎍/g and 2320 ㎍/g, respectively.
The correlations of seed weight with the contents of individual isoflavone component groups in 2016 and 2017 were varied. They were significant with r = -0.50
**and -0.52
**for glucoside group and r = -0.45
**and -0.49
***for malonylglucoside group. In the case of the aglycone group, its correlation with seed weight varied over years, and was significant for all three components of genistein, daidzein and glycitein in 2016 but only daidzein in 2017.
The number of days to maturity after sowing 44 cultivars was positively correlated with the total isoflavone content, although the correlation was not high (r = 0.4
**–0.44
**) (Table 5). However, the number of days from sowing to maturity was not related to isoflavone content when considering 38 cultivars except for the early-matured six cultivars (r = 0.09
ns). It was difficult to find the correlation between the two traits because 80% of the soybean
cultivars except the early-matured had a small variation in the range of 120 –130 days of growth, while the variation of the isoflavone content was relatively large.
The number of days of growth from flowering to maturing did not affect the isoflavone content variation (Table 5).
This was contrary to the results of Yun et al. (2006) who reported that soybean isoflavone contents increased as the periods from flowering to maturity were longer in the analysis of Korean soybean cultivars of the early-, mid- and late-matured and Chinese cultivars. These results indicated no specific trend for the relationship between the length of growth period and the isoflavone content of soybean, and it may vary depending on the characteristics of the cultivars and resources to be analyzed.
Table 4. Distribution of 44 soybean cultivars by average content of total isoflavone over 2016 –2017.
Total Isoflavone (㎍/g)
Soybean cultivars for end-uses
Soy-paste & Tofu Soy-sprout Cooked w/ rice Early maturity & vegetable
5,000 ≤ Sowonkong
4,500 ∼5,000
Daepung Daepung2ho Saegeum
Sinhwa Sorog
4,000∼4,500 Uram Jinpung
Haewon Wongwang
3,500∼4,000 Seonpung
Jangki Soyeon Pungwon
3,000∼3,500 Shinpaldalkong#2 Miso
Aram Bosug Haepum
Socheong
Ilpumgeomjeong#2 Socheong2
2,500∼3,000 Daemang#2 Daechan Jinpumkong#2
Pungsannamulkong
2,000 ∼2,500
Daewonkong Neulchan Taeseon
Socheongja Cheongja#3 Cheongja4
Chamol
1,500 ∼2,000 Sohwang Cheongmiin
1,000∼1,500 Taekwangkong Saedanbaek Danbaegkong
Nogwon Hwangkeumol Danmi#2 Duruol Saeolkong
< 1,000 Taecheong
Possibility to improve isoflavone contents by plant breeding
It is important to improve the utilization of soybean genetic resources with high isoflavone contents as the consumer’s interest in bioactive components increases.
From the study and various reports, the soybean cultivars
developed in Korea have a large genetic variation and high
heritability values in regards to isoflavone content. Therefore,
it is surmised that selection of putative germplasm and
improvement of elite cultivars for soy-isoflavone contents
Fig. 4. Variation of total isoflavone content (unit ㎍/g) among 44 soybean cultivars grouped by their end-uses and averaged
over 2016 and 2017: (a) soy-paste and tofu, (b) soy-sprouts, (c) cooked with rice and others, and (d) early maturity
and vegetables.
will be effective for Korean soybean. In particular, recent molecular genetic approaches based on QTL mapping have been actively conducted to promote understanding of genome- based isoflavone content and composition components (Han et al., 2016; Meng et al., 2016; Smallwood et al., 2014; Zeng et al., 2009). It will be allowed in the near future to suggest the possibility to develop soybean cultivars for specialized purposes that enhance isoflavone contents by combining genome-based technology with conventional breeding schemes. Some positive effects will be expected such as the increase of consumption of domestic soybeans and substitution of the foreign imports by diversifying usability of functional materials in Korean soybean as well as traditional end-use of food processing.
ACKNOWLEDGEMENTS
This research was supported by the Rural Development
Administration Agenda Project (No. PJ01251203), Republic of Korea.
REFERENCES
Ahmad, M. Z., P. Li, J. Wang, N. U. Rehman, and J. Zhao.
2017. Isoflavone malonyltransferases Gm1MaT1 and Gm1- MaT3 differently modify isoflavone glucosides in soybean under various stresses. Front. Plant Sci. 8 : 735. doi : 10.3389/fpls. 2017.00735.
Chiari, L., N. D. Piovesan, L. K. Naoe, I. C. José, J. M. S.
Viana, M. A. Moreira, and E. G. de Barros. 2004. Genetic parameters relating isoflavone and protein content in soybean seeds. Euphytica 138 : 55-60.
Choung, M. G., S. T. Kang, W. Y. Han, I. Y. Baek, H. K.
Kim, D. C. Shin, N. S. Kang, Y. S. Hwang, Y. N. An, J.
D. Lim, K. S. Kim, S. H. Park, and S. L. Kim. 2006.
Variation of isoflavone contents in Korean soybean germplasms. Korean. J. Crop Sci. 51 : 146-151.
Chung, H, S. Hogan, L. Zhang, K. Rainey, and K. Zhou.
Table 5. Correlations of growth characteristics with the average contents of total isoflavone and 12 individual components for 44 soybean cultivars during 2016 and 2017.
Year 2016 Year 2017
No. of days fd-md
†No. days pd-md
100-seed weight
No. of days fd-md
No. of days pd-md
100-seed weight
Daidzein 0.16 0.29 -0.51*** 0.23 0.29 -0.41**
Glycitein 0.13 0.25 -0.50*** 0.09 0.31* -0.28
Genistein 0.25 0.37* -0.31* 0.33* 0.41** -0.20
T_Aglycon 0.22 0.36* -0.46** 0.25 0.38* -0.39**
Daidzin 0.12 0.30* -0.51*** 0.16 0.21 -0.49***
Glycitin 0.18 0.27 -0.59**** 0.14 0.14 -0.56****
Genistin 0.14 0.34* -0.45** 0.28 0.28 -0.40**
T_Glucoside 0.14 0.33* -0.52*** 0.23 0.25 -0.50***
Malonyldaidzin 0.20 0.36* -0.47** 0.15 0.39** -0.50***
Malonylglycitin 0.22 0.35* -0.57**** 0.24 0.34* -0.60****
Malonylgenistin 0.25 0.43** -0.39** 0.29 0.51*** -0.41**
T_Malonylglucoside 0.24 0.41** -0.45** 0.23 0.46** -0.49***
Acetyldaidzin - - - -0.07 0.08 -0.05
Acetylglycitin 0.17 0.30* -0.55*** 0.07 0.12 -0.06
Acetylgenistin 0.27 0.46** -0.40** 0.37* 0.10 -0.05
T_Acetylglucoside 0.23 0.40** -0.50*** 0.08 0.16 -0.07
Total isoflavone 0.23 0.40** -0.47** 0.23 0.44** -0.49***
*, **, ***, **** statistically significant at p < 0.05, p < 0.01, p < 0.001, and p < 0.0001, respectively. ns - not significantly different.
†