1470 Nak-Ju Sung*
Department of Food and Nutrition, Institute of Agriculture and Life Science, Gyeongsang National University, Jinju, Gyeongnam 660-701, Korea
1Department of Chemistry and Research Institute of Life Science, Gyeongsang National University, Jinju, Gyeongnam 660-701, Korea 2Department of Agriculture and Life Science Research Institute, Gyeongsang National University, Jinju, Gyeongnam 660-701, Korea 3Central Laboratory, Gyeongsang National University, Jinju, Gyeongnam 660-701, Korea
4Department of Informational Statistics and Research Institute of Natural Science, Gyeongsang National University, Jinju, Gyeongnam 660-701, Korea
Abstract The seed coat of the black soybean contains 3 main anthocyanins such as delphinidin-3-O-β-glucoside,
cyanidin-3-O-β-glucoside, and petunidin-3-O-β-glucoside. As a part of our effort on discovering and breeding new black soybean
cultivars which possesses specific anthocyanin component rich, we determined the anthocyanin profiles of the 2 cultivars recently developed soybean cv. Gaechuck #1 and cv. Gyeongsang #1, using liquid chromatography-tandem mass spectrometry (LC-MS/MS) and compared their content and identity with those of previously known 10 cultivar controls. The Cosmosil-5C18-AR-IIcolumn were selected for the analysis because of the best peak separation. The column temperature was set up at
35oC. The mobile phase consisting of water containing 0.5%(v/v) formic acid and methanol gave good separation between the
3 anthocyanin analytes and internal standard (quercetin 3-O-β-rutinoside) and peaks with suppressed tail. The MS/MS spectra
of each individual anthocyanin standard were detected in positive electron spray ionization (ESI) modes. It was disclosed that the anthocyanin contents of the soybean cv. Gaechuck#1 and cv. Gyeongsang#1 are roughly higher than those of the 10 controls.
Keywords: black soybean, anthocyanin, liquid chromatography, tandem mass spectrometry, plant polyphenol
Introduction
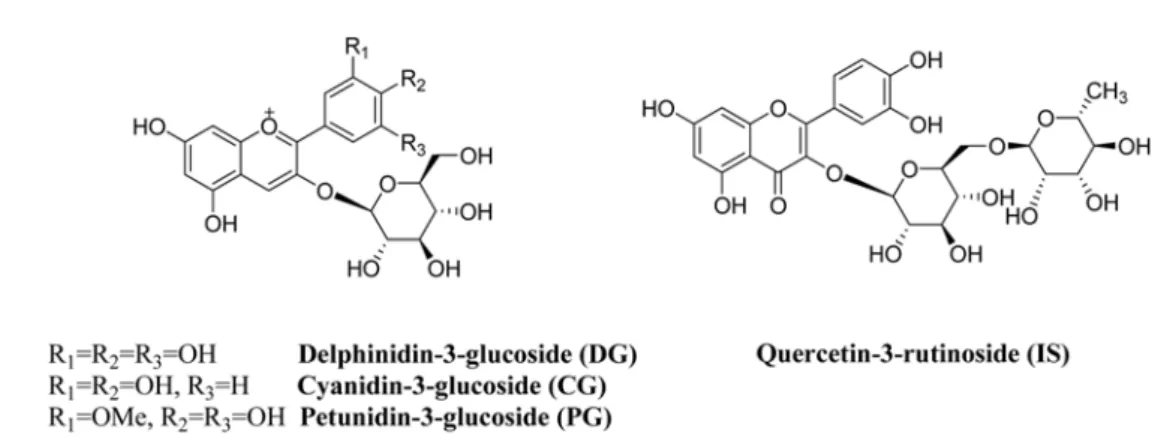
Anthocyanins are one of plant polyphenol families and glycosylated derivatives of the 3, 5, 7, 3'-tetrahydroxy-flavylium cation (Fig. 1) (1). More than 600 types of anthocyanins have been found from plant sources to date and derivatives of cyanidin, delphinidin, malvidin, peonidin, pelargonidin, and petunidin are the most prevalent (2). They play various important roles in plants such as an attractant of animals participating in pollination and seed disposal, a repellant of harmful insects, and a protectants against damage by ultra violet (UV) light (3). For example, cyanidin-3-O-β-glucoside (CG) protects cotton leaves
against the tobacco budworm (4).
The content and composition of anthocyanins of the individual plants differ from genetic origins and are affected by environmental factors such as light condition and temperature (5,6).There is considerable current interest in various health-enhancing effects of anthocyanins such as antioxidant activity (7,8), anti-inflammatory (9), protecting effect against cardiovascular disorder (10), anticancer (11,12) and hypoglycemic effects (13). Increasing attention has been focused to the anthocyanin content of deep
colored crops because of their potential as functional foods and nutraceutical ingredients (14).
Black soybean [Glycine max (L.) Merr.] has been popularly utilized as a food and a folk medicine and very widely cultivated in the Far East from about 5,000 years ago. The black soybean cultivars are planted from May to July, grow up to about 60 cm height, burst into purple or white bloom from July to August, and harvested from September to October. About 2,780 black soybean genotypes were registered in USA soybean germ plasmcenter (15). The black pigmentation of the seed coat of the black soybean is ascribed to accumulation of anthocyanins in its epidermis palisade layer (16). Three main anthocyanins, i.e., delphinidin-3-O-β-glucoside (DG), CG, and
petunidin-3-O-β-glucoside (PG) were characterized in the seed coat
of the black soybean (Fig. 1) (17).
Although a number of studies have been devoted to the presence of anthocyanins in soybeans (18,19), reports on variation of the content and composition of anthocyanins according to different black soybean cultivars has been restricted (17).
Recently, we are engaging in study discovering and breeding new cultivars which possesses specific anthocyanin component rich. The detailed information for their content and identity in the different cultivars will be the first step in such an effort, the results of which may provide opportunities to broaden biological and commercial applicability. Therefore the anthocyanin profiles of the 2 cultivars were determined, *Corresponding author: Tel: +82-55-751-5975; Fax: +82-55-751-5971
E-mail: [email protected]
Received July 19, 2009; Revised August 3, 2009; Accepted August 14, 2009
soybean cv. Gaechuck#1 and cv. Gyeongsang#1 of the black soybean recently developed by Chung, one of co-authors of this paper (20) using liquid chromatography-tandem mass spectrometry (LC-MS/MS) and compared their content and identity with those of 10 previously developed cultivars. The results are reported in this paper. Anthocyanins were conventionally characterized by reverse phase high performance liquid chromatography (HPLC) coupled with UV-vis detector or mass spectrometry (1,21,22). Recently, LC-MS/MS has been proven to be one of the most powerful tools for the characterization and quantitation of anthocyanin pigments in fruits and vegetables (23,24).
Materials and Methods
Materials and reagents Total 12 black soybean cultivars-soybean cv. Gaechuck#1, cv. Gyeongsang#1, cv. PI424432, cv. PI438496B, cv. PI423721, cv. PI424188A, cv. PI398741, cv. PI407927A, cv. PI424188B, cv. PI398200, cv. PI407908, and cv. PI407860 were planted at the experimental field of Gyeongsang National University in May 10, 2004. The soybean seeds were harvested at maturity. The harvested seeds were air dried to a seed moisture content of about 8.0%. The coats of dried seeds were peeled manually and stored in brown glass bottle at 4oC until required for analysis.
HPLC grade methanol and water were obtained from Duksan Pure Chemical Co., Ltd. (Ansan, Korea). HCl were purchased from Samchun Pure Chemical Ind., Ltd. (Pyungtaeg, Korea). Internal standard (IS), quercetin-3-O
-β-rutinoside (QR) was purchased from Sigma-Aldrich (St.
Louis, MO, USA). DG, CG, and PG were separated from the soybean cv. Gaechuck#1 cultivar according to literature method (17).
Sample preparation The seed coats of each sample (0.1 g) were ground into a powder, homogenized in 30 mL of a mixed solvent of water/methanol (6:4, v/v) containing 0.1 % HCl, and stood at 4oC refrigerator for 24 hr. The mixture
was filtered through glass filter under reduced pressure. The solid residue was washed with methanol until the colored materials were sufficiently removed. The extracts were combined and concentrated to 30 mL and filtered through a polytetrafluoroethylene (PTFE) syringe filter (Whatman International Ltd., Maidstone, England) and stored at −20oC until injection into the LC-MS/MS system.
The stored solution was diluted 10 times immediately before each injection.
HPLC HPLC analysis was performed using an 1100 series LC system, equipped with a G1322A degasser, G1312A pump, G1313A autosampler, and G1316A oven (Agilent Technologies, Palo Alto, CA, USA). The chromatographic separation was carried out on a Cosmosil-5C18-AR-II column (Nacalai Tesque Inc., Kyoto, Japan),
(particle size 5µm, 4.6×150 mm), The mobile phase
consisted of water containing 0.5%(v/v) formic acid (A) and methanol (B), with a linear gradient of 0-80% B over 15 min, increased to 98% B over 2 min, followed by isocratic elution at 100% B for 5 min. The flow rate was 0.4 mL/min, with column temperature of 35oC and an
injection volume was 10µL in each experiment.
Mass spectrometry MS/MS experiments were carried out using a 3200 Q TRAP LC-MS/MS system (Applied Biosystems, Forster, CA, USA) with a Turbo VTM source
and Turbo Ion Spray probe (500oC). The mass spectrometer
was operated in the positive mode with the multiple reaction monitoring (MRM) modes. A total of 8 MS/MS transitions (6 for 3 anthocyanin analytes and 2 for IS) were monitored during the LC separation. BioAnalst™, version 1.4.2, and Analyst software, version 1.4.2, were used for instrument control and data acquisition, respectively.
Both the nebulizing and drying gas was nitrogen. The flow rates of both the gases were 45 psi. The capillary voltage was set at 5.5 kV and the source temperature at 500oC. The resolutions of the first and third quadrupole
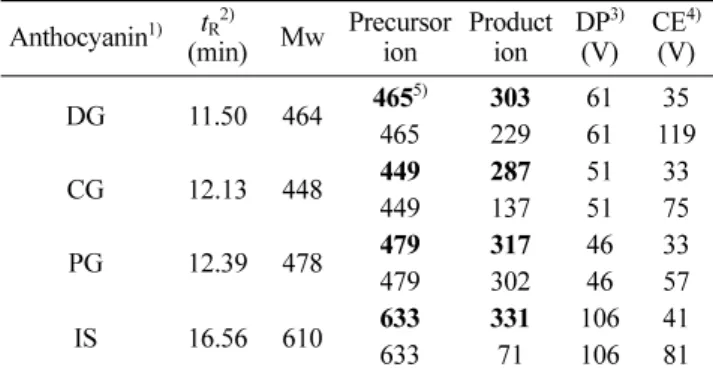
were between 0.6 and 0.8 (unit resolution). Mass spectra were recorded between m/z 50 and 800 by a step size of 0.1 u. By varying the collision energy of the precursor ion, the product ions for each analyte were optimized. The fragments and fragmentation conditions are summarized in Table 1.
Preparation of standard and stock solution for calibration experiments Stock solutions of the anthocyanin standards were prepared in 0.1% HCl-water/methanol (6:4, v/v) at a concentration of 100 mg/L and stored at −20oC.
These solutions were further diluted with 0.1% HCl-water/ methanol to give the standard working solutions at concentrations of 20, 10, 5, 1, 0.1, 0.01, and 0.001 mg/L. Standard working solution of IS were prepared in 0.1% HCl-water/methanol at concentration of 10mg/L immediately before sample preparation.
Statistical analysis The statistical analysis was done using the SPSS for Windows (version 12.0, SPSS Inc., Chicago,
IL, USA). All data were presented as mean. Differences among mean values were tested for significance by means of Duncan’s multiple range tests (p<0.05).
Results and Discussion
To determine anthocyanins in the black soybean cultivars, the methanolic water extract were analyzed by LC-MS/ MS. Of the cultivars analyzed, soybean cv. Gaechuck#1 and cv. Gyeongsang#1 were new ones breeded by Chung (20). Of the 10 cultivars analyzed as controls, one was China origin and others were Korea origin. The anthocyanin profile of the black soybeans is rather simple. Only 3 anthocyanins were characterized previously, fewer than other plants. For example more than 10 anthocyanins were characterized in fruits such as bilberries (23) and grapes (25).
LC-MS/MS optimization In order to optimize the LC separation, variables such as column, column temperatures, mobile phase, and elution condition were investigated. A
the 3 anthocyanins and IS are depicted in Fig. 2. As shown in Fig. 2, the separations were achieved within about 17 min.
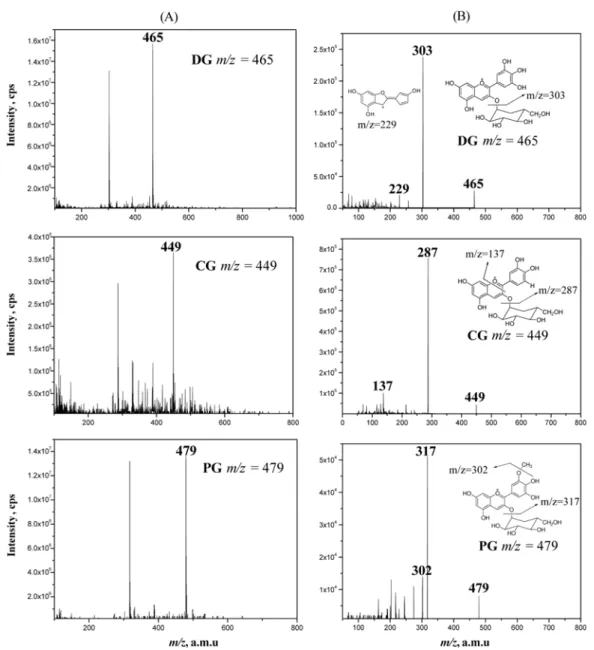
The MS/MS spectra of each individual anthocyanin standard were detected in positive electronic spray ionization (ESI) modes. The MS/MS experiments of anthocyanins were conventionally carried out in positive ion mode because the mode provides more abundant information (27,28). The MS/MS condition was optimized using individual standard solutions of 10mg/kg in methanol. The declustering potential (DP) was tuned to produce the most intense response of the precursor ion in the first quadrupole and the collision energy (CE) was tuned to produce the most sensitive and stable product ion in the second quadrupole. The different DPs and CEs determined by optimization experiments were applied to the 3 anthocyanins. The full scan mass spectra and the MS/MS spectra were acquired to obtain 2 transitions (product ions) for each anthocyanins. The optimized parameters for the 3 anthocyanins and IS, together with the MS/MS transitions selected for identification and quantification are shown in Table 1. As depicted in Fig. 3A the full scan mass spectra show precursor ions (PIs); m/z 465, 449, 479, and 633 a.m.u. for DG, CG, PG, and IS (not shown), respectively. The PIs for the 3 anthocyanins were detected as [M+H]+ and that of IS
as [M+Na]+. As illustrated in Fig. 3B, the MS/MS spectra
shows the most abundant product ions; m/z 303, 287, 317, and 331 a.m.u. for DG, CG, PG, and IS, respectively, corresponding to the loss of the glucose moiety. The transitions, m/z 465→303, m/z 449→287, and m/z
IS 16.56 610 633633 33171 106 41106 81
1)DG, delphinidin-3-O-β-glucoside; CG, cyanidin-3-O-β-glucoside;
PG, petunidin-3-O-β-glucoside; and IS, quercetin-3-O-β-rutinoside.
2)Retention time.
3)Decluatering voltage (cone voltage of other manufactures). 4)Collision energy.
5)Ion used for quantification purposes is indicated in bold.
Fig. 2. LC-MS/MS separation of a standard mixture of anthocyanins represented as the mass chromatogram of each anthocyanin class in the positive ion mode.
Fig. 3. Full scan mass spectra (A) and MS/MS spectra (B) of anthocyanins (DG, CG, and PG). Table 2. Anthocyanin contents in seed coats of each black soybean
Black soybeans
(soybean cv.) 1) DG (RSD2) %) CG (RSD %)Anthocyanin content (mg/kg)PG (RSD %) Total (RSD %) Gaechuck#11 07.27 (1.79)h3) 4.54 (3.12)d 01.32 (8.64)cd 13.13 (1.70)g PI4244322 5.75 (5.20)b 3.89 (0.79)c 1.37 (1.84)d 011.01 (2.74)de PI438496B3 6.29 (2.44)d 02.02 (3.63)ab 00.22 (0.68)ab 08.53 (1.99)b PI4237212 8.49 (1.37)k 02.04 (2.45)ab 0.52 (1.81)b 011.05 (1.15)de PI424188A2 6.47 (0.86)e 1.87 (1.11)a 0.39 (4.79)b 08.73 (0.71)b PI3987412 0.51 (2.50)a 4.63 (1.61)e 0 (0)a 05.14 (1.47)a PI407927A2 7.34 (4.69)i 4.34 (3.92)d 0.32 (3.08)b 12.00 (3.20)f PI424188B2 8.86 (0.34)l 01.96 (2.55)ab 0.52 (7.24)b 11.34 (0.61)e Gyeongsang#11 8.09 (0.93)j 2.16 (2.33)b 0.47 (2.25)b 10.72 (0.85)d PI3982002 6.97 (3.29)f 01.97 (2.69)ab 0.85 (7.47)c 09.79 (2.49)c PI4079082 7.15 (0.43)g 3.88 (1.97)c 0.45 (2.64)b 11.48 (0.73)e PI4078602 5.93 (1.51)c 04.51 (3.22)de 00.23 (4.54)ab 10.67 (1.60)d
1)Origin; 1New cultivar, 2Republic of Korea, 3China. 2)Relative standard deviation.
479→317 were chosen for the MRM quantitation mode.
The secondary transitions, m/z 465→ 229, m/z 449→137,
and m/z 479→302 were chosen for the MRM confirmation
mode (29).
Validation A calibration curve was constructed by
determining each anthocyanin/IS peak area ratio versus each anthocyanin/IS concentration ratio. All constructions were run in triplicate, with the results averaged. The peak areas were calculated from the extracted ion chromatograms of the most abundant product ions. The 3 calibration curves prepared were linear in the range from 0.001 to 20 mg/L and the correlation coefficients of all the calibration curve are found to be higher than 0.995. The recovery was determined by inter-day assays at each of the 4 concentration levels for each compound. The recovery values of DG, CG, and PG were 93, 87, and 97%, respectively. The relative
been significant difference among the tested samples. Of the 3 anthocyanins DG was the most plentiful all over the cultivars and PG was the poorest. The DG contents in the controls were in the range from 0.51 to 8.86 mg/kg. The soybean cv. Gyeongsang#1 showed the highest DG content, which was higher by 1.71 than 6.38 mg/kg, the average of those in the controls. The DG content of the soybean cv. Gaechuck#1 was larger by 0.89 mg/kg than the average. A total content of anthocyanins in the controls was determined to be average 9.97 mg/kg, ranging from 5.14 to 12.00 mg/ kg. The soybean cv. Gaechuck#1 was analyzed to have the highest total anthocyanin content, which is higher by 3.16 mg/kg than the average, 9.97 mg/kg of that in the controls. The anthocyanin total content in the soybean cv. Gyeongsang#1 was higher by 0.75 mg/kg than the average. As described above, in view of anthocyanin content the quality of the soybean cv. Gaechuck#1 and cv. Gyeongsang#1 is roughly superior to the controls. The MRM chromatograms used for the quantitation of DG, CG, and PG were shown in Fig. 4.
In conclusion, the content of 3 major anthocyanins, DG, CG, and PG in the recently breeded 2 cultivars, soybean cv. Gaechuck#1 and cv. Gyeongsang#1 was determined using LC-MS/MS and compared with those in the previously developed 10 controls. The anthocyanin contents of the soybean cv. Gaechuck#1 and cv. Gyeongsang#1 were analyzed to be roughly higher than the controls. Present data will help for studies breeding new cultivars having specific anthocyanin component plentifully.
Acknowledgments
This work was supported by a grant (CG3-1) from the Functional Genomics Center (CFGC), 21C Frontier R&D Project, Ministry of Science & Technology, Korea and a grant from the National R&D program for cancer control, Ministry of Health & Walfare, Republic of Korea.
References
1. da Costa CT, Horton D, Margolis SA. Analysis of anthocyanins in foods by liquid chromatography, liquid chromatography–mass spectrometry and capillary electrophoresis. J. Chromatogr. A 881: 403-410 (2000)
2. Torskangerpoll K, Andersen OM. Colour stability of anthocyanins in aqueous solutions at various pH values. Food Chem. 89: 427-440 (2005)
3. Sullivan J. Anthocyanin. Available from: http://www.charlies-web. com/specialtopics/anthocyanin.html. Accessed July 15, 2009. 4. Hedin PA, Jenkins JN, Collum DH, White WH, Parrot WL.
Multiple factors in cotton contributing to resistance to the tobacco
Fig. 4. Multiple reaction monitoring (MRM) chromatograms of anthocyanins (DG, CG, and PG) used for quantitation.
budworm, Heliothis virescens (F.). pp. 347-365. In: Plant Resistance to Insects. ACS Symposium Series. Hedin PA (ed). American Chemical Society, Washington, DC, USA (1983)
5. Gao L, Mazza G. Quantitation and distribution of simple and acylated anthocyanins and other phenolics in blueberries. J. Food Sci. 59: 1057-1059 (1994)
6. Ortega-Regules A, Romero-Cascales I, López-Roca J, Ros-García JM, Gómez-Plaza E. Anthocyanin fingerprint of grapes: Environmental and genetic variations. J. Sci. Food Agr. 86: 1460-1467 (2006) 7. Nam SH, Choi SP, Kang MY, Koh HJ, Kozukue N, Friedman M.
Antioxidative activities of bran extracts from twenty one pigmented rice cultivars. Food Chem. 94: 613-620 (2006)
8. Philpott M, Gould KS, Lim C, Ferguson LR. In situ and in vitro
antioxidant activity of sweetpotato anthocyanins. J. Agr. Food Chem. 52: 1511-1513 (2006)
9. Tsuda T, Horio F, Osawa T. Cyanidin 3-O-β-D-glucoside suppresses
nitric oxide production during a zymosan treatment in rats. J. Nutr. Sci. Vitaminol.48: 305-310 (2002)
10. Kim HJ, Tsoy I, Park JM, Chung JI, Shin SC, Chang KC. Anthocyanins from soybean seed coat inhibit the expression of TNF-α-induced genes associated with ischemia/reperfusion in endothelial cell by NF-(B-dependent pathway and reduce rat myocardial damages incurred by ischemia and reperfusion in vivo. FEBS Lett.580: 1391-1397 (2006)
11. Hyun JW, Chung HS. Cyanidin and malvidin from Oryza sativa cv. Heugjinjubyeo mediate cytotoxicity against human monocytic leukemia cells by arrest of G2/M phase and induction of apoptosis.
J. Agr. Food Chem.52: 2213-2217 (2004)
12. Zhao C, Giusti MM, Malik M, Moyer MP, Magnuson BA. Effects of commercial anthocyanin-rich extracts on colonic cancer and nontumorigenic colonic cell growth. J. Agr. Food Chem. 52: 6122-6128 (2004)
13. Tsuda T, Horio F, Uchida K, Aoki H, Osawa T. Dietary cyanidin
3-O-β-D-glucoside-rich purple corn color prevents obesity and
ameliorates hyperglycemia in mice. J. Nutr. 133: 2125-2130 (2003) 14. Choi Y, Jeong HS, Lee J. Antioxidant activity of methanolic extracts from some grains consumed in Korea. Food Chem. 103: 130-138 (2007)
15. USDA. Evaluation/characterization data queries. Available from: http://www.ars-grin.gov/cgi-bin/npgs/html/croplist.pl. Accessed July 14, 2009.
16. Todd JJ, Vodkin LO. Pigmented soybean (Glycine max) seed coats accumulate proanthocyanidins during development. Plant Physiol. 102: 663-670 (1993)
17. Choung MG, Baek IY, Kang ST, Han WY, Shin DC, Moon HP, Kang KH. Isolation and determination of anthocyanins in seed coats
of black soybean (Glycine max (L.) Merr.). J. Agr. Food Chem.49: 5848-5851 (2001)
18. Kuroda C, Wada M. The colouring matter of ‘Kuro-mame’. Vol. 9, pp. 17-18. In: Proceedings of the Imperial Academy. Majima R, Jan MIA (eds). Institute of Physical and Chemical Research, Tokyo, Japan (1933)
19. Yoshida K, Sato Y, Okuno R, Kameda K, Isobe M, Kondo T. Structural analysis and measurement of anthocyanin from colored seed coats of Vigna, Phaseolus, and Glycine legumes. Biosci. Biotech. Bioch.60: 589-593 (1996)
20. Chung JI. Gaechuck #1 (patent 2831; 2006), Gyenogsnag #1 (patent 2338; 2008). Korea Seed and Variety Service, Seoul, Korea 21. Flamini R. Mass spectrometry in grape and wine chemistry. Part I:
Polyphenols. Mass Spectrom. Rev.22: 218-250 (2003)
22. Stobiecki M. Application of mass spectrometry for identification and structural studies of flavonoid glycosides. Phytochemistry 54: 237-256 (2000)
23. Cooke DN, Thomasset S, Boocock DJ, Schwarz M, Winterhalter P, Steward WP, Gescher AJ, Marczylo TH. Development of analyses by high-performance liquid chromatography and liquid chromatography/tandem mass spectrometry of bilberry (Vaccinium myrtilus) anthocyanins in human plasma and urine. J. Agr. Food Chem.54: 7009-7013 (2006)
24. Tian Q, Giusti MM, Stoner GD, Schwartz SJ. Characterization of a new anthocyanin in black raspberries (Rubus occidentalis) by liquid chromatography electrospray ionization tandem mass spectrometry. Food Chem.94: 465-468 (2006)
25. Ju ZY, Howard LR. Effects of solvent and temperature on pressurized liquid extraction of anthocyanins and total phenolics from dried red grape skin. J. Agr. Food Chem. 51: 5207-5213 (2003)
26. Hosseinian FS, Muir AD, Westcott ND, Krol ES. AAPH-mediated antioxidant reactions of secoisolariciresinol and SDG. Org. Biomol. Chem.5: 644-654 (2007)
27. Kang J, Sun JH, Zhou L, Ye M, Han J, Wang BR, Guo DA. Characterization of compounds from the roots of Saposhnikovia divaricata by high-performance liquid chromatography coupled with electrospray ionization tandem mass spectrometry. Rapid Commun. Mass Sp. 22: 1899-1911 (2008)
28. Hosseinian FS, Li W, Beta T. Measurement of anthocyanins and other phytochemicals in purple wheat. Food Chem.109: 916-924 (2008)
29. Oliveira MC, Esperança P, Almoster Ferreira MA. Characterisation of anthocyanidins by electrospray ionization and collision-induced dissociation tandem mass spectrometry. Rapid Commun. Mass Sp. 15: 1525-1532 (2001)