Article
Vol. 31(4):283-296
DOI: 10.4217/OPR.2009.31.4.283
Ocean and Polar Research December 2009
Characteristics of a Warm Eddy Observed in the Ulleung Basin in July 2005
Chang-Woong Shin
*Climate Change & Coastal Disaster Research Department, KORDI Ansan P.O. Box, 29, Seoul 425-600, Korea
Abstract : Oceanographic survey data were analyzed to understand the characteristics of a warm eddy observed in the Ulleung Basin in July 2005. The temperature distribution at 200 db and vertical sections provided evidence of the warm eddy in the Ulleung Basin (UWE05). Based on the 5
oC isothermal line on 200 db temperature, the major axis was 160 km from southwest to northeast, and the minor axis was 80 km from southeast to northwest. The homogeneous layer in the thermocline of UWE05 had mean values of 10.40
oC potential temperature, 34.35 psu salinity, and 26.37 kg/m
3potential density (
σθ) and provided evi- dence that UWE05 also existed during the winter of 2004-2005. A warm streamer initially flowed along the circumference of UWE05 and mixed with the upper central water. Two northward current cores were found on the western side of the measured current section at the central latitude of UWE05. One was the East Korean Warm Current (EKWC) and the other was the main stream of the western part of UWE05.
Geostrophic transport of the upper layer (from the surface to the isopycnal surface of 26.9
σθ) was approx- imately 2.5 Sv in the eastern side of UWE05. However, the measured transport was twice as large as the geostrophic transport. Mass conservation of geostrophic transport was well satisfied in the upper layer. The direct current measurements and geostrophic transport analysis showed that the EKWC meandered around UWE05.
Key words : homogeneous layer, meandering, Ulleung warm eddy, volume transport, warm streamer
1. Introduction
The East Sea (Japan Sea) is enclosed by Korea, Russia, and Japan and is connected through four straits (Korea, Tsugaru, Soya, and Tartar) to the northwest Pacific (Fig.
1). Three large basins divide the bottom topography of the East Sea. The deepest is the Japan Basin, located in the northern East Sea. The other two basins, the Yamato and Ulleung basins, are located in the southern part of the East Sea. The Tsushima Warm Current (TWC) flows into the southern East Sea through the Korea Strait. It then branches into the East Korean Warm Current (EKWC) that flows northward along the east coast of Korea and the Nearshore Branch (NB) that flows eastward along the Japanese coast. In the northern East Sea, the Liman Current (LC) and the North Korea Cold Current (NKCC)
flow southward along the coasts of Russia and northern Korea (Fig. 1). The EKWC and NKCC meet around 38- 40
oN and form the sub-polar front that flows out through the Tsugaru and Soya straits. Water masses south of the sub-polar front are vertically divided into four layers:
seasonally varying surface water, the Tsushima Warm Current Water (TWCW) with high temperature (T > 15
oC) and high salinity (S > 34.4 psu), the East Sea Intermediate Water (ESIW), characterized by the salinity minimum layer, and the nearly homogenous East Sea Proper Water (ESPW).
Mesoscale warm eddies exist in all three basins of the East Sea (Morimoto et al. 2000; Lee and Niiler 2005). A number of explanations have been given for the formation of the warm eddy in the Ulleung Basin (Ulleung Warm Eddy: UWE). One explanation involves meandering of the EKWC (Kim et al. 1997). Arruda et al. (2004) proposed that when the EKWC is strong, a beta effect and
*Corresponding author. E-mail : [email protected]
non-linearity lead to formation of the eddy. Bottom topography of the Ulleung Basin also affects the UWE (Seung et al. 1990; Lim and Kim 1995; Lie et al. 1995).
An et al. (1994) statistically analyzed the shape of the UWE, showing it to be mainly elliptical with an average horizontal scale of 130 km.
The UWE has mainly been observed in August, with a few other observations obtained in June. In a study by Lie et al
.(1995), the UWE was observed from January 1992 to September 1993 by a satellite-tracked drifter buoy; in that case, the horizontal scales of the major and minor axes were 120 and 70 km, respectively, the revolution period was 13.6 days, and the speed was 24 cm/s. A water mass of homogeneous temperature and salinity occurs at the center of the UWE between depths of 100 and 300 m.
This mass has a convex lens shape, and it is therefore often called the Ulleung Warm Lens (Cho et al. 1990;
Kang and Kang 1990). The UWE persists for several months and moves northward along the east coast of Korea (Isoda and Saitoh 1993; Shin et al. 2005).
Although the UWE is formed by the EKWC, the UWE
2. Data and method
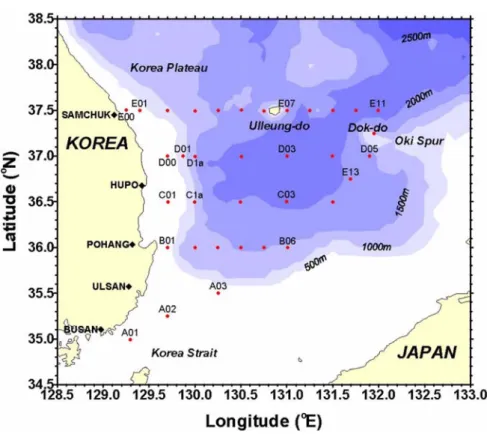
Characteristics of a warm eddy in the Ulleung Basin were revealed by analysis of oceanographic data surveyed by the R/V
Eardofrom 19 to 31 July 2005 (Fig. 2).
Temperature and salinity were measured by conductivity- temperature-depth (CTD) (SEB 911
plus) profilers, and water velocity was measured by a ship-mounted acoustic Doppler current profiler (ADCP, 150 kHz, RDI). Measure- ments were taken along four survey lines including 34 stations from 36.0
oN to 37.5
oN at 0.5
oN intervals.
Vertical profiles of velocity were measured from 12 to 284 m at 8-m intervals every 1 minute for an ensemble average. To calculate absolute velocities, tracking modes were selected as follows. If the bottom depth was shallower than 350 m, a bottom-tracking mode was selected. If the bottom depth was deeper than 350 m, the tracking mode was changed automatically to a navigation mode. To increase confidence in the analyzed data, poor quality data were excluded or averaged based on certain conditions.
For example, data observed during a change of more than 30
oper minute in the ship’s heading were excluded because the turning movement of the ship could cause errors in water velocity measurements. Extraordinary data indicating velocities greater than 150 cm/s or variation in surface velocity direction greater than 90
ocompared to the former ensemble were also excluded. The selected and filtered data were averaged using a 20-minute moving average. If fewer than 10 data points were obtained, those averaged data were omitted in the time average. An average was then calculated for each
±0.1
oN,
±0.1
oE box for data numbers greater than 3.
Temperature and salinity were processed using standard methods and averaged every 1 m depth. Because the CTD sensors had been calibrated by the manufacturer in May Fig. 1. Schematic diagram of the main surface currents
and bottom topography of the East Sea. EKWC:
East Korean Warm Current, NB: Nearshore Branch, NKCC: North Korean Cold Current, LC: Liman Current, UB: Ulleung Basin, YB:
Yamato Basin, JB: Japan Basin (after Shin et al.
2005).
Characteristics of the Ulleung Warm Eddy 285
2005, no further calibration was conducted. For comparison with measured current speed, the dynamic height and geostrophic current were calculated from the CTD data. In this calculation, the bottom depth of the deepest station was regarded as the reference layer. For stations shallower than the reference depth, the dynamic depths were extrapolated based on the vertical gradient to the nearest station (Shin et al. 1996). Bimonthly serial oceanographic data observed by the National Fisheries Research and Development Institute (NFRDI) in the Ulleung Basin before and after July 2005 were analyzed.
3. Results
Structure of UWE05
Fig. 3 presents horizontal distributions of temperature and salinity observed from 19 to 31 July 2005. Near the surface (10 db), water below 19
oC and colder than surrounding water extended from the middle part of eastern South Korea (37.0
oN, 129.5
oE) to the Ulleung Basin. Salinity at the near surface (10 db) was low (less than 34.0 psu) in the northern and southern parts of the survey area and relatively high from the central coast to the Ulleung Basin at 37.0
oN, 129.5
oE, similar to the low temperature distribution.
On the other hand, a strong thermal front was found from Pohang to Ulleung-do (Ulleung Island) at 100 db.
Cold water occupied the coastal side of the front, while water warmer than 10
oC occupied the other side. Salinity at 100 db was low (S < 34.1) in the coastal side of the front, while high salinity water (S > 34.3 psu) was found on the other side. Warm water with temperature above 5
oC at 200 db was horizontally elongated from the southwest to northeast at the center of the Ulleung Basin.
This warm water also had higher salinity (>34.15 psu) than the surrounding waters. The high salinity water at the center of the Ulleung Basin had an elliptical shape.
Based on the 5
oC isothermal line on 200 db temperature, the major axis was 160 km from southwest to northeast, and the minor axis was 80 km from southeast to northwest. The major axis was two times longer than the minor axis.
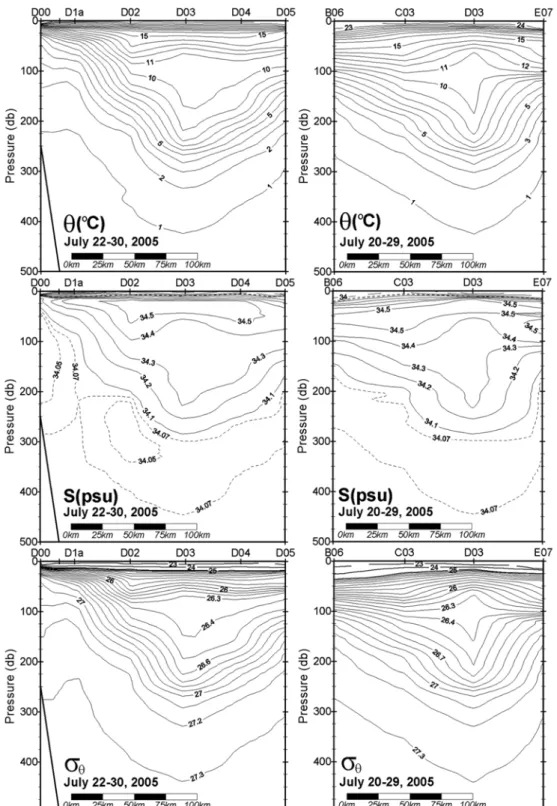
Fig. 4 shows vertical sections of temperature and
salinity along the south-north line (Line SN) and west-east
line (Line WE) depicted in the horizontal distribution of
temperature at 200 db in Fig. 3. In the temperature
section, a convex-lens-shaped isothermal layer is centered
at station D03 between 10
oC and 11
oC. The lens was 123
m thick at station D03. If we define the horizontal size of
the lens based on the intersection of the 10
oC isothermal
Fig. 2. Station map with bottom topography.
line with 100 db depth, then the lens was 100 km from east to west and 75 km from north to south. These horizontal and vertical distributions of temperature and salinity indicate the existence of a mesoscale warm eddy
(called UWE05) in the Ulleung Basin. Temperature decreased with depth, while maximum and minimum salinity layers were found in upper and lower layer.
Maximum salinity higher than 34.50 psu existed between
Fig. 3. Potential temperature (°C) and salinity (psu) at three depths (10, 100, 200 db) observed 19-31 July 2005. In the
potential temperature distribution at 200 db, two lines labeled SN and WE are shown that indicate vertical sec-
tions presented in the next figure.
Characteristics of the Ulleung Warm Eddy 287
the low salinity surface layer and the isothermal layer.
This high salinity water over the isothermal layer was advected from the warm streamer of UWE05.
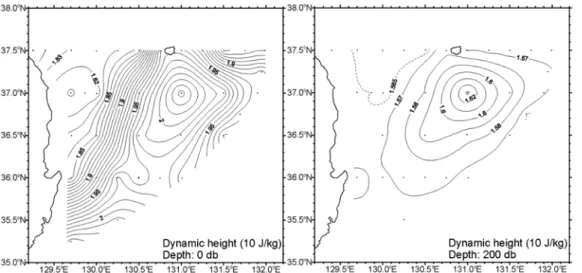
The dynamic topography illustrated in Fig. 5 clearly shows the existence of UWE05 in the Ulleung Basin. At
the surface, the EKWC flowed from the southeast coast of Korea to Ulleung-do and circulated in the Ulleung Basin.
Although the flow speed at 200 db depth was low compared with surface flow, clockwise circulation was continued in the Ulleung Basin.
Fig. 4. Vertical sections of potential temperature (
oC), salinity (psu), and potential density (
σθ, kg/m
-3) along lines WE
(from west to east, along 37
oN) and SN (from south to north, along 130
oE).
Variations of the warm lens and warm streamer The Brunt-Väisälä frequency is useful to describe stability and stratification. To investigate the water mass properties and stability of the lens-shaped homogeneous water at station D03, marking the center of the eddy, Fig. 6 presents temperature and salinity profiles for all observation data and Brunt-Väisälä frequency for station D03.
Distinguishing the seasonal thermocline in the temperature profiles was difficult, except at station D03 and other stations near the center of the eddy. Between the seasonal and the permanent thermocline at station D03, the
minimum Brunt-Väisälä frequency occurred in the homogeneous layer of temperature and salinity. The upper and lower levels at which the Brunt-Väisälä frequency was less than 4 cph were 69 m and 226 m, respectively.
This homogeneous layer had mean values of 10.40
oC potential temperature, 34.35 psu salinity, and 26.37 kg/m
3potential density (
σθ). Thus, the center of the eddy was warmer, saltier, and less dense than peripheral water. The mean salinity of the homogeneous layer in the eddy was also approximately 0.1 psu higher than that found in a previous observational study of the basin conducted in Fig. 5. Dynamic topography at the surface and at 200 db. The reference layer is 2379 db, which was the deepest observation depth. Dynamic depth for stations at which the bottom depth was shallower than the reference layer was extrapolated based on the vertical gradient of dynamic depth to the nearest station (Shin et al. 1996).
Fig. 6. Vertical profiles of potential temperature (
oC), salinity (psu), and potential density (
σθ, kg/m
3) for all the obser- vation stations and Brunt-Väisälä frequency (cph) at station D03. Red lines indicate profiles for station D03.
The vertical blue line in the Brunt-Väisälä frequency profile indicates four cycles per hour. The two horizontal
blue lines indicate depths of the local minimum of Brunt-Väisälä frequency, less than four cycles per hour
between 69 and 226 m in depth.
Characteristics of the Ulleung Warm Eddy 289
summer (Shin et al. 2005).
The existence of the homogeneous temperature and salinity layer in the middle of the thermocline suggests that UWE05 existed over the winter of 2004-2005, as found in former studies (e.g., Gordon et al. 2002; Shin et al. 2005). To examine the existence of UWE05 in the winter of 2004-2005 and its evolution after that winter, bimonthly serial oceanographic data observed by NFRDI were analyzed. Fig. 7 shows horizontal distributions of temperature at 200 m depth from December 2004 to
August 2005. In December 2004, two warm eddies were observed. One was in the Ulleung Basin (hereafter “basin eddy”), and the other was northwest of Ulleung-do (hereafter “northwest eddy”). The central temperatures were 8
oC in the basin eddy and 9
oC in the northwest eddy.
After two months, in February 2005, the central temperature
of the basin eddy had increased to 10
oC, but the
temperature of the northwest eddy was unchanged. In
April, the centers of the eddies were in the same positions,
but a smaller area was occupied by water warmer than
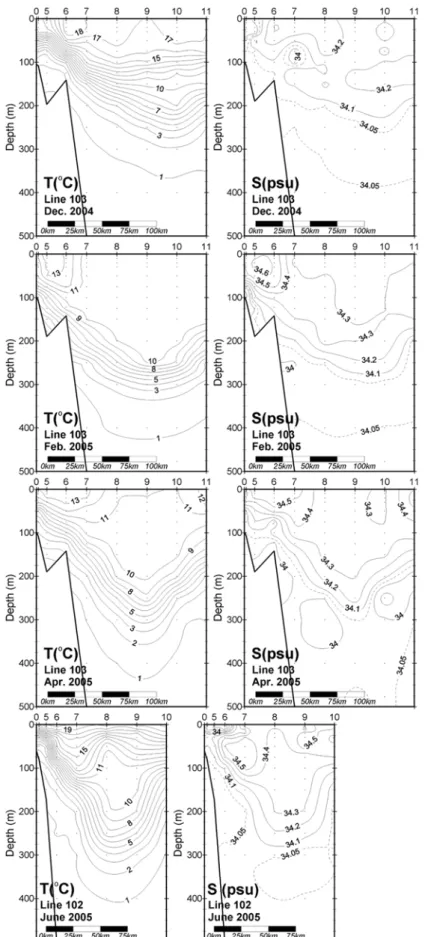
Fig. 7. Horizontal distribution of temperature at 200 m depth observed by NFRDI in December 2004 and February,
April, June, and August 2005, including the distribution in July 2005. Vertical sections for Line 102 in June
2005, Line 103 in December 2004 and February and April 2005, and Line 104 in August 2005 are depicted in
Fig. 8.
Fig. 8. Vertical zonal sections for temperature (
oC) and salinity (psu) across the warm eddy UWE05 (see Fig. 7).
Characteristics of the Ulleung Warm Eddy 291
10
oC in the basin eddy, and the central temperature of the northwest eddy had decreased from 9
oC to 8
oC. In June, the center of the basin eddy was at the same longitude but had shifted 0.5
osouthward in latitude. The northwest eddy had moved approximately 0.1
oeastward from its location in April. The central temperatures of both eddies were approximately 1
oC lower than in April. In August, the area occupied by the central eddy extended throughout the entire Ulleung Basin. The northwest eddy disappeared from the observation area in August.
Fig. 8 shows zonal vertical sections on the line transverse of the center of the basin eddy depicted in Fig. 7. In December 2004, a mixed layer was developing in the surface layer at the center of the eddy. In February 2005, a mixed layer, with temperatures of 10-11
oC was developed by wind and convection from the surface to 250 m depth in the center of the eddy. Salinity was also homogeneous (34.2-34.3 psu) from the surface to 150 m depth. In western part of the eddy, high temperature (>11
oC) and high salinity (>34.4 psu) water was regarded as EKWC water.
In April, warm water covered the surface mixed layer that had developed in winter, and the lens-shaped homogeneous layer was forming. High temperature and
high salinity water appeared at the western and eastern sides of the eddy, suggesting that the EKWC flowed along the side of eddy and formed a warm streamer. In June, the warm lens, which was homogeneous in temperature and salinity, was thinner than that observed in April. Salinity over the warm lens was also higher than that in April.
This indicates that the warm saline streamer extended from the circumference to the center of the eddy surface.
The high temperature and high salinity water covered the top of the homogeneous layer of the eddy in July and August. The horizontal distributions of temperature at 200 m depth and vertical sections of the eddy provided evidence that the eddy existed in the winter of 2004-2005 and that the basin eddy was UWE05.
Table 1 shows the evolution of the 10-11
oC homogeneous layer of UWE05. The thickness of the homogeneous layer decreased with time from 251 m in February to 114 m in August because of a nonlinear effect of advection of the warm streamer in the upper layer into the upper eddy.
From February to July 2005, the mean temperature of the homogeneous layer decreased, but the salinity increased.
However, little change was observed in the water properties following the formation of the homogeneous layer in winter.
Fig. 8. Continued.
Table 1. Time variation of the mean temperature and salinity of the homogeneous temperature (10-11
oC) layer in the middle of UWE05 observed in 2005. D
11and D
10indicate the upper and lower depths of the homogeneous layer, respectively. Depth ranges in February, April, June, and August are not precise because the available NFRDI data were for standard depths
Feb. Apr. Jun. Jul. Aug.
D
11-D
10(m)
(Thickness) 0-251
(251) 20-208
(188) 58-178
(120) 63-185
(122) 73-187
(114)
Mean T. (
oC) 10.70 10.49 10.41 10.40 10.41
Mean S. (psu) 34.28 34.32 34.33 34.35 34.32
Currents and volume transports of UWE05
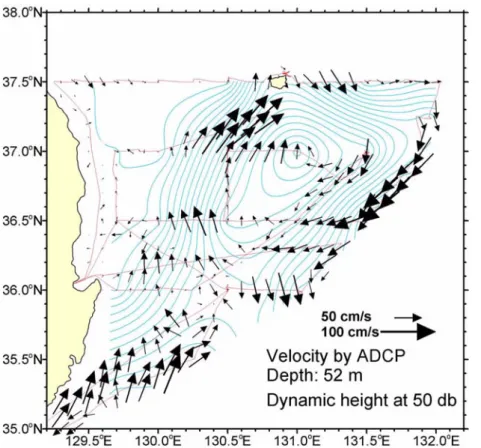
Fig. 9 shows the surface current velocity vectors at 52 m depth observed by the ship-mounted ADCP with dynamic height at 50 db. The current vectors indicate that the UWE05 flowed anti-cyclonically and was consistent with the dynamic height in speed and direction. Current vectors along 37
oN show that current direction changed around the area east of station D03. Thus, the center of UWE05 was between 131
oE and 131.5
oE in longitude.
Horizontal speed was strong in eastern and western parts of the eddy and weak in southern and northern parts. In the southern part of the eddy (around 36.0
oN, 131.0
oE), the current direction was southeastward rather than westward. Thus, a large part of the western water of the eddy did not recirculate, but instead flowed out to the southeast.
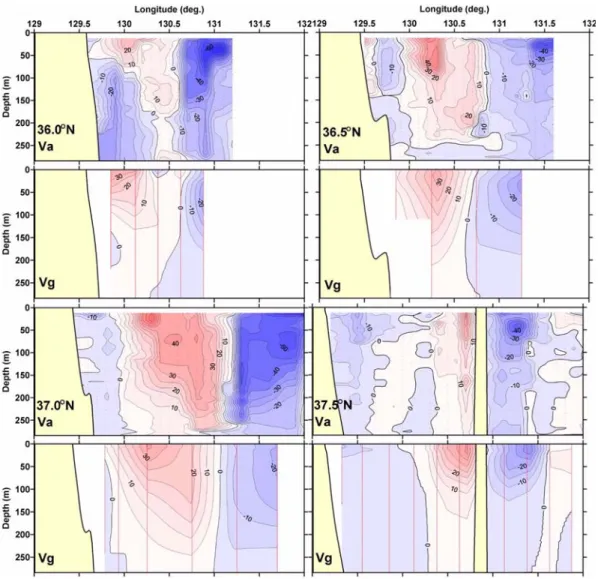
Vertical sections of meridional velocity measured by the ship-mounted ADCP (Va) and calculated dynamically (Vg) are shown in Fig. 10 for the four observation lines depicted in Fig. 2. As a whole, the geostrophic currents were simpler and weaker than the measured currents because of the large distances between stations. At the 36.0
oN section, the EKWC existed at 130
oE with 75 m
depth and 20-30 cm/s flow speed. This shallow EKWC resulted from TWC water passing through the Korea Strait. It seems that two northward current cores with velocities greater than 10 cm/s existed in the measured current at the 36.0
oN section. One was the EKWC; the other was located around 130.4-130.5
oE, east of the EKWC at 150 m. East of 130.6
oE, the current speed was 40-60 cm/s and flowed southward, with a core centered at 130.9
oE.
In the 36.5
oN section, at the southern part of the UWE05, a northward current was observed at 129.9- 130.8
oE, and a southward current east of 130.9
oE. Two current cores were also observed in the northward current area, as was found for the 36.0
oN section. One was located at 130.2-103.3
oE, with current speed of 60-20 cm/s at depths shallower than 100 m, and the other was positioned around 130.7
oE, with current speed of 15-20 cm/s in depths of 50-200 m. The northward current core in the west seems to have been a warm streamer, whereas the eastern core may have been part of the recirculation of the eddy. However, the southward current area had only one current core.
In the transverse section of 37.0
oN, the central latitude Fig. 9. Current velocity vectors measured by ship-mounted ADCP at 52 m depth during the cruise over the contour of
dynamic height (light blue lines) at 50 db. Red lines indicate the ship’s path.
Characteristics of the Ulleung Warm Eddy 293
of UWE05, the northward current was located at 130.0- 131.1
oE, and the southward current was east of 131.2
oE.
Two cores were identified in both the northward and southward current areas. The outer cores were shallower and faster than the inner cores. The outer cores were the warm streamers, and the inner cores represented the warm eddy.
In the section of 37.5
oN, it was difficult to distinguish two cores compared with the 37.0
oN and 36.5
oN sections.
The current was northward west of Ulleung-do and southward on the other side of the island. The southward current occupied a wider area than did the northward current. Summarizing the above results, the EKWC flowed as a warm streamer and rotated around the eddy.
The currents calculated by the dynamical method were simpler and slower than the measured current speed.
Thus, the two northward current cores and subsurface maximum current were not shown in the geostrophic current section.
In the southern East Sea, water masses can be vertically divided into four layers: the surface layer with TWC water, the ESIW, the upper portion of ESPW, and the lower portion of ESPW (Shin et al. 1999). The potential densities (
σt) that divide each layer are 26.9, 27.3, and 27.34 kg/m
3. Based on this definition, geostrophic transports were calculated in each section for the surface layer with TWC water (Table 2). Except for the southward small portion of transport on the coastal side, the most transport resulted from UWE05. The northward transport was 1.20 Sv (S 10
6m
3/s) in section B (36.0
oN).
Northward transport increased to 2.11 Sv in section C (36.6
oN) and had a maximum value of 3.39 Sv in section
≡
Fig. 10. Vertical sections of meridional velocity measured by the ship-mounted ADCP (Va) and calculated dynamically
(Vg). Red and blue areas indicate northward and southward speeds, respectively. Red dots indicate data
points.
C (37.0
oN); it then decreased to 1.23 Sv in section E (37.5
oN). This indicates that the northward EKWC was maximized by the addition of recirculating water when it passed the central latitude of UWE05. On the other side, the southward transport was 1.03 Sv in section E, had a maximum of 2.48 Sv in section D at the central latitude of UWE05, and then decreased to 1.72 Sv in section C and to 0.69 Sv in section B. This southward transport change seems to have resulted from the meandering of the EKWC around UWE05. In the section of the central longitude (131
oE) of the UWE05, the westward transport (2.58 Sv) was similar to the eastward transport (2.32 Sv).
The ADCP-measured transport in the surface layer with TWC water was 5.02 Sv for northward transport and 5.31 Sv for southward transport. The large difference between the measured transport and geostrophic transport was because the distances between stations were too great to calculate the detailed eddy current structure. Furthermore, the geostrophic current was smoothed and averaged between stations. Therefore, it seems that the geostrophic transport in the eddy was underestimated compared with the measured transport.
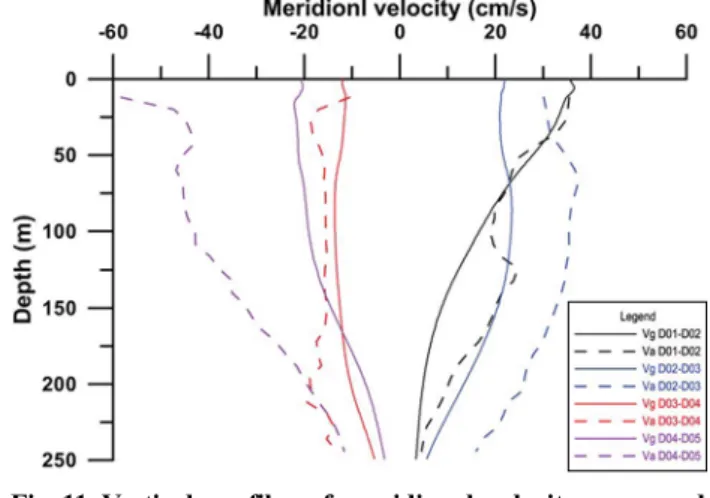
For comparison of measured and calculated velocity profiles, Fig. 11 presents vertical profiles of meridional velocity. The measured velocity profiles were prepared by averaging all available data used for calculation of the geostrophic current between stations. Vertical shears were similar between measured and calculated velocities. In general, however, the measured current speeds were larger than the geostrophic current. In particular, a difference of more than 20 cm/s in the surface layer was found in the
eastern part of the eddy (stations D04 and D05). Thus, the measured transport was larger than the geostrophic current.
Fig. 12 shows the geostrophic transport and its direction for every station pair in the upper layer over the dynamic topography at 50 db. The upper layer in this case is the surface water and the TWC water, i.e., from the sea surface to isopycnal surface of 26.9
σθ.
Mass conservation of geostrophic transport was satisfied in eight of the 15 closed boxes within order of magnitude of
−1. The remaining seven boxes had errors of
±0.1 Sv.
This means that UWE05 was well developed in terms of geostrophic balance. Takikawa
et al.(2005) reported that average absolute transport was 1.54 Sv through the western channel of the Korea Strait. Here, relative transport northward to northeastward was calculated as 1.4 Sv around the southwestern part of UWE05. The transport supplied 1 Sv to the south of UWE05, and 1 Sv flowed out from the south and southeast portions of the eddy.
Therefore, not all EKWC water transported from the Korea Strait circulated around the eddy or was added again to the eddy. It seems that a similar amount of transport flowed out from the eddy as was supplied to the eddy from the EKWC. In other words, the EKWC meandered around UWE05 and was mixed with water surrounding the eddy. In the central latitude (37.0
oN) of UWE05, northward transport (3.4 Sv) and southward transport (3.5 Sv) were nearly equal. However, westward transport (2.5 Sv) was slightly larger than eastward transport (2.3 Sv) in the 131.0
oE section, likely because of the limited number of observation stations to the north of UWE05.
ADCP 0.57 1.55 0.98
Eastward Westward Net SN (131
oE) Geostrophic 2.32
−2.58 0.26
by the ship-mounted ADCP (Va: dotted lines) and
calculated dynamically (Vg: solid lines) between
station pairs along 37.0
oN. Va profiles were com-
piled from averages of all data between stations.
Characteristics of the Ulleung Warm Eddy 295
4. Conclusion and discussion
To understand the characteristics of a warm eddy that formed in the Ulleung Basin, oceanographic data observed in July 2005 were analyzed. The horizontal distribution of temperature at 200 db revealed an area of water warmer than surrounding water in the Ulleung Basin. The traverse temperature section revealed a homogeneous layer between the seasonal and permanent thermocline, providing evidence of a mesoscale warm eddy in the Ulleung Basin (UWE05) at that time. The dynamic topography and surface currents also clearly demonstrated the existence of UWE05, rotating in an anticyclonic direction in the Ulleung Basin. Based on the 5
oC isothermal line on 200 db temperature, the major axis was 160 km from southwest to northeast, and the minor axis was 80 from southeast to northwest.
At station D03 at the center of UWE05, the minimum Brunt-Väisälä frequency was found in the homogeneous layer. This layer had mean values of 10.40
oC potential temperature, 34.35 psu salinity, and 26.37 kg/m
3potential density (
σθ). The existence of this homogeneous layer
suggests that UWE05 existed over winter 2004-2005.
This was further proved by analyzing NFRDI data, which indicated that the homogeneous layer was also formed during that winter and had different temperature and salinity. A warm streamer initially flowed along the circumference of UWE05 and mixed with the upper central water of UWE05. Thus, the high salinity water over the homogeneous layer came from the warm streamer.
Two northward current cores were shown in the western side of the measured current section at the central latitude of UWE05. One was the EKWC on the Korean coast side, and the other was the western part of UWE05.
Geostrophic transport of the upper layer (from the surface to isopycnal surface of 26.9
σθ) of UWE05 was approximately 2.5 Sv at the eastern side of UWE05.
However, measured transport was twice the value of geostrophic transport because the distances between the stations were too great for detailed calculation of the eddy.
Mass conservation of geostrophic transport was well satisfied in the upper layer. North to northeast transport Fig. 12. Geostrophic volume transports (Sv 10
6m
3s
−1) between stations in a layer from the sea surface to an isopycnal surface of
σθ=26.9 over the dynamic height (light blue) at a depth of 50 db. Arrows and numbers indicate the directions and quantities of transport, respectively. Mass balance was satisfied in eight of the 15 closed boxes within an order of magnitude of
−1. Errors of the remaining boxes were +0.1 Sv (blue numbers) in four boxes and
−0.1 Sv (red numbers) in three boxes.
≡
layer. In this study, calculation of the measured transport budget was not possible in each box because the ship tracking was not in a lattice pattern. Furthermore, the geostrophic transport was not consistent with measured transport. Thus, to exactly calculate the transport of this type of eddy, a survey plan for direct current measurements is needed. Detailed surveys of temperature and salinity are also required to understand their detailed variations in the homogeneous layer of the Ulleung warm eddy. In this study, UWE05 was tracked from December 2004 to August 2005. To better understand the movements and lifetimes of this type of eddy, long-term observations and analyses of satellite data are also required.
Acknowledgements
The author would like to thank anonymous reviewers for their valuable comments. This study was supported by project PE98312 of the Korea Ocean Research and Development Institute (KORDI).
References
An H, Shim K, Shin H-R (1994) On the warm eddies in the southwestern part of the East Sea (the Japan Sea). J Korean Soc Oceanogr 29(2):152-163
Arruda WZ, Nof D, O’Brien JJ (2004) Does the Ulleung eddy owe its existence to β and nonlinearities? Deep-Sea Res I 51(12):2073-2090. doi:10.1016/j.dsr.2004.07.014 Cho K-D, Bang T-J, Shim T-B, Yu H-S (1990) Three
dimensional structure of the Ullung Warm Lens. Bull Korean Fish Soc 23(4):323-333
Gordon A, Giulivi CF, Lee CM, Furey HH, Bower A, Talley L (2002) Japan/East Sea intrathermocline eddies. J Phys Oceanogr 32(6):1960-1974. doi:10.1043/1520-0485(2002) 032(1960:JESIE)2.0.CO;2
30(6):1033-1043
Lee DK, Niiler PP (2005) The energetic surface circulation patterns of the Japan/East Sea. Deep-Sea Res II 52(11- 13):1547-1563. doi:10.1016/j.dsr2.2003.08.008
Lie H-J, Byun S-K, Bang I, Cho CH (1995) Physical struc- ture of eddies in the southwestern East Sea. J Korean Soc Oceanogr 30(3):170-183
Lim K-S, Kim K (1995) A numerical study on the interac- tion of Ulleung Warm Eddy with topography and lateral boundary. J Korean Soc Oceanogr, 30(6):565-583 Morimoto A, Yanagi T, Kaneko A (2000) Eddy field in the
Japan Sea derived from satellite altimetric data. J Ocean- ogr 56(4):449-462. doi:10.1023/A:1011184523983 Shin C-W, Byun S-K, Kim C (1996) Comparison between
geostrophic currents and measured currents in the south- western part of the East Sea. J Korean Soc Oceanogr 31(2):89-96
Shin C-W, Byun S-K, Kim C, Seung YH, Lee JH (1999) Circulation in the southwestern East Sea (Japan Sea) determined by an inverse method in July 1993. Ocean Res 21(2):87-97
Shin H-R, Shin C-W, Kim C, Byun S-K, Hwang S-C (2005) Movement and structural variation of warm eddy WE92 for three years in the Western East/Japan Sea.
Deep-Sea Res II 52(11-13):1742-1762. doi:10.1016/
j.dsr2.2004.10.004
Seung YH (2002) A simple analytical model for the interac- tion between the East Korean Warm Current and the Ulleung Warm Eddy. J Korean Soc Oceanogr 37(1):20-26 Seung YH, Nam SY, Lee SY (1990) A combined effect of
differential cooling and topography on the formation of Ulleung Warm Eddy. Bull Korean Fish Soc 22(6):375-384 Takikawa T, Yoon J-H, Cho K-D (2004) The Tsushima
Warm Current through Tsushima Straits estimated from ferryboat ADCP data. J Phys Oceanogr 35(6):1154-1168.
doi: 10.1175/JPO2742.1
Received Jan. 31, 2009 Revised Sep. 2, 2009 Accepted Nov. 11, 2009