반응표면분석에 의한 홍차로부터 기능성 성분의 침출조건 모니터링
신경아1․이고은1․오영환1․노정은1․윤성란1․이정은1․ 김귀란1․전은주1․정헌식2․김정숙3․권중호1†
1경북대학교 식품공학과
2경북대학교 식품생물산업연구소
3계명문화대학 식품영양조리과
Monitoring of Leaching Conditions for Functional Components of Black Tea Using Response Surface Methodology
Gyoungah Shin1, Goeun Lee1, Younghwan Oh1, Jungeun Noh1, Sung-Ran Yoon1, Jeongeun Lee1, Guiran Kim1, Eunju Jeon1, Hun-Sik Chung2, Jeong-Sook Kim3, and Joong-Ho Kwon1†
1
Dept. of Food Science & Technology, Kyungpook National University, Daegu 702-701, Korea
2
Food and Bio-industry Institute, Kyungpook National University, Daegu 702-701, Korea
3
Dept. of Food Nutrition & Culinary, Keimyung College, Daegu 704-703, Korea
Abstract
This study was conducted to predict optimum leaching conditions for functional components of black tea.
Two variables were used to determine the optimum leaching temperature and leaching time with a five-level central composite design and response surface methodology. Soluble solid, reducing sugar, total phenolics, and total flavonoid contents increased as leaching temperature and time increased. The ranges of maximum leaching conditions for these components were 78.28~87.08oC and 3.97~4.27 min. Vitamin C level was maximal at 61.29oC and 2.68 min. Electron donating ability showed the highest values at 68.30oC and 0.54 min. Based upon the superimposed results, it was predicted that the optimal ranges of leaching conditions for some functional components from black tea were 63~79oC for 1.5~2.1 min.
Key words: black tea, leaching, response surface methodology, electron donating ability
†Corresponding author. E-mail: [email protected]
†Phone: 82-53-950-5775, Fax: 82-53-950-6772
서 론
차는 다년생 상록수인 차나무의 어린잎이나 순을 재료로 하여 만든 음료로 오래전부터 동서양에서 널리 식용해오고 있는 건강기호식품이다. 현재 재배되고 있는 차나무는
Camella sinensis var. sinensis, Camella sinensis var.
cambodiensis, Camella sinensis var. assamica 등이 있으
며, 잎의 형태 및 성분상 차이에 따라 다르게 가공․유통되고 있다. 차의 종류는 차나무잎이 가지는 고유한 특징인 품종, 채엽시기, 재배지 등에 따라서 분류하기도 하지만 제조방법 에 따라 불발효차, 반발효차, 발효차, 후발효차로 구분하는 것이 기본적이다(1). 불발효차는 채엽 후 건조시킨 녹차이 며, 발효차는 채엽 후 발효과정을 거친 홍차이다. 전세계적 으로 차의 생산량 중 홍차가 차지하는 비율이 약 80%정도 되지만 녹차에 비해 성분적 특징이나 건강 기능성이 비교적 덜 확인되어져 있다(2). 또한 차는 우려내는 방법에 따라서 식미에 상당한 차이를 보이는 것으로 알려져 있다(1,3).홍차와 녹차의 성분상 차이는 발효 유무에 기인되는데 홍 차는 multimeric polyphenols 함량이 높고 녹차는 mono- meric polyphenols 함량이 높은 것이며, 홍차의 전반적인 구 성성분함량은 발효정도에 따라 차이가 크지만 carbohy- drates, amino acids, thearubigins, catechins, phenolic acids 와 depsides, methylxanthines, minerals, flavonols, thea- flavins, proteins, volatiles 등으로 이루어진 것으로 알려져 있다(4). 한편, 근래에 들어 규명된 홍차의 건강 기능성으로 는 중금속 제거작용(5), 항균작용(6), 항돌연변이원성 억제 작용(7), 항비만작용(8) 및 항산화작용(9) 등이 있다. 홍차의 이러한 건강기능성과 고유한 기호특성 때문에 소비가 차츰 늘어나고 있는 추세이어서 홍차의 유용성분들의 침출을 극 대화시킬 수 있는 제조방법 뿐만 아니라 음용방법에 대한 연구가 필요한 실정이다.
따라서 이 연구에서는 홍차의 건강 기능성이 향상된 음용 을 위한 침출조건을 최적화하기 위하여 홍차티백을 각기 다 른 온도와 시간에서 물로 침출시킨 후 침출액의 유용성분
함량 및 항산화성을 조사하여 반응표면분석을 실시하였다.
재료 및 방법
실험재료
실험용 홍차는 홍차티백을 사용하였으며 대형할인마트 식품관에서 판매하는 U사 제품(2005년 3월 15일 제조)을 구 입하여 사용하였다.
침출조건 설정을 위한 실험계획
홍차 침출액의 제조는 일정 온도(20~100oC)의 증류수 150 mL에 홍차 티백(1.5 g)을 담그어 일정 시간(0.5~4.5 min) 정치하여 제조하였다. 홍차의 물 침출특성의 모니터링 과 침출조건의 최적화를 위하여 반응표면분석법(repose surface methodology, RSM)을 이용하였고(10,11), 침출조 건에 대한 실험계획은 중심합성계획을 실시하여 침출공정 에 중요한 독립변수(Xi)로 고려되는 인자 즉, 침출온도(X1) 와 침출시간(X2)에 대한 실험범위를 설정하여 각각 5단계로 부호화하여 10군으로 구분하였다(Table 1). 그리고 이들 독 립변수에 의해 영향을 받는 종속변수(Yn) 즉, 침출물의 품질 인자로서 침출수율(Y1), 환원당(Y2), 총 페놀 함량(Y3), 총 플라보노이드 함량(Y4), 비타민 C 함량(Y5), 전자공여능(Y6) 등을 측정하여 그 값을 회귀분석에 사용하였다.
침출수율 측정
침출수율은 시료 10 mL를 항량을 구한 수기에 취하여 105oC에서 증발 건조시킨 후 그 무게를 측정하였으며, 침출 물 조제에 사용된 원료량(건물량)에 대한 백분율로서 나타 내었다(12).
환원당 함량 측정
침출액의 환원당 함량은 Somogyi 변법(13)에 준하여 측 정하였으며, 이때 표준품으로 glucose를 사용하였다.
총 페놀 함량 측정
침출액의 총 페놀 함량은 Folin-Denis법(14)에 따라 측정 하였다. 즉, 시료 0.1 mL에 증류수를 가하여 2 mL로 만든 후 Folin-Denis 시약 2 mL를 가하여 혼합하고 3분 후 10%
Na2CO3 2 mL를 넣어 진탕하고 1시간 방치하여 UV spec- trophotometer(UVmini-1240, Shimadzu, Japan)를 이용하 여 700 nm에서 흡광도를 측정하였다. 이때 표준물질로는 gallic acid를 사용하였다.
총 플라보노이드 함량 측정
침출액의 총 플라보노이드 함량은 시료 0.5 mL에 ethyl alcohol 1.5 mL, 10% aluminum nitrate 용액 0.1 mL, 증류수 2.8 mL를 가하여 혼합하고 30분간 방치한 후 UV spec- trophotometer를 이용하여 410 nm에서 흡광도를 측정하였 다. 이때 표준물질로는 hesperidin을 사용하였다(15).
비타민 C 함량 측정
침출액의 비타민 C 함량은 2,4-dinitrophenol hydrazine (DNP) 비색법(16)으로 측정하였다. 즉, 시료 2 mL에 indo- phenol 2~4 방울, metaphosphoric acid 2 mL를 넣어 충분히 혼합하고 여기에 DNP 1 mL를 가하여 50oC에서 1시간 방치 시킨 즉시 방냉한 후 85% H2SO4 용액 5 mL를 vortex상에서 가하여 실온에서 30분간 방치, 540 nm에서 흡광도를 측정하 였다. 이 때 표준물질로는 L-ascorbic acid를 사용하였다.
전자공여능 측정
침출액의 전자공여능(electron donating ability, EDA)은 α,α-diphenyl-β-picrylhydrazyl(DPPH)를 사용한 방법(17) 으로 측정하였다. 즉, DPPH 시약 12 mg을 absolute ethanol 100 mL에 용해한 후 증류수 100 mL를 가하고 50% ethanol 용액을 blank로 하여 517 nm에서 DPPH 용액의 흡광도를 약 1.0으로 조정한 후 이 용액 5 mL를 취하여 추출물 1 mL와 혼합한 후 상온에서 30초간 방치시킨 다음 517 nm에서 흡광 도를 측정하여 시료 첨가구와 무첨가구의 흡광도 차이를 백 분율(%)로 표시하여 전자공여능으로 하였다.
EDA(%)=
(
1- 시료첨가시의 흡광도)
×100공시험의 흡광도 최적 침출조건의 예측
최적 추출조건은 반응표면분석으로 얻은 추출수율, 총 페 놀 함량, 총 플라보노이드 함량, 전자공여능 등의 contour map을 superimposing했을 때 중복되는 부분의 범위로 예측 하였다.
결과 및 고찰
침출수율 변화
홍차의 침출 온도와 시간에 따른 수용성 성분의 침출수율 을 측정한 결과는 Table 1에 나타내었다. 이 결과를 바탕으 로 반응표면분석한 회귀식은 Table 2에, contour map은 Fig.
1에 각각 나타내었다. 회귀식의 R2는 0.9908이고 1% 이내의 범위에서 유의성이 인정되었고, 침출수율은 침출 온도와 시 간이 증가할수록 높아지는 경향을 보였다. 이는 홍차분말에 함유된 수용성 성분들의 용해도 증가에 기인된 결과로 생각 되고, 녹차에 대한 연구결과(3)와 유사하였다. 반응표면분석 을 통하여 예측된 정상점은 최대점을 나타내었으며, 침출수 율은 침출온도 80.93oC 및 침출시간 4.20분에서 최대값 15.38%로 예측되었다(Table 3). 침출수율에 대한 침출조건 이 미치는 영향은 Table 4와 같이 침출시간이 침출온도보다 큰 영향을 미치는 것으로 나타났다. 한편, 한국산 각종 허브 차의 경우는 가용성 고형분 침출에서 온도의 영향은 거의 없으며(18), 밤 내피차의 경우 단당류의 침출은 온도와는 상 관성이 없으나 침출 시간과 정비례하는 것으로 보고된 바
Table 1. Experimental data on extract yield, reducing sugar, total phenolics, total flavonoid, vitamin C and electron donating ability (EDA) of black tea under different leaching conditions based on central composite design for response surface analysis
Exp.
No1)
Leaching condition Extract yield (%)
Reducing sugar (mg%)
Total phenolics (mg%)
Total flavonoid (mg%)
Vitamin C (mg%)
EDA Temp. (oC) Time (min) (%)
1 2 3 4 5 6 7 8 9 10
80 ( 1) 80 ( 1) 40 (-1) 40 (-1) 60 ( 0) 60 ( 0) 100 ( 2) 20 (-2) 60 ( 0) 60 ( 0)
3.5 ( 1) 1.5 (-1) 3.5 ( 1) 1.5 (-1) 2.5 ( 0) 2.5 ( 0) 2.5 ( 0) 2.5 ( 0) 4.5 ( 2) 0.5 (-2)
13.26±0.79 8.12±0.80 8.90±0.52 3.57±1.00 10.21±2.58 9.62±0.20 12.18±2.74 3.30±2.60 14.71±1.37 2.08±0.49
1.31±0.04 0.96±0.04 0.98±0.05 0.58±0.06 0.99±0.17 1.07±0.15 1.38±0.11 0.47±0.02 1.61±0.09 0.55±0.05
69.42±0.36 48.16±0.21 46.92±2.26 33.22±4.64 62.80±3.91 58.84±6.56 72.20±3.66 24.35±0.67 73.88±6.96 27.97±1.43
8.97±0.43 4.54±0.53 3.42±0.33 1.25±0.32 4.89±1.46 4.50±0.10 6.53±0.83 0.35±0.22 7.26±1.17 0.82±0.31
14.52±4.30 13.85±3.21 11.18±0.28 10.66±0.91 20.80±1.85 21.56±0.74 7.91±0.82 8.07±0.07 12.20±1.44 3.56±0.44
78.89±1.06 82.29±1.73 80.72±3.89 81.03±4.93 82.11±2.91 82.94±0.98 77.33±1.01 76.76±8.82 77.81±1.95 86.90±1.05
1)The number of experimental condition by central composite design.
Table 2. Polynomial equations calculated by RSM program on extract yield, reducing sugar, total phenolics, total flavonoid, vitamin C and electron donating ability of black tea
Responses Polynomial equations1) R2 Significance
Extract yield Reducing sugar Total phenolics Total flavonoid Vitamin C EDA
Y=-11.542852+0.268781X1+4.826372X2-0.001264X12-0.002355X1X2-0.34139X22
Y=-0.441506+0.019104X1+0.199939X2-0.000057040X12
-0.000673X1X2+0.0159598X22
Y=-25.407170+1.135638X1+15.205286X2-0.006809X12
+0.094481X1X2-2.061721X22
Y=-4.441014+0.118908X1+0.861254X2-0.000843X12
+0.028248X1X2-0.186638X22
Y=-33.374464+0.967914X1+17.340493X2-0.007890X12
-0.001879X1X2-3.182815X22
Y=68.742396+0.501976X1+0.574721X2-0.003359X12
-0.038620X1X2-0.016314X22
0.9908 0.9744 0.9604 0.9796 0.9075 0.9337
0.0004 0.0028 0.0066 0.0018 0.0340 0.0180
1)X1: leaching temperature (oC), X2: leaching time (min).
Table 3. Predicted levels of optimum leaching conditions for extract yield, reducing sugar, total phenolics, total flavonoid, vitamin C and electron donating ability of black tea by ridge analysis
Responses Leaching condition Estimated maximum
responses Morphology
Temp. (oC) Time (min) Extract yield
Reducing sugar Total phenolics Total flavonoid Vitamin C
Electron donating ability
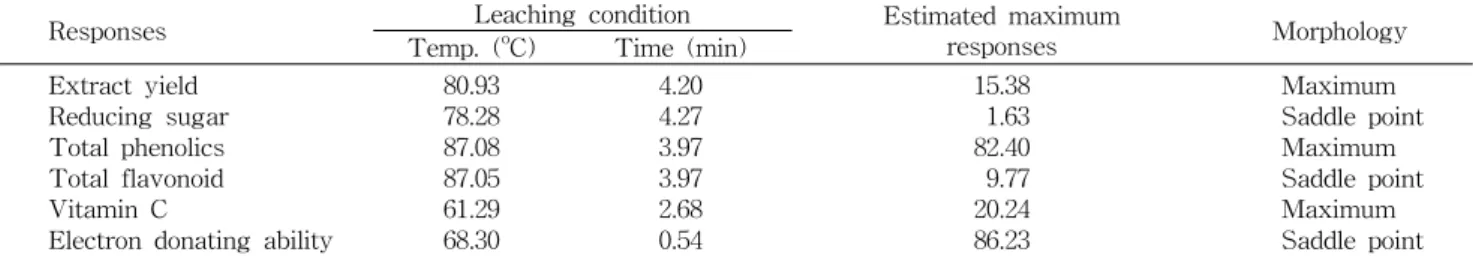
80.93 78.28 87.08 87.05 61.29 68.30
4.20 4.27 3.97 3.97 2.68 0.54
15.38 1.63 82.40 9.77 20.24 86.23
Maximum Saddle point Maximum Saddle point Maximum Saddle point
2.00 4.75 Temperature (℃) 7.50
10.25
13.00 14.38
20 40 60 80 100
Time (min)
0.5 1.5 2.5 3.5 4.5
2.00 4.75 Temperature (℃) 7.50
10.25
13.00 14.38
20 40 60 80 100
Time (min)
0.5 1.5 2.5 3.5 4.5
Fig. 1. Contour map for total extract yield of black tea as a function of leaching temperature and time.
있다(19).
환원당 함량 변화
침출조건에 따른 환원당 함량을 측정한 결과는 Table 1에 나타내었고, 이 결과에 대한 회귀식은 Table 2와 같다. 반응
0.40
0.66
0.92 1.18
1.44 1.57
0.5 1.5 2.5 3.5 4.5
20 40 60 80 100
Temperature (℃)
Time (min) 0.40
0.66
0.92 1.18
1.44 1.57
0.5 1.5 2.5 3.5 4.5
20 40 60 80 100
Temperature (℃)
Time (min)
Fig. 2. Contour map for reducing sugar of black tea as a function of leaching temperature and time.
표면분석한 회귀식의 R2는 0.9744이고, 1% 이내의 범위에서 유의성이 인정되었다. 환원당 함량의 contour map은 Fig.
2에 나타내었으며 침출 온도와 시간이 증가함에 따라 높아 지는 경향을 보였다. 홍차의 대표적 환원당은 glucose와
Table 4. Analysis of variables of regression model for ex- tract yield, reducing sugar, total phenolics, total flavonoid, vitamin C and electron donating ability according to leach- ing conditions of black tea
Responses
F-Ratio Leaching condition
Temperature Time
Extract yield Reducing sugar Phenolics Flavonoid Vitamin C
Electron donating ability
53.37***
22.23***
17.62***
35.99***
8.59**
7.52**
90.99**
28.18***
15.55***
29.62***
10.02**
9.83**
*Signigicant at 10% level; **significant at 5% level; ***signifi- cant at 1% level.
fructose인 것으로 밝혀져 있는데(20), 이들의 용해도가 증가 되었기 때문으로 생각된다. 반응표면분석을 통하여 예측된 정상점은 안장점이어서 능선분석한 결과, 최적 침출조건은 침출온도 78.28oC, 침출시간 4.27분이며 최대값은 1.63 mg%
로 예측되었다(Table 3). 환원당의 침출에 대한 침출조건의 영향은 Table 4에 나타낸 바와 같이 침출온도와 침출시간이 비슷하게 약간의 영향을 미치는 것으로 나타났다.
총 페놀 함량 변화
침출조건에 따른 총 페놀 함량을 측정한 결과는 Table 1에, 이를 반응표면분석한 회귀식은 Table 2에 각각 나타내 었다. 회귀식의 R2는 0.9604이고 1% 이내의 범위에서 유의 성이 인정되었다. 회귀식을 바탕으로 한 contour map은 Fig.
3과 같으며, 총 페놀 함량은 침출 온도와 시간이 증가할수록 높아지는 경향을 나타내었다. 반응표면분석을 통해 예측된 정상점은 최대점이며, 침출조건은 침출온도 87.08oC, 침출시 간 3.97분, 최대값은 82.40 mg%이었다(Table 3). 총 페놀성 화합물의 침출에 침출 온도와 시간은 영향을 적게 미치는 것으로 나타났다(Table 4). 총 페놀성 화합물이 신선 차잎에 서 가장 많이 함유된 고형분이며 이들 중 catechin인 (-)-epigallocatechin gallate, (-)-epigallocatechin, (-)-ep- icatechin gallate, (-)-epicatechin 등이 대표적인 성분이다 (21). 이러한 catechin은 차의 건강 기능성과 밀접한 연관성
25.00 37.50
50.00 62.50
75.00
Temperature (℃)
20 40 60 80 100
Time (min)
0.5 1.5 2.5 3.5 4.5
25.00 37.50
50.00 62.50
75.00
Temperature (℃)
20 40 60 80 100
Time (min)
0.5 1.5 2.5 3.5 4.5
Fig. 3. Contour map for total phenolics of black tea as a function of leaching temperature and time.
이 있으며(5-7), 그 함량은 채엽 시기에 의존적이고 녹차용 차잎보다는 홍차용 차잎에서 높은 것으로 알려져 있다(4).
또한 catechin은 홍차의 제조과정 중 약 75%가 산화와 중합 반응을 거쳐 theaflavin이나 thearubigin과 같은 물질로 전환 되는 것으로 보고(22)된 바 있다.
총 플라보노이드 함량 변화
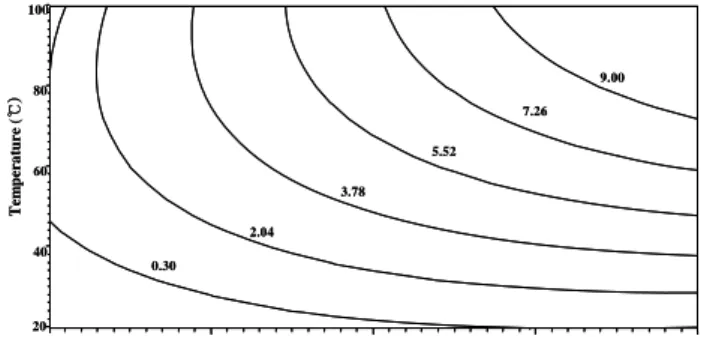
침출조건에 따른 플라보노이드 함량을 측정한 결과는 Table 1에, 이 결과를 가지고 반응표면분석한 회귀식은 Table 2에 각각 나타내었다. 침출조건에 따른 총 플라보노이 드 함량변화를 나타내는 회귀식의 R2는 0.9796이고 1% 이내 의 범위에서 유의성이 인정되었다. 회귀식으로 작성한 con- tour map은 Fig. 4에 나타내었고 침출 온도와 시간이 증가함 에 따라 총 플라보노이드의 함량도 증가함을 보였다. 반응표 면분석으로 예측된 정상점은 안장점이고, 이때의 침출조건 은 침출온도 87.05oC, 침출시간 3.97분이고 최대값은 9.77 mg%이었다(Table 3). 침출조건의 영향은 Table 4와 같이 침출온도가 침출시간보다 다소 영향을 더 미치는 것으로 나 타났다.
비타민 C 함량 변화
침출조건에 따른 비타민 C 함량을 측정한 결과는 Table 1에, 이 결과로 반응표면분석한 회귀식은 Table 2에 각각 나타내었다. 회귀식의 R2는 0.9075이고, 5% 이내의 범위에 서 유의성이 인정되었다. 이러한 회귀식으로 작성한 contour map은 Fig. 5와 같으며, 비타민 C의 침출은 50~76oC와 2.0
~3.5분의 조건에서 높은 것으로 나타났다. 반응표면분석으 로 예측된 정상점은 최대점이고, 이때의 침출조건은 침출온 도 61.29oC, 침출시간 2.68분이고 최대값은 20.24 mg%이었 다(Table 3). 비타민 C의 침출에 시간과 온도의 영향은 크지 않는 것으로 나타났다(Table 4).
전자공여능 변화
전자공여능은 항산화성을 나타내는 지표로써 홍차의 침 출조건에 따른 전자공여능을 측정한 결과는 Table 1에 나타 내었고, 이를 가지고 반응표면분석한 회귀식은 Table 2에
0.30 2.04
3.78 5.52
7.26 9.00
Temperature (℃)
20 40 60 80 100
Time (min)
0.5 1.5 2.5 3.5 4.5
0.30 2.04
3.78 5.52
7.26 9.00
Temperature (℃)
20 40 60 80 100
Time (min)
0.5 1.5 2.5 3.5 4.5
Fig. 4. Contour map for total flavonoid of black tea as a function of leaching temperature and time.
1.75 6.50
11.25 16.00
18.38
Temperature (℃)
20 40 60 80 100
Time (min)
0.5 1.5 2.5 3.5 4.5
1.75 6.50
11.25 16.00
18.38
Temperature (℃)
20 40 60 80 100
Time (min)
0.5 1.5 2.5 3.5 4.5
Fig. 5. Contour map for vitamin C of black tea as a function of leaching temperature and time.
78.75 80.13
81.50 82.88
84.25 85.63
Temperature (℃)
20 40 60 80 100
Time (min)
0.5 1.5 2.5 3.5 4.5
78.75 80.13
81.50 82.88
84.25 85.63
Temperature (℃)
20 40 60 80 100
Time (min)
0.5 1.5 2.5 3.5 4.5
Fig. 6. Contour map for electron donating ability of black tea as a function of leaching temperature and time.
나타내었다. 회귀식의 R2는 0.9337이고 5% 이내에서 유의성 이 인정되었다. 회귀식으로 작성한 contour map은 Fig. 6에 나타내었다. 반응표면분석으로 예측된 정상점은 안장점으 로 능선분석을 실시한 결과, 최대값은 86.23%이었고 이때의 침출조건은 침출온도 68.30oC, 침출시간 0.54분이었다(Table 3). 전자공여능에 대한 침출조건의 영향은 Table 4와 같이 침출시간과 침출온도의 영향이 미미한 것으로 나타났다. 홍 차의 항산화성은 theaflavin, thearubigin, catechin 등의 유 리기 생성 억제, 유리기 소거, 금속이온 봉쇄 작용에 의한 것으로 알려져 있다(9).
최적 침출조건 예측
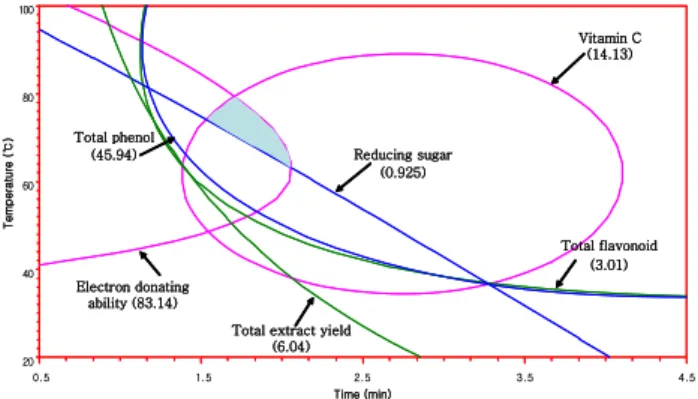
홍차의 침출수율, 환원당, 총 페놀 함량, 총 플라보노이드 함량, 비타민 C, 전자공여능 등을 모두 만족시킬 수 있는 최적의 침출조건을 설정하기 위하여 각 특성들의 contour map을 superimposing한 결과는 Fig. 7과 같으며, 음용 홍차 의 최적 침출조건으로는 63~79oC와 1.5~2.1분으로 예측되 었다. 이러한 결과는 녹차의 경우(3)보다 저온과 단시간이었다.
요 약
반응표면분석법을 통하여 홍차의 침출 온도와 시간에 따 른 침출물의 기능성 성분과 항산화성을 모니터링하고 최적
Electron donating ability (83.14)
Vitamin C (14.13)
Total flavonoid (3.01) Total phenol
(45.94)
Total extract yield (6.04)
Reducing sugar (0.925)
20 40 60 80 100
0.5 1.5 2.5 3.5 4.5
Time (min)
Temperature (℃)
Electron donating ability (83.14)
Vitamin C (14.13)
Total flavonoid (3.01) Total phenol
(45.94)
Total extract yield (6.04)
Reducing sugar (0.925)
20 40 60 80 100
0.5 1.5 2.5 3.5 4.5
Time (min)
Temperature (℃)
Fig. 7. Superimposed contour maps of optimized conditions for total extract yield, reducing sugar, total phenolics, total flavonoid, vitamin C and electron donating ability of black tea as a function of leaching temperature and time.
침출조건을 예측하였다. 수용성 성분의 침출수율, 환원당, 총 페놀, 총 플라보노이드 함량 등은 침출온도가 높아지고 침출시간이 길어짐에 따라 증가되는 경향을 보였고, 78.28~
87.08oC와 3.97~4.27분으로 침출할 경우 최대값을 얻을 수 있었다. 비타민 C는 침출온도가 높거나 낮고 침출시간이 길 거나 짧을 경우에 감소하였으며 61.29oC와 2.68분에서 가장 높았다. 전자공여능은 침출온도가 높거나 낮고 침출시간이 길어짐에 따라 감소하였고 68.30oC와 0.54분에서 최대값을 나타내었다. 이로써 홍차 티백의 기능성 관련 성분을 고려한 최적 침출조건은 침출온도 63~79oC와 침출시간 1.5~2.1분 으로 예측되었다.
문 헌
1. Oh SL. 1993. What is tea. Bull Food Technol 6: 115-117.
2. Dufresne CJ, Farnworth ER. 2001. A review of latest re- search findings on the health promotion properties of tea.
J Nutr Biochem 12: 404-412.
3. Jang MJ, Ha HJ, Yoon SR, Noh JE, Kwon JH. 2006.
Prediction of optimal leaching conditions for green tea. J
Korean Soc Food Sci Nutr 35: 747-753.
4. Harold N, Graham PD. 1992. Green tea composition, con- sumption and polyphenol chemistry. Prev Med 21: 334-350.
5. Kim MJ, Rhee SJ. 1994. Effect of Korean green tea, oolong tea and black tea beverage on the removal of cadmium in rat. J Korean Soc Food Nutr 23: 784-791.
6. Yeo SG, Ahn CW, Kim IS, Park YB, Park YH, Kim SB.
1995. Antimicrobial effect of tea extracts from green tea, oolong tea and black tea. J Korean Soc Food Nutr 24:
293-298.
7. Yeo SG, Kim IS, Ahn CW, Kim SB, Park YH. 1995.
Desmutagenicity of tea extracts from green tea, oolong tea and black tea. J Korean Soc Food Nutr 24: 160-168.
8. Jeon JR, Kim JY, Lee KM, Cho DH. 2005. Anti-obese ef- fects of mixture contained pine needle, black rea and green tea extracts. J Korean Soc Appl Biol Chem 48: 375-381.
9. Luczaj W, Skrzydlewska E. 2005. Antioxidative properties of black tea. Prev Med 40: 910-918.
10. Lee GD, Lee JE, Kwon JH. 2000. Application of response surface methodology in food industry. Food and Industry
33: 33-45.
11. Gontard N, Guilbert S, Cuq JL. 1992. Edible wheat gluten films influence of the main process variables on film prop- erties using response surface methodology. J Food Sci 57:
190-196.
12. Kwon JH, Belanger JMR, Pare JRJ. 2003. Optimization of microwave-assisted extraction (MAP) for ginseng compo- nents by response surface methodology. J Agric Food
Chem 51: 1807-1810.
13. Whistler RL, Wolfrom ML. 1962. Methods in Carbohydrate
Chemistry. New York, USA. Vol. 1, p 380.
14. Amerine MA, Ough CS. 1980. Methods for Analysis of
Musts and Wine. Wiley & Sons, New York, USA. p
176-180.15. Hong JJ, Ahn TH. 2005. Changes in total flavonoid and total polyphenol contents of leafy vegetables (spinach, chard and whorled mallow) by blanching time. Korean J Food
Cookery Sci 21: 190-194.
16. The Korean Society of Food Science and Nutrition. 2000.
Handbook of Experiments in Food Science and Nutrition.
Hyoil Press, Seoul, Korea. p 256-259.
17. Blois MS. 1958. Antioxidant determination by the use of a stable free radical. Nature 4617: 1198-1199.
18. Joo SJ, Choi KJ, Kim KS, Park SG, Kim TS, Oh MH, Lee SS, Ko JW. 2002. Characteristics of mixed tea prepared with several herbs cultivated in Korea. Korean J Food
Preserv 9: 400-405.
19. Jeon BG, Lee JR, Ji JM. 2000. The development of functional beverage from the inner skin of the chestnut, Castanea
crenata (I). Korean J Food Nutr 13: 226-234.
20. Choi OJ, Choi KH. 2003. The physicochemical properties of Korean wild teas (green tea, semi-fermented tea, and black tea) according to degree of fermentation. J Korean
Soc Food Sci Nutr 32: 356-362.
21. Lee YJ, Ahn MS, Oh WT. 1998. A study on the catechins contents and antioxidative effect of various solvent extracts of green, oolong and black tea. J Food Safety 13: 370-376.
22. Bokudava MA, Skobeleva NI. 1980. The biochemistry and technology of tea manufacture. Crit Rev Food Sci Nutr 12:
303-370.
(2007년 8월 23일 접수; 2007년 11월 19일 채택)