http://www.medicinalcrop.org
http://dx.doi.org/10.7783/KJMCS.2016.24.4.263
반응표면분석법을 이용한 용아초 기능성 성분의 마이크로웨이브 최적 추출조건 예측
박종진·이원영†
경북대학교 식품공학부 식품응용공학과
Prediction of Optimal Microwave Extraction Conditions for Functional Compounds from Agrimonia pilosa Ledeb Using Response Surface Methodology
Jong Jin Park and Won Young Lee†
Department of Food Science and Technology, Kyungpook National University, Daegu 41566, Korea.
ABSTRACT
Background: In this study, microwave extraction was used, which is an effective method to extract useful bioactive substances as it requires low quantities of solvent and short time periods. The aim of this study was to determine the optimal extraction conditions for Agrimonia pilosa Ledeb.
Methods and Results: The independent variables were ethanol concentration, microwave power, and extraction time, each of which had five levels. The dependent variables were total polyphenol and total flavonoid content, and DPPH radical scavenging activity. To determine the optimal extraction conditions for bioactive compounds, a response surface methodology was employed.
Contour maps were generated from polynomial equations. The optimal conditions were then assumed by superimposing these con- tour maps. Based on the resulting graph, the optimal microwave extraction conditions for Agrimonia pilosa Ledeb were determined as 42 - 48% ethanol concentration, 240 - 280 W microwave power, and 13 - 20 min of extraction time.
Conclusions: Ethanol concentration had a significant effect on microwave extraction, in terms of total polyphenol and total fla- vonoid content, as well as DPPH radical scavenging activity. Microwave power and extraction time influenced the total polyphenol content, but not the total flavonoid content or the DPPH radical scavenging activity.
Key Words: Agrimonia pilosa Ledeb, Extraction, Microwave, Optimization, Response Surface Methodology
INTRODUCTION
Agrimonia pilosa Ledeb belongs to the Rosaceae family and has been used in traditional oriental medicine for tumors, hematuresis, and uterine bleeding (Bae and Sohn, 2005). Previous studies have shown that A. pilosa contains antibacterial (Bae and Sohn, 2005), anti-aging (Yoon et al., 2012), anti-oxidative, antitumor (Min et al., 2008), whitening (Kim et al., 2011a, b), and inhibitory effect on allergic reaction (Kim, 2010). It has also been reported
from previous studies that A. pilosa contains compounds of ellagic acid, rutin, taxifolin, coumarin and luteolin (Pei et al., 1990; Gao et al., 2015).
Although A. pilosa was studied about medical actions and biological activity effects, there are less research about extraction condition. There are various extraction methods available, including ultrasonic, distillation, supercritical fluid and microwave extraction. Among them, microwave-assisted extraction (MAE) is considered an effective extraction technique, and it is an economical method requiring low
†
Corresponding author: (Phone) +82-53-950-7763 (E-mail) [email protected]
Received 2016 March 21 / 1st Revised 2016 May 19 / 2nd Revised 2016 June 13 / 3rd Revised 2016 July 8 / Accepted 2016 July 8
This is an open access article distributed under the terms of the Creative Commons Attribution Non-Commercial License (http://creativecom-
mons.org/licenses/by-nc/3.0/) which permits unrestricted non-commercial use, distribution, and reproduction in any medium, provided the original
solvent consumption and less time (Giese, 1992;
Schiffmann, 1992; Kwon et al., 2000, 2007). To find optimal condition, response surface methodology (RSM), which is one of the statistical method to optimizing conditions was applied. Because RSM have an advantage when multiple variables and their interactions are evaluated (Théodore and Panda, 1995). Many researchers also used RSM for optimize process. (Lee et al., 2006, 2012).
The aim of this study is to determine the optimum extraction condition of DPPH radical scavenging activity (DPPH) and functional ingredients, including total polyphenol content (TPC) and total flavonoid content (TFC) by using microwave-assisted extraction and response surface methodology. Those results will be fundamental data to set microwave extraction condition of A. pilosa.
MATERIALS AND METHODS
1. Sample preparation
The Agrimonia pilosa Ledeb used in this study was harvested from the Gyeongsang province in Korea. The dried sample was purchased in the market. It was ground to powder by passing them through 40 and 60 mesh sieve. The ground sample was packed in sealed plastic bags and stored in a −20℃ freezer for further use.
2. Microwave-assisted extraction (MAE)
A microdigest machine (Soxwave 100, Prolabo, Fontenay, France) was used to extract total polyphenol, total flavonoid, and antioxidants. The device operates at a frequency of 2,450 MHz and is equipped with a reflux condenser. A total of 50 ㎖ of ethanol was mixed with 1 g of sample powder and used to fill an extraction vessel.
The extraction was performed under different conditions with the following: An ethanol concentration of 0 - 100%, an MAE power of 60 - 300 W, and an extraction time of 4 - 20 min. The extract was filtered through No. 1 filter paper (Whatman Co., Maidstone, England) under a vacuum and then volumed up with the solvent to 100 ㎖ in a 100 ㎖ mass flask.
3. Determination of total phenolic content (TPC)
The total phenolic content was measured by the Folin- Denis method described by Singleton et al. (1999) with
some modifications. A. pilosa extract was diluted five times with distilled water. A total of 100 ㎕ of diluted sample was mixed with 50 ㎕ of Folin-Ciocalteu's reagent and 300 ㎕ of 2% Na
2CO
3. After reacting for 15 min at room temperature, 1 ㎖ of distilled water was added and the absorbance was measured by spectrophotometry (UV- 2550, Shimadzu Corp., Kyoto, Japan) at 725 ㎚. Gallic acid (Sigma-Aldrich, St. Louis, MO, USA) was used as standard (0.075 - 0.2 ㎍/㎖). The results were presented as
㎎ of gallic acid equivalent per g (㎎
•GAE/g).
4. Determination of total flavonoid content (TFC) The total flavonoid content was analyzed by using aluminum colorimetric assay (Teng et al., 2009).
Approximately 70 ㎕ of extract, which was diluted two times with distilled water, was mixed with 430 ㎕ of distilled water, 50 ㎕ of 5% NaNO
2and 50 ㎕ of 10%
Al(NO
3)
39H
2O. After keeping it at room temperature for 6 min, 500 ㎕ of 1 N NaOH was added and the absorbance was measured by spectrophotometry at 510 ㎚. Quantitative analysis was practiced on the basis of the standard curve of rutin (Sigma-Aldrich Co., St. Louis, MO, USA). The results were expressed as ㎎ of rutin equivalent per g ( ㎎
•RE/g).
5. Determination of DPPH radical scavenging activity (DPPH)
DPPH radical scavenging activity was assayed by using a modified version of the DPPH method by Blois (1958).
To make DPPH solution, 0.0039 g of 2, 2-diphenyl-1- picrylhydrazyl (Sigma-Aldrich Co., St. Louis, MO, USA) was mixed with 100 ㎖ of ethanol and then It was equilibrium for 2 hr using magnetic stirrer (PC-420D, Corning Co., Corning, NY, USA). A. pilosa extract was diluted 60 times with ethanol. Approximately 100 ㎕ of diluted sample was mixed with 900 ㎕ of DPPH solution.
The sample was placed in the dark at room temperature for 30 min. The absorbance was measured by spectrophotometry at 517 ㎚. DPPH was expressed by the following equation.
DPPH (%) = [1 - sample absorbance / blank absorbance) × 100]
6. Experimental design
Response surface methodology (RSM) was applied to
optimize the extraction condition using a statistical analysis system (SAS, Version 9.2, SAS Institute Inc., Cary, NC, USA) program. The independent variables were ethanol concentration (X
1), microwave power (X
2), and extraction time (X
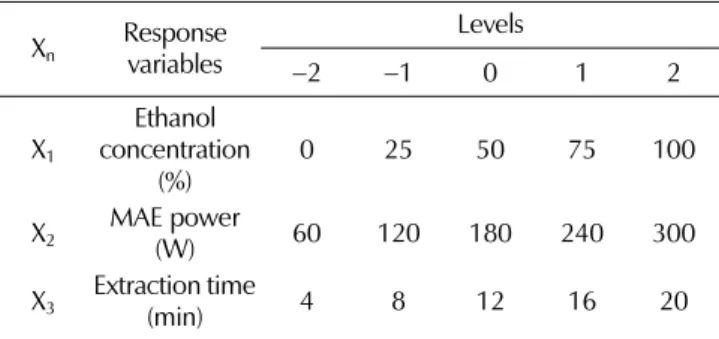
3). Through single-factor experiments and central composite design (CCD), ethanol concentration (0, 25, 50, 75 and 100%), microwave power (60, 120, 180, 240 and 300 W), and extraction time (4, 8, 12, 16 and 20 min) were selected as suitable conditions for extraction and were encoded under five levels ( −2, −1, 0, +1 and +2) (Table 1). The CCD matrices was composed of 2 central points, 8 factorial points, and 6 axis points at a distance of ± 2 from the center, resulting in 16 set of experimental runs. The dependent variables were total polyphenol content (Y
1), total flavonoid content (Y
2) and DPPH radical scavenging activity (Y
3).
7. Statistical analysis
The analysis was performed in triplicates. The average values were used to regression analysis by using SAS software (SAS, Version 9.2, SAS Institute Inc., Cary, NC, USA). The following equation was regression model about independent and dependent variables:
Y = β
0+ β
1X
1+ β
2X
2+ β
3X
3+ β
12X
1X
2+ β
13X
1X
3+ β
23X
2X
3+ β
11X
12+ β
22X
22+ β
33X
32Y is predicted responses for TPC, TFC and DPPH.
X
iare the independent variables and β
iare regression coefficients.
For Duncan’s Multiple Range Test, IBM SPSS statistics 22 (SPSS Inc., Chicago, IL, USA) was used. It was performed at 5% probability level.
dimension surface and contour plots. The contour maps were overlapped to indicate optimal conditions.
RESULTS AND DISCUSSION
1. Solvent selection for microwave extraction
Solvent is one of crucial parameters during microwave extraction process. Because solvent have a influence on affinity of target ingredients and its absorption of microwave (Zhang et al., 2011).
To select proper solvent for extraction, four different solvents including distilled water, ethanol, acetone and ethyl acetate were used.
Table 1. The central composite design for optimization of microwave extraction condition of Agrimonia pilosa Ledeb.
Xn Response variables
Levels
−2 −1 0 1 2
X1
Ethanol concentration
(%)
0 25 50 75 100
X2 MAE power
(W) 60 120 180 240 300
X3 Extraction time
(min) 4 8 12 16 20
Fig. 1. The effect of different solvents on total polyphenol content (A), total flavonoid content (B) and DPPH radical scavenging activity (C) of Agrimonia pilosa Ledeb under 5 min extraction time and 180 W microwave power conditions. Mean values ± SD from triplicate separated experiments are shown.
Mean with the difference letter (a - d) are by
Among them, ethanol and distilled water extracts show higher contents of functional compounds and DPPH radical scavenging activity than acetone and ethyl acetate.
Especially, 50% ethanol presented significantly higher values than others (Fig. 1). It was predicted that aqueous ethanol will be suitable solvent for A. pilosa extraction.
For that reason, ethanol was selected as extraction solvent.
2. Effects of extraction condition on total polyphenol content (TPC)
The experimental data for TPC are expressed in Table 2.
Fitted model for TPC is listed as below:
Y
TPC= − 0.791875 + 0.261575X
1+ 0.182323X
2+ 1.604531X
3- 0.006580X
12+ 0.000476X
2X
1- 0.000186X
22+ 0.013863X
3X
1- 0.008578X
3X
2- 0.005391X
32The coefficient of determination for the polynomial equation was 0.9529 and significance was less than 0.005%.
The predicted maximum TPC was 37.19 ㎎
•GAE/g under
Table 2. Central composite design and experimental data of Agrimonia pilosa Ledeb during microwave extraction.Test runs
Ethanol concentration (%)
MAE power (W)
Extraction time (min)
(㎎TPC •GAE/g)
(㎎TFC•RE/g)
DPPH (%)
1 25 (−1) 120 (−1) 8 (−1) 29.12± 0.87c
087.92
± 2.35e 69.32± 1.68gh*2 25 (−1) 120 (−1) 16 (1)
033.2
± 1.03ef099.74
± 4.68ghi 66.07± 0.50fg3 25 (−1) 240 (1) 8 (−1)
035.6
± 1.76gh 102.35± 1.54ghi 69.43± 1.46gh4 25 (−1) 240 (1) 16 (1) 34.07± 0.87fg
092.86
± 2.54f 64.16± 3.14ef5 75 (1) 120 (−1) 8 (−1) 19.01± 1.30b
053.24
± 2.62b 38.53± 2.52b6 75 (1) 120 (−1) 16 (1) 31.26± 1.34d 104.58± 3.43i 70.14± 1.46gh
7 75 (1) 240 (1) 8 (−1) 30.97± 0.58d 100.9± 3.63ghi 62.03± 1.62e
8 75 (1) 240 (1) 16 (1) 32.36± 0.35de
097.51
± 3.21fgh 63.98± 2.98ef9 50 (0) 180 (0) 12 (0) 34.24± 0.30fgh 102.64± 2.53hi 68.24± 0.34g
10 50 (0) 180 (0) 12 (0) 35.37± 1.17gh 101.09± 1.43ghi 66.48± 2.49fg
11 0 (−2) 180 (0) 12 (0)
028.2
± 0.36c059.44
± 0.34c 52.06± 1.76c12 100 (2) 180 (0) 12 (0)
08.51
± 0.13a029.31
± 1.10a 18.83± 0.89a13 50 (0) 60 (−2) 12 (0) 28.52± 0.51c
085.11
± 2.47de 56.65± 1.40d14 50 (0) 300 (2) 12 (0) 35.74± 0.48h 102.06± 2.38ghi 67.27± 4.20fg
15 50 (0) 180 (0) 4 (−2) 28.52± 0.48c
081.53
± 1.75d 55.27± 1.65cd16 50 (0) 180 (0) 20 (2)
040.4
± 0.52i096.93
± 3.86fg 74.74± 2.63hMean values from triplicate separated experiments are shown. *Means within a column followed by the same letters are not significantly different based on DMRT (p < 0.05).
Table 3. Predicted level of optimum conditions for extraction of Agrimonia pilosa Ledeb by the ridge analysis.
Responses
Ethanol concentration
(%)
MAE power
(W)
Extraction time (min)
Estimated
responsesMorphology Total
polyphenol content (㎎•GAE/g)
42.48 239.04 13.25
037.19
Saddle point Totalflavonoid content (㎎•RE/g)
48.09 192.73 13.65 108.72 Saddle point DPPH
radical scavenging activity (%)
42.24 216.17 11.92
071.74
Saddle pointTable 4. R value for regression model of conditions in extraction of Agrimonia pilosa Ledeb.
Responses
F-ratio Total
polyphenol content
Total flavonoid content
DPPH radical scavenging
activity Ethanol
concentration
(%) 18.82***
0 9.52** 0 9.68**
MAE power
(W) 4.57** 3.07 1.44
Extraction time
(min) 5.63** 3.54* 3.07
Mean values from triplicate separated experiments are shown. Means within a column followed by the same letters are not significantly different based on DMRT (*p < 0.1, **p < 0.05, ***p < 0.001).
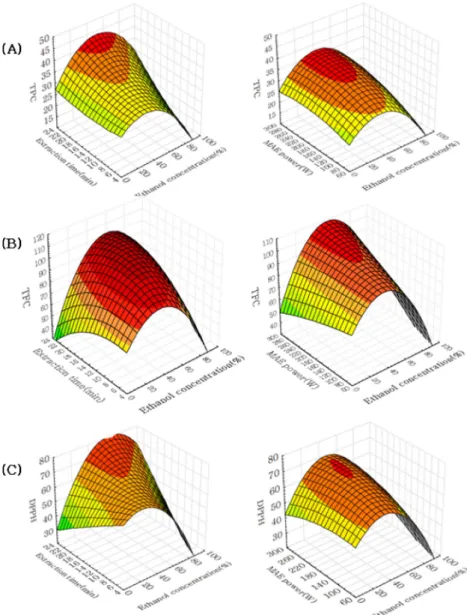
an ethanol concentration of 42.48%, microwave power of 239.04 W, and extraction time of 13.25 min (Table 3). The significant effect was presented with ethanol concentration, microwave power and extraction time (Table 4). As microwave power increased, extraction of TPC was enhanced between 25 and 60% of ethanol concentration (Fig. 2). Especially, TPC showed high amount in the range of 25 - 60% of ethanol concentration. Previous study mentioned that it was important to balance the dielectric constant between solvent and solute in microwave extraction (Pare et al., 1994).
pure ethanol and water. This result indicated that aqueous ethanol reacts more effectively with microwave energy to produce a high TPC.
3. Effects of extraction condition on total flavonoid content (TFC)
The experimental result for TFC is shown in Table 2.
The coefficient of determination for the polynomial equation was 0.9070, and significance was confirmed within a significance level of 0.05%. Fitted model for TFC is shown below:
Fig. 2. Surface plot for total polyphenol content (A), total flavonoid content (B) and DPPH radical scavenging activity (C) of ethanol concentration, microwave power and extraction time by microwave extraction.
Y
TFC= − 43.894375 + 0.902450X
1+ 0.630042X
2+
10.282500X
3- 0.022996X
12+ 0.002753X
2X
1- 0.000575X
22+ 0.057025X
3X
1- 0.039604X
3X
2- 0.197422X
32The stationary point was the saddle point in RSM, and the predicted value of TFC was 108.72 ㎎
•RE/g under an ethanol concentration of 48.09%, microwave power of 192.73 W, and extraction time of 13.65 min (Table 3).
Table 4 shows that ethanol concentration has a strong influence on the extraction of TFC. It satisfied a less than 0.05 significance level. The extraction time also show significant level within 0.1%, while it was confirmed that microwave power had insignificant effects. Fig. 2 shows that aqueous ethanol obtained higher flavonoid content than pure ethanol. A similar result was also indicated by Chen et al. (2008) in the extraction of Herba Epimedii. They observed that some water improves the extraction efficiency of flavonoids from Herba Epimedii.
In this study, extraction of TFC was enhanced in the range of ethanol concentration from 45 to 55% with increase of extraction time. But TFC was decreased more than 20 min of extraction time. It could be presumed that, when the extraction time extend, the disintegration of bioactive substance may occur in extraction process.
Therethrough it lead to a decline of extraction yield (Wang et al., 2008).
4. Effects of extraction condition on DPPH radical scavenging activity (DPPH)
Table 2 shows the experimental data of DPPH under various extraction conditions. The polynomial equation for DPPH shows the coefficient of determination is 0.9003 with a significance of less than 0.05%. Fitted model for DPPH is presented below:
Y
DPPH= 24.718625 + 0.106523X
1+ 0.291626X
2+ 2.223266X
3- 0.012765X
12+ 0.001594X
2X
1- 0.000375X
22+0.052596X
3X
1- 0.016505X
3X
2- 0.036773X
32The stationary point was the saddle point in RSM. Under the MAE conditions of 42.24% ethanol concentration, 216.17 W of microwave power, and 11.92 min of extraction time, the predicted value of DPPH was 71.74% (Table 3).
Fig. 2 show that DPPH was risen within the range of ethanol concentration from 35 to 45% with increase of extraction time, but DPPH was decreased when the microwave power was over 280 W. Among the extract conditions, ethanol concentration had a decisive effect, whereas microwave power and extraction time had low- impact on the extraction of DPPH (Table 4). A similar result was formerly identified in the microwave-assisted extraction of Ligularia fischeri. Microwave power and extraction time had no significance for the variance of DPPH (Kwon et al., 2002).
5. Prediction of optimal extraction conditions and verification experiments
The optimal ranges for the extraction conditions of A.
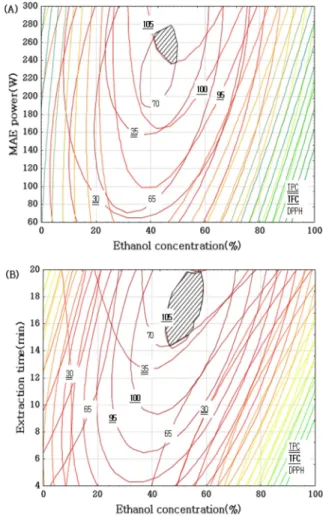
Fig. 3. Superimposing contour map of optimized conditions for the total polyphenol, total flavonoid and DPPH radical scavenging activity of ethanol concentration and microwave power and extraction time by microwave extraction.
pilosa were predicted by superimposing a contour map.
When ethanol concentration and microwave power were selected for superimposing, optimum conditions are 42 - 48%, 240 - 280 W. And contour map of ethanol concentration and extraction time presented optimal conditions 40 - 60%, 14 - 20 min (Fig. 3), respectively. In accordance with the superimposing graph, the optimum conditions of ethanol concentration, microwave power, and extraction time were determined as 42 - 48%, 240 - 280 W, and 14 - 20 min, respectively. A verification experiment was performed in the conditions of an ethanol concentration of 45%, microwave power of 270 W, and extraction time of 14 min. Predicted values of TPC (36.82 ㎎
•GAE/g), TFC (102.83 ㎎
•RE/g), and DPPH (69.09%) were obtained through the polynomial equation.
The experimental values for TPC, TFC, and DPPH were 35.15 ± 1.58 ㎎
•GAE/g, 103.61 ± 4.36 ㎎
•RE/g, and 68.74 ± 1.40%, respectively (Table 5).
REFERENCES
Bae JH and Sohn MA. (2005). Effect of Agrimonia pilosa Ledeb extract on the growth of food-borne pathogens. The Korean Journal of Nutrition. 38:112-116.
Blois MS. (1958). Antioxidant determination by the use of a stable free radical. Nature. 181:1199-1200.
Chen L, Jin H, Ding L, Zhang H, Li J, Qu C and Zhang H.
(2008). Dynamic microwave-assisted extraction of flavonoids from Herba Epimedii. Separation and Purification Technology.
59:50-57.
Gao Y, Zhou G, Chen J and Qin H. (2015). Determination of six flavonoids in Agrimonia pilosa Ledeb by HPLC. Food Science.
36:93-96.
Giese J. (1992). Advances in microwave food processing. Food Technology. 46:118-123.
Kim DH, An BJ and Lee JY. (2011a). Whitening activities of the Agrimonia pilosa L. extracts. Journal of Applied Biological Chemistry. 54:284-289.
Kim TH, Kim JM, Baek JM, Kim TW, Kim DJ, Park JH and Choe M. (2011b). Antioxidant and whitening effects of Agrimonia pilosa Ledeb water extract. Korean Journal of Medicinal Crop Science. 19:177-184.
Kim YM. (2010). The inhibitory effect of Agrimonia pilosa Ledeb extract on allergic reaction. Korean Journal of Medicinal Crop Science. 18:398-404.
Kwon JH, Kim KG and Lee GD. (2000). Optimization of microwave-assisted extraction under atmospheric pressure condition for soluble ginseng components. Korean Journal of Food Science and Technology. 32:117-124.
Kwon MC, Kim CH, Kim HS, Lee SH, Chio GP, Park UY, You SG and Lee HY. (2007). Optimal extract condition for the enhancement of anticancer activities of Artemisia princeps Pampanini. Korean Journal of Medicinal Crop Science.
15:233-240.
Kwon YJ, Kim KH and Kim HK. (2002). Changes of total polyphenol content and antioxidant activity of Ligularia fischeri extracts with different microwave-assisted extraction conditions.
Korean Journal of Food Preservation. 9:332-337.
Lee HJ, Do JR, Kwon JH and Kim HK. (2012). Optimization of Corni fructus extracts by response surface methodology. Journal of the Korean Society of Food Science and Nutrition. 41:390-395.
Lee WY, Choi SY, Lee BS, Park JS, Kim MJ and Oh SL.
(2006). Optimization of extraction conditions from Omija (Schizandra chinensis Baillon) by response surface methodology.
Korean Journal of Food Preservation. 13:252-258.
Min KJ, Song JW and Cha CG. (2008). The antioxidative and antitumor activity of extracts of Agrimonia pilosa. Journal of Food Hygiene and Safety. 23:149-156.
Pare JRJ, Belanger JMR and Stafford SS. (1994). Microwave- assisted process(MAPTM): A new tool for the analytical laboratory. Trends in Analytical Chemistry. 13:176-184.
Pei YH, Li X and Zhu TR. (1990). Studies on the structure of a new ellagic acid glycoside from the root sprouts of Agrimonia pilosa Ledeb. Acta Pharmaceutica Sinica. 25:798-800.
Schiffmann RF. (1992). Microwave processing in the U.S. food industry: Dielectric and ohmic sterilization. Food Technology.
46:50-56.
Singleton VL, Orthofer R and Lamuela-Raventos RM. (1999).
Analysis of total phenols and other oxidation substrates and antioxidants by means of Folin-Ciocalteu reagent. Methods in Enzymology. 299:152-178.
Teng H, Ghafoor K and Choi YH. (2009). Optimization of microwave-assisted extraction of active components from Chinese quince using response surface methodology. Journal of Applied Biological Chemistry. 52:694-701.
Théodore K and Panda T. (1995). Application of response surface Table 5. Predicted and experimental values of the response
variables at a given condition within the range of optimum extraction conditions.
Process variables
Ethanol concentration
(%)
Microwave power
(W)
Extraction time (min)
Given condition 45 270 14
Responses Predicted value Experimental value Total polyphenol
content (㎎•GAE/g)
36.8 35.15± 1.58
Total flavonoid content (㎎•RE/g)
103.27 103.61± 4.36
Anti-oxidant
activity (%) 69.09 68.74± 1.40
Mean values± SD from triplicate separated experiments are shown.
methodology to evaluate the influence of temperature and initial pH on the production of β-1,3-glucanase and carboxymethylcellulase from Trichoderma harzianum. Enzyme and Microbial Technology.
17:1043-1049.
Wang L, Li D, Bao C, You J, Wang Z, Shi Y and Zhang H.
(2008). Ultrasonic extraction and separation of anthraquinones from Rheum palmatum L. Ultrasonics Sonochemistry. 15:738-746.
Yoon JY, Lee SY, Jun HJ and Lee JY. (2012). Anti-aging effects of solvent fraction from Agrimonia pilosa L. extracts. Journal of Applied Biological Chemistry. 55:35-39.
Zhang HF, Yang XH and Wang Y. (2011). Microwave assisted extraction of secondary metabolites from plants: Current status and future directions. Trends in Food Science and Technology.
22:672-688.