- 84 -
반응표면 분석에 의한 사과 주스의 Patulin 감소 조건 모니터링
백창호․박난영1․정용진†
계명대학교 식품가공학과,
1(주)계명푸덱스
Monitoring Decreases in the Patulin Level of Apple Juice using Response Surface Methodology
Chang-Ho Baek, Nan-Young Park1 and Yong-Jin Jeong†
Department of Food Science and Technology, Keimyung University, Daegu 704-701, Korea
1Keimyung Foodex Co., Ltd, Daegu 704-701, Korea
Abstract
We investigated methods to minimize patulin content during processing of apple juice in Korea. Ascorbic acid concentration (100, 200, 300, and 400 ppm) and activated carbon concentration (50, 100, 150, and 200 ppm) were the parameters assessed by response surface methodology. Residual patulin was lowest in the presence of 237.77 ppm ascorbic acid and 106.58 ppm activated carbon, and increased as these levels increased. Sugar content was affected more byascorbic acid concentration than by activated carbon level, and the total phenol content was revealed to be the saddle point. In addition, the expected total flavonoid content was maximized with increased levels of ascorbic acid and activated carbon. The data showed that 246 –274 ppm (v/v) ascorbic acid and 93–122 ppm (v/v) activated carbon were optimal for juice extraction, and the R
2quality factor for juice processing was significant and within the range of 1 –10% for all tested parameters.
Key words :apple juice, patulin, activated carbon, ascorbic acid, RSM
서 론
1)
사과는 장미과 Malus 속에 속하는 다년생 식물로서 약 300년 전에 중국으로부터 전래되었으며(1), ascorbic acid와 무기염류의 함량이 높은 대표적 알카리성 식품이다(2). 국 내 생산량이 연간 5,000톤으로 주로 생과일로 소비되고 있 으며 주스류, 넥타, 잼, 젤리 등 가공 원료의 소비량도 꾸준 히 증가하고 있다(3).
최근 농산물은 생산, 유통 및 가공과정 등에서 사용되는 각종 유해물질에 의한 오염문제가 제기되고 있고(4), 국내 에 대량으로 수입되는 농산물의 경우 곰팡이 독소, 농약 등의 잔류가 식품 안전성의 새로운 문제로 대두되고 있다 (5,6). 식품의 안전을 위협하는 중요한 곰팡이 독소로는 aflatoxin, ochratoxin A, patulin 등이 있으며, 이들 중 patulin
†
Corresponding author. E-mail:[email protected], Phone:82-53-580-5557, Fax:82-53-580-6477
은 1940년에 보고된 바 있다(7-9). Patulin은 열 저항성이 있고 pH 6 이하의 산에 대한 안정성이 있어서 동물의 위장 내에서 면역학적, 신경학적으로 영향을 줄 수 있다(10-13).
Patulin에 의한 오염사례로 일본에서 호주산 과즙을 사용한 사과주스에서 55 ppb(100% 과즙환산)의 patulin이 검출되 었으며, 시판주스에서도 26 ppb가 검출된 바 있다(14).
Patulin은 주로 사과, 복숭아, 포도, 메론 등에서 생성될 수
있으며(15,16), 미국에서도 수입 사과주스의 50%에서
patulin이 검출되었다(17). 국내에서도 국민수준의 향상과
함께 질 좋은 사과가 생산되어 과즙음료의 소비가 증가하는
추세를 고려할 때, 사과 주스에 함유된 patulin의 허용기준
확립이 필요한 시점이며, 이와 함께 사과주스의 생산 공정
에서 patulin 잔류량을 감소시킬 수 있는 방안 마련이 요구
되고 있다. Patulin과 관련한 국내 연구는 가공용 사과 및
시판 주스제품의 patulin 잔류량에 대한 보고(5,18-20)가 대
부분이며, patulin의 감소에 대해서는 Bissessur 등(21)이 목
탄과 화학적 보존법을 이용해 patulin 잔류량을 89% 감소하
였다고 보고하였고, 이외에도 오존처리, 고압을 이용한 방 법, 초음파 및 세척수의 활용에 대한 보고(22-24)가 있다.
그러나 이와 같은 방법을 적용한 사과주스에 활성탄을 첨가 하였을 때 색택이 나빠졌다는 보고(25)도 있으므로 상품성 에 영향을 미치지 않고 patulin 잔류량을 최소화하는 사과주 스 가공방법에 관한 연구가 필요한 실정이다.
본 연구는 국내산 사과주스의 patulin 오염실태에 관한 보고(20)에 이어 사과주스 가공 과정에서 patulin 잔류량을 감소시킬 수 있는 조건을 모니터링 하고자 하였다.
재료 및 방법
재 료
본 실험에 사용된 사과는 2006년 생산된 부사품종을 경 북 농협에서 구입하여 5℃에서 냉장보관하면서 사용하였 으며, 활성탄 (Granular powder, No. 7846)은 신기화학공업 (주)에서 구입하여 사용하였고, ascorbic acid (Aldrich Co., USA)와 patulin (Fluka Co., USA)은 특급 시약을 사용하였다.
Patulin 함량 분석
Patulin은 식품공전에 준하여 분석하였다(26). 즉, 시료 5 g에 ethyl acetate 10 mL를 넣고 혼합하여 상등액을 취한 다음, 1.5% Na
2CO
3용액 2 mL를 넣어 혼합하였다. 혼합액 은 ethyl acetate 5 mL를 넣어 상등액을 취하였고, 여기에 1 g의 Na
2SO
4을 혼합하여 다시 상등액을 취하였다. 분리한 상등액은 40℃에서 질소가스로 완전 농축시킨 다음 0.5 mL 초산용액에 용해하여 high performance liquid chromatography (In-sung, Korea)로 분석하였다. 이때 column은 Nova-pack C
18(3.9 mm × 300 mm, 4 μm)을 사용하였으며, flow rate는 0.5 mL/min, detector는 UV(276 nm)의 조건이었다.
당도, 산도 및 pH 측정
당도는 여액을 여과하여 굴절당도계(NI Atago Co., Japan)로 측정하였고, 산도는 각각의 공정에서 사과주스 및 농축액을 일정량 취해 0.1N NaOH 용액으로 적정한 다음 사과산으로 환산하였으며, pH는 상온에서 pH meter (Metrohm 691, Switzerland)로 측정하였다.
총 페놀성 물질 함량 측정
페놀성 물질의 함량은 Folin-Denis법(27)에 의해 비색정 량 하였다. 즉, 시험관에 시료 5 mL와 Folin-Denis시약 0.5 mL를 넣고 진탕한 다음 실온에서 1시간 동안 반응시킨 후 700 nm에서 흡광도를 측정하였으며, tannic acid(5∼50 μ g/mL)를 표준물질로 사용하였다.
총 플라보노이드 함량 측정
총 플라보노이드 함량은 시료 0.2 mL에 diethylene glycol
2 mL를 넣고 혼합한 후 1N NaOH용액을 0.02 mL 첨가한 다음, 37℃ 항온수조에서 1시간 동안 반응하여 분광광도계 (UV spectrophotometer 1601, Shimadzu, Kyoto, Japan)를 이 용해서 420 nm에서 흡광도를 측정하였다. 이때 표준 검량 선은 rutin을 50% methanol 용액에 용해시킨 후 동일한 방법 으로 반응하여 작성하였다.
반응표면 분석에 의한 patulin 감소조건 모니터링
본 실험에서는 반응표면분석법(response surface methodology, RSM)(28)을 이용하여 patulin 잔류량의 감소 조건을 예측하 였으며, 반응표면 회귀분석을 위하여 SAS (statistical analysis system) program (29)을 사용하였다. 실험계획은 사과주스 가공공정에서의 patulin 잔류량의 감소에서 중요 한 독립변수로 고려되는 인자 즉, ascorbic acid의 첨가량 (X
1), 활성탄 사용량(X
2)을 -2, -1, 0, 1, 2의 5단계로 부호화하 였다. 독립변수는 fractional factorial design에 따라 Table 1과 같이 10구간으로 설정하여 실험하였다. 또한 이들 독립 변수에 영향을 받는 종속변수(Y
n) 즉, 사과주스의 품질인자 는 patulin 잔류량(Y
1), 당도(Y
2), 적정산도(Y
3), pH(Y
4), 총 페놀성 물질 함량(Y
5), 총 플라보노이드 함량(Y
6)으로 설정 하였고, 파쇄한 사과의 patulin 함량은 파쇄사과 200 g에 대해 200 ppb로 고정하였다.
Patulin 잔류량의 최적 감소조건 예측 및 실증시험
Patulin 잔류 함량의 최적 감소조건은 반응변수인 patulin 잔류량, 당도, 적정산도, pH, 총 플라보노이드 및 총 페놀성 물질 함량 등의 contour map을 superimposing 했을 때 중복 되는 부분의 범위로 예측하였다. 또한 예측된 범위의 특정 값에 대하여 검증실험을 실시하고 회귀식에 의한 예측값과 비교하였다.
통계분석
본 실험은 독립적으로 3회 이상 반복 실시하여 실험 결과 를 평균±표준편차로 나타내었고, 통계분석은 statistical analysis system (SAS) 통계 프로그램을 이용하여 duncan's multiple range test에 의해 유의성을 p<0.05 수준에서 검정 하였다.
결과 및 고찰
Patulin 잔류량의 변화
중심합성계획에 의해 10구간의 patulin 감소조건으로 사
과주스를 제조하였고, 이때 얻어진 사과주스의 patulin 잔류
량, 당도, 적정산도, pH, 총 페놀성 물질 함량, 총 플라보노이
드 함량의 변화를 Table 1에 나타내었다. 또한 각각의 결과
를 이용하여 반응표면 회귀분석을 실시하고 Table 2와 같이
각 종속(반응)변수에 대한 회귀식을 얻었다.
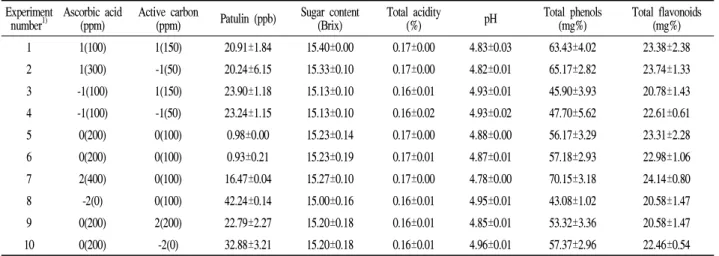
Table 1. Experimental data on patulin concentration, sugar content, total acidity, pH, total phenols and total flavonoids in apple juice processing under different conditions based on composition design for response surface analysis in apple juice processing under different conditions based on composition design for response surface analysis
Experiment
number1) Ascorbic acid
(ppm) Active carbon
(ppm) Patulin (ppb) Sugar content
(Brix) Total acidity
(%) pH Total phenols
(mg%) Total flavonoids (mg%)
1 1(100) 1(150) 20.91±1.84 15.40±0.00 0.17±0.00 4.83±0.03 63.43±4.02 23.38±2.38
2 1(300) -1(50) 20.24±6.15 15.33±0.10 0.17±0.00 4.82±0.01 65.17±2.82 23.74±1.33
3 -1(100) 1(150) 23.90±1.18 15.13±0.10 0.16±0.01 4.93±0.01 45.90±3.93 20.78±1.43 4 -1(100) -1(50) 23.24±1.15 15.13±0.10 0.16±0.02 4.93±0.02 47.70±5.62 22.61±0.61
5 0(200) 0(100) 0.98±0.00 15.23±0.14 0.17±0.00 4.88±0.00 56.17±3.29 23.31±2.28
6 0(200) 0(100) 0.93±0.21 15.23±0.19 0.17±0.01 4.87±0.01 57.18±2.93 22.98±1.06
7 2(400) 0(100) 16.47±0.04 15.27±0.10 0.17±0.00 4.78±0.00 70.15±3.18 24.14±0.80
8 -2(0) 0(100) 42.24±0.14 15.00±0.16 0.16±0.01 4.95±0.01 43.08±1.02 20.58±1.47
9 0(200) 2(200) 22.79±2.27 15.20±0.18 0.16±0.01 4.85±0.01 53.32±3.36 20.58±1.47
10 0(200) -2(0) 32.88±3.21 15.20±0.18 0.16±0.01 4.96±0.01 57.37±2.96 22.46±0.54
1)
The number of experimental conditions by fractional factorial design.
2)
Values are mean ±S.D. (n=3).
반응표면분석에 의하면 사과주스의 patulin 잔류량은 ascorbic acid 함량이 237.77 ppm, 활성탄 함량이 106.58 ppm 일 때 최소점을 나타내었으며(Table 3), ascorbic acid보 다는 활성탄 함량에 조금 더 영향을 받는 경향이 있었다.
하지만 ascorbic acid와 활성탄의 함량이 증가해서 최소점을 지나게 되는 경우에는 patulin 잔류량이 다시 증가하는 경향 을 나타내었다(Fig. 1). 이와 같은 결과는 ascorbic acid 200 ppm과 활성탄 100 ppm의 첨가조건으로 사과주스를 제조하 였을 때 patulin 잔류량이 적었다는 Park 등(20) 보고와 유사 한 경향이었다. 사과주스 의 patulin 잔류량에 대한 회귀식 의 R
2는 의 patulin 잔류량에 대한 회귀식의 R2는 0.8541이 고 10%수준에서 유의성이 인정되었다.
Table 2. Polynomial equations calculated by RSM program for patulin, sugar content, total acidity, pH, total phenols and total flavonoids of apple juice processing
Dependent
variable Polynomial model equations1) Patulin
(Y1) Y1= 68.9750-0.311142X1-0.527417X2 +0.000658X12
+0.0000005X2X1+0.00248X22
Sugar content
(Y2) Y2= 14.9950 + 0.0025891X1+ 0.000295X2
-0.000002723X12+0.0000035X2X1-0.000004393X22
Total acidity
(Y3) Y3= 0.139667+0.000111X1+0.000252X2-0.000000113X12
-0.0000025X2X1-0.0000001050X22
(YpH4) Y4= 5.031667-0.000415X1-0.001064X2-0.000000232X12
+0.0000005X2X1+0.000003071X22
Total phenols
(Y5) Y5= 52.428333+0.006886X1-0.095462X2+0.000021911X12
+0.000503X2X1-0.000039357X22
Total flavonoids
(Y6) Y6= 21.428333+0.009589X1+0.007845X2-0.000020161X12
+0.0000755X2X1-0.000165X22 1)
X
1: Ascorbic acid (ppm).
X
2: Active carbon (ppm).
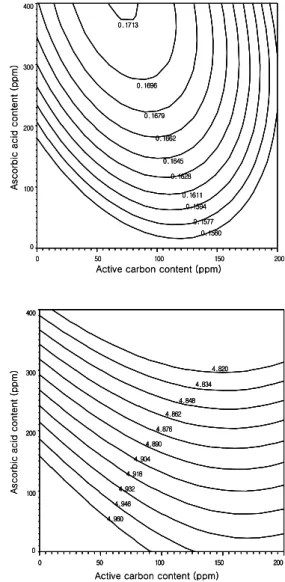
당도, 산도 및 pH의 변화
반응표면분석에 의하면 사과주스의 당도는 활성탄 사용 량보다 ascorbic acid 첨가량에 더 큰 영향을 받는 것으로 나타났으며(Fig. 1), R
2는 0.8846으로 10% 수준에서 유의성 이 인정되었다(Table 3). 산도 및 pH의 회귀식의 R
2는 0.8915와 0.9182이며, 5% 수준에서 유의성이 인정되었다.
당도와 산도의 예측된 정상점은 최대점이었고, pH는 안장 점으로 나타났다. 당도와 산도는 조건에 따라 큰 차이를 보이지 않았으나, pH는 ascorbic acid 함량에 영향을 받는 것으로 나타났다(Fig. 1, 2). Mccallum 등(30)에 의하면 pH가 높을수록 불안정하다는 결과는 본 실험과 유사한 경향을 나타내었다.
총 페놀성 물질 및 총 플라보노이드 함량
반응표면에 의한 사과주스의 총 페놀성 물질 및 총 플라 보노이드 함량에 대한 회귀식 R
2는 각각 0.9255 및 0.9942였 으며, 총 플라보노이드 함량은 1%수준에서 유의성이 인정 되었으며, 총 페놀성 물질 함량은 5%수준에서 유의성이 인정되었다(Table 3). 총 플라보노이드 함량의 예측된 정상 점은 최대점으로 나타나 ascorbic acid와 활성탄 함량이 증 가할수록 높은 함량을 나타내었으며, 총 페놀성 물질 함량 의 정상점은 안장점으로 나타났다. 또한 총 플라보노이드 함량(Fig. 3)은 ascorbic acid 첨가량이 많을수록 활성탄 첨가 량이 적을수록 높게 나타났고, 총 페놀성 물질 함량은 활성 탄 함량보다 ascorbic acid 사용량에 영향을 받는 것으로 나타났다.
최적 사과주스 제조조건의 예측 및 실증
Patulin 잔류량을 최소화 시킨 사과주스의 제조조건을
설정하기 위하여 조건별 patulin 잔류량, 당도, 산도, pH, 총 페놀성 물질 및 총 플라보노이드 함량에 대한 contour
5.06
9.19
13.32 17.45 21.59 25.72 29.85 33.98 38.11 42.24 0
100 200 300 400
0 50 100 150 200
Ascorbic acid content (ppm)
Active carbon content (ppm)
5.06
9.19
13.32 17.45 21.59 25.72 29.85 33.98 38.11 42.24 0
100 200 300 400
0 50 100 150 200
5.06
9.19
13.32 17.45 21.59 25.72 29.85 33.98 38.11 42.24
5.06
9.19
13.32 17.45 21.59 25.72 29.85 33.98 38.11 42.24 0
100 200 300 400
0 100 200 300 400
0 50 100 150 200
0 50 100 150 200
Ascorbic acid content (ppm)
Active carbon content (ppm)
15.00 15.04 15.08 15.12 15.16 15.20 15.24 15.28 15.32
0 100 200 300 400
0 50 100 150 200
Ascorbic acid content (ppm)
Active carbon content (ppm)
15.00 15.04 15.08 15.12 15.16 15.20 15.24 15.28 15.32
0 100 200 300 400
0 50 100 150 200
15.00 15.04 15.08 15.12 15.16 15.20 15.24 15.28 15.32
15.00 15.04 15.08 15.12 15.16 15.20 15.24 15.28 15.32
0 100 200 300 400
0 100 200 300 400
0 50 100 150 200
0 50 100 150 200
Ascorbic acid content (ppm)
Active carbon content (ppm)
Ascorbic acid content (ppm)
Active carbon content (ppm)
Fig. 1. Contour map for the effects on patulin (top) and sugar (bottom) of ascorbic acid content and active carbon content on the apple juice processing.
map을 superimposing하여 최적 제조조건 범위를 예측하였 다(Fig. 3). 제조조건에 따른 대부분의 성분 변화는 ascorbic acid 첨가량에 영향을 받았으며, patulin 잔류량은 ascorbic acid 함량과 활성탄 함량에 모두 영향을 받는 것으로 나타났 다. 반응변수들의 patulin 잔류량과 일반성분에 대해 반응표 면을 분석한 결과, Fig. 4와 같이 patulin 잔류량, 당도, 산도, pH, 총 페놀성 물질 함량 및 총 플라보노이드 함량이 일치하 는 범위는 ascorbic acid 첨가량이 246~ 274 ppm, 활성탄 첨가량은 93~122 ppm 으로 나타났다. 또한 예측된 최적조 건 범위 내에서 임의의 조건 즉, 시료에 대한 ascorbic acid
첨가량 260 ppm, 활성탄 함량 108 ppm에서 예측해본 결과, patulin 잔류량 4.54 ppb, 당도 15.72 °Brix, 산도 0.12%, pH
0.1560 0.1577 0.1594 0.1611 0.1628 0.1645 0.1662 0.1679 0.1696 0.1713
0 100 200 300 400
0 50 100 150 200
Ascorbic acid content (ppm)
Active carbon content (ppm)
0.1560 0.1577 0.1594 0.1611 0.1628 0.1645 0.1662 0.1679 0.1696 0.1713
0 100 200 300 400
0 50 100 150 200
0.1560 0.1577 0.1594 0.1611 0.1628 0.1645 0.1662 0.1679 0.1696 0.1713
0.1560 0.1577 0.1594 0.1611 0.1628 0.1645 0.1662 0.1679 0.1696 0.1713
0 100 200 300 400
0 50 100 150 200
Ascorbic acid content (ppm)
Active carbon content (ppm)
Ascorbic acid content (ppm)
Active carbon content (ppm)
4.820 4.834
4.848 4.862 4.876 4.890 4.904 4.918 4.932 4.946 4.960
0 100 200 300 400
0 50 100 150 200
Ascorbic acid content (ppm)
Active carbon content (ppm)
4.820 4.834
4.848 4.862 4.876 4.890 4.904 4.918 4.932 4.946 4.960
0 100 200 300 400
0 50 100 150 200
4.820 4.834
4.848 4.862 4.876 4.890 4.904 4.918 4.932 4.946 4.960
4.820 4.834
4.848 4.862 4.876 4.890 4.904 4.918 4.932 4.946 4.960
0 100 200 300 400
0 100 200 300 400
0 50 100 150 200
0 50 100 150 200
Ascorbic acid content (ppm)
Active carbon content (ppm)
Ascorbic acid content (ppm)
Active carbon content (ppm)
Fig. 2. Contour map for the effects on total acidity (top) and pH (bottom) of ascorbic acid content and active carbon content on the apple juice processing.
4.84, 총 페놀성 물질 함량 57.83 mg% 및 총 플라보노이드
함량 23.60 mg%로 예측되었다(Table 3). 이는 Cho 등(4)이
보고한 시판되는 사과주스의 patulin 함량보다 조금 낮게
나타났으나 대체로 유사한 경향이었다. 사과주스의 품질에
관련된 성분들의 예측 값과 동일조건에서 실제로 실험하여
얻은 실험값(Table 3)을 비교한 결과 patulin 잔류량과 총
페놀성 물질 함량은 예측 값보다 좋은 결과를 나타내었으
며, 그 외 품질인자들은 약간의 차이가 있으나 이는 원료
사과 시료 개체간의 차이에서 비롯된 것으로 생각된다.
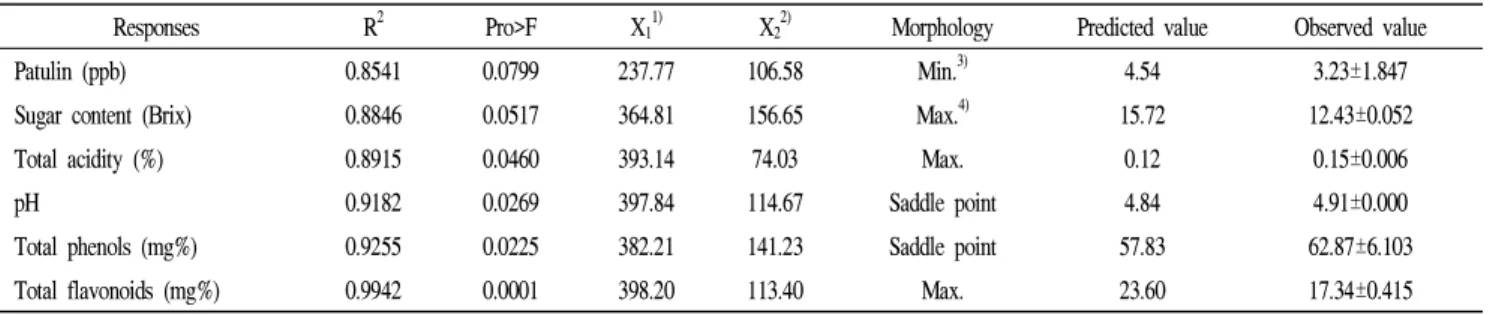
Table 3. Predicted levels of apple juice processing condition for the maximum responses by the ridge analysis and comparison predicted value and observed value
Responses R2 Pro>F X11)
X22)
Morphology Predicted value Observed value
Patulin (ppb) 0.8541 0.0799 237.77 106.58 Min.3) 4.54 3.23±1.847
Sugar content (Brix) 0.8846 0.0517 364.81 156.65 Max.4) 15.72 12.43±0.052
Total acidity (%) 0.8915 0.0460 393.14 74.03 Max. 0.12 0.15±0.006
pH 0.9182 0.0269 397.84 114.67 Saddle point 4.84 4.91±0.000
Total phenols (mg%) 0.9255 0.0225 382.21 141.23 Saddle point 57.83 62.87±6.103
Total flavonoids (mg%) 0.9942 0.0001 398.20 113.40 Max. 23.60 17.34±0.415
1)
X
1: Ascorbic acid (ppm).
2)
X
2: Active carbon (ppm).
3)
Min. : Minimum.
4)
Max. : Maximum.
43.08 45.79 48.49 51.20 53.91 56.62 59.32 62.03 64.74 67.44 70.15
0 100 200 300 400
0 50 100 150 200
Ascorbic acid content (ppm)
Active carbon content (ppm)
43.08 45.79 48.49 51.20 53.91 56.62 59.32 62.03 64.74 67.44 70.15
0 100 200 300 400
0 50 100 150 200
43.08 45.79 48.49 51.20 53.91 56.62 59.32 62.03 64.74 67.44 70.15
43.08 45.79 48.49 51.20 53.91 56.62 59.32 62.03 64.74 67.44 70.15
0 100 200 300 400
0 50 100 150 200
Ascorbic acid content (ppm)
Active carbon content (ppm)
Ascorbic acid content (ppm)
Active carbon content (ppm)
Ascorbic acid content (ppm)
Active carbon content (ppm)
20.580 20.936 21.292 21.648 22.004 22.360 22.716 23.072 23.428 23.784
24.140
0 100 200 300 400
0 50 100 150 200
Ascorbic acid content (ppm)
Active carbon content (ppm)
Ascorbic acid content (ppm)
Active carbon content (ppm)
20.580 20.936 21.292 21.648 22.004 22.360 22.716 23.072 23.428 23.784
24.140
0 100 200 300 400
0 50 100 150 200
20.580 20.936 21.292 21.648 22.004 22.360 22.716 23.072 23.428 23.784
24.140
20.580 20.936 21.292 21.648 22.004 22.360 22.716 23.072 23.428 23.784
24.140
0 100 200 300 400
0 100 200 300 400
0 50 100 150 200
0 50 100 150 200
Fig. 3. Contour map for the effects on total phenols (top) and total flavonoids (bottom) of ascorbic acid content and active carbon content on the apple juice processing.
Ascorbic acid content (ppm)
Active carbon content (ppm) 5.06
56.62 0.1679
4.848 23.428 15.28
0 100 200 300 400
0 50 100 150 200
Patulin (ppm) Total acidity (%) Total flavonoids (mg%)
Sugar content (Brix) pH
Total phenols (mg%)
Fig. 4. Superimposed contour map of optimized conditions for patulin, sugar content, total acidity, pH, total phenols and total flavonoids for apple juice processing.
요 약
본 연구에서는 국내산 사과의 주스 가공과정에서 patulin 함량 최소 방법을 모니터링 하였다. 중심합성계획법으로 ascorbic acid 첨가량(100, 200, 300 및 400 ppm)과 활성탄 사용량(50, 100, 150 및 200 ppm)을 독립변수로 설정하고 각각의 조건에서 사과주스를 제조한 결과 patulin 잔류량은 ascorbic acid 함량 237.77 ppm, 활성탄 함량 106.58 ppm에서 최소점을 나타내었다가 점차 증가하는 경향을 나타내었다.
당도는 활성탄 사용량보다는 ascorbic acid 첨가량에 영향을
더 많이 받는 것으로 나타났으며, 총 페놀성 물질 함량의
정상점은 안장점으로 나타났다. 또한, 총 플라보노이드 함
량의 예측된 정상점은 최대점으로 나타나 ascorbic acid와
활성탄 함량이 증가할수록 높은 함량을 나타내었다. 이상
의 결과 사과주스 가공시 patulin 잔류량은 ascorbic acid
246∼274 ppm (v/v), 활성탄 93∼122 ppm (v/v)에서 최소화 되는 것으로 나타났으며 사과주스 가공 품질인자의 R
2는 모든 구간에서 1∼10% 수준에서 유의성이 인정되었다.
참고문헌