88
Aspen Chromatography 전산모사와 HPLC를 이용한 구아닌 시토신의 분리특성연구
박문배·김인호† 충남대학교 화학공학과 305-764 대전시 유성구 궁동 220 (2009년 10월 17일 접수, 2009년 12월 19일 채택)
Separation Study of Cytosine and Guanine by HPLC and Aspen Chromatography
Moon Bae Park and In Ho Kim†
Department of Chemical Engineering, Chungnam National University, 220 Gung-dong, Yuseong-gu, Daejeon 305-764, Korea (Received 17 October 2009; accepted 19 December 2009)
요 약
DNA 구조를 밝히기 위해 의학, 약학 그리고 생명과학분야 등에서 활발한연구가 이루어지고 있다. 그 중 DNA의 염 기쌍은 생명체의 정보 전달에 매우 중요한 역할을 하므로 염기쌍의 집중적인 분석이 필요하다. 그래서 DNA의 염기쌍 중 하나인 구아닌과 시토신을 선택하여 분석 실험을 하였다. 구아닌과 시토신의 분석은 Aspen chromatography 전산모 사와 HPLC(High Performance Liquid Chromatography) 실험을 통하여 이루어졌다. Aspen Chromatography(ver. 2006 Aspen Tech. U.S.A)로 시료농도, 이동상 유속 그리고 이론단수를 변화시켜 전산모사하였다. HPLC 실험은 C18 HPLC column 칼럼과 이동상 water/methanol/acetic acid 혼합액(90/10/0.1)을 이용하여 시료의 주입 농도와 이동상 속도를 변 화시켰고 구아닌과 시토신의 크로마토그램의 분리도와 이론단수를 비교하였다. 실험과 전산모사 크로마토그래피 결과 가 비교적 일치하였다.
Abstract − DNA structure studies attract many interests in pharmaceutical, biochemical and medical disciplines. Among them, base pairs play a vital role in biological information transfer. Therefore, they need to be analyzed in various ways and the pair of guaninine and cytosine is the present analytical object. Separation of guanine and cytosine was researched by Aspen chromatography simulator and HPLC(High Performance Liquid Chromatography) experiments. Aspen chroma- tography simulation resulted in various chromatograms with changes of sample concentration, eluent flow rate and num- ber of plate. The resolutions and yields of guanine and cytosine were calculated to obtain a best separation condition. C18 HPLC column and water/methanol/acetic acid mixture(90/10/0.2) were used for separation of guanine and cytosine. HPLC parameters(resolution and number of theoretical plate) were calculated under different flow rates and sample concen- trations. Aspen chromatography simulation and HPLC experimental results were compared with fair agreement.
Key words: HPLC, Guanine, Cytosine, Aspen Chromatography
1. 서 론
현대 유전공학과 분석기술의 발달로 DNA의 구조와 생체 내 기 능을 밝히기 위한 연구가 의학, 약학 그리고 생명과학 분야 등에서 활발히 진행되고 있다[1]. DNA 중 뉴클레오타이드는 중요한 구성 요소로 인간의 유전정보를 저장하고 있으며 염기, 오탄당 그리고 인 산염으로 이루어져 있다. 그 중에서 염기는 퓨린계 염기인 아데닌 과 구아닌, 피리미딘계 염기인 시토신과 티민이 있다[2].
퓨린계 염기와 피리미딘계 염기는 서로 쌍을 이루어 DNA 이중 나선 구조를 이루고 있으며 DNA의 근본적인 구조를 이루며 인간 의 세포 신진대사에 필요한 물질을 생산하고 우리 몸의 항바이러스
물질 생산에도 중요한 역할을 한다[3,4]. 이 염기쌍은 무작위로 형 성되지 않고 반드시 아데닌은 티민과, 구아닌은 시토신과 결합한다 [2]. 이런 염기쌍 구조의 변화는 DNA 돌연변이 원인이 되고 유전 형질에 영향을 미치며 더 나아가 유전적 질병 그리고 인간의 암의 원인이 되기도 한다[5].
이러한 이유로 뉴클레오타이드의 퓨린계, 피리미딘계 염기쌍의 분리연구가 필요하다. 뉴클레오타이드의 분석도구로 anion-exchange HPLC(High Performance Liquid Chromatography), reversed-phase(RP) HPLC, ion-pair reversed-phase HPLC 그리고 pH 완충용액을 사용 하는 capillary electrophoresis(CE)가 사용되어 왔다[6,7]. 앞에서 뉴 클레오타이드의 일반적 여러 분석도구의 공통점은 HPLC를 사용하 는 것이다.
분리 기술 중에서 액체크로마토그래피는 고정상과 이동상 간의
†To whom correspondence should be addressed.
E-mail: [email protected]
상호작용을 이용하여 용질을 분리하며 다른 분리방법에 비해 에너 지를 적게 사용하고 열에 민감한 약품분리에 널리 사용되고 있는 분석법이다. 그 중 HPLC를 이용한 분석은 기존의 액체크로마토그 래피 분석법보다 더 작은 고정상입자를 사용하고 높은 압력을 가하 여 고속으로 용질을 분리한다[8]. 분리메카니즘으로 이온교환, 겔투 과. 크기배제 그리고 RP-HPLC 방법이 이용된다. 그중 RP-HPLC는 극성용매를 이용하여 용리액의 극성을 변화시킴으로 다른 방법들보 다 시료의 준비가 쉽고 경제적이며 뛰어난 분리도로 수율 및 순도 가 높아서 많이 이용되고 있다[9].
HPLC를 이용한 분석방법이 크게 대두되고 있지만 실험을 통한 분리 효율의 향상에는 많은 시간과 비용이 소요된다. 이러한 단점을 보 완한 Simulation 방법은 실제로 실험을 하지 않고도 실험 조건의 변화 를 통해 분리 효율 등을 예측할 수 있으므로 실험에 드는 시간과 비용 을 절약할 수 있다. Simulation 방법에는 매트랩, Femlab, Aspen Chromatography 전산 모사 방법이 있다. 그 중 Aspen Chromatography 는 여러 조건 하에서 빠르게 전산모사를 수행할 수 있으며 실시간 으로 결과를 확인함으로써 분리물의 순도를 예측할 수 있고 최적 분리조건을 쉽고 빠르게 찾을 수 있다[10].
이 전산모사를 근거로 이 염기쌍 중 하나인 구아닌과 시토신을 선택하여 HPLC와 ASPEN chromatography 전산모사를 이용하여 분리연구를 하였다. 본 연구에서는 HPLC C18칼럼을 이용한 HPLC 실험에서 얻은 구아닌과 시토신의 분리 크로마토그램을 토대로 Aspen Chromatography 전산 모사를 수행한 후 모사결과와 실제 실 험 데이터를 비교하였다.
2. 실험 및 전산모사 2-1. Aspen 전산모사방법
구아닌과 시토신의 Aspen Chromatography(ver. 2006 Aspen tech.
U.S.A) 전산 모사를 수행하기 위해 먼저 크로마토그램 내의 충진물에 대한 압력과 이동상의 유속이 일정한 공정을 사용하였다. 시료의 주 입농도 = 0.25, 0.5, 1.0 g/L와 이동상유속 = 0.5, 1.0, 1.5, 2.0 mL/min 에 따른 크로마토그램의 변화를 전산모사하였다. 그리고 이론 단수 변화에 따른 크로마토그램의 비교를 위해 구아닌의 단수가 10,000 으로 고정될 때 시토신 단수 = 1,000, 5,000, 10,000 경우와 시토신의 단수가 10,000으로 고정될 때, 구아닌 단수 =1,000, 5,000, 10,000일 때 크로마토그램을 비교하였다. 앞의 조건에서 Aspen Chromatography
전산모사를 Table 1의 주어진 값에 따라 전산모사하였다[11].
2-2. HPLC 재료 및 장치
실험에서 사용된 구아닌(Sigma, U.S.A)과 시토신(Fluka, U.S.A)을 멤브레인 필터(0.22 μm GVPP, Millipore, U.S.A)로 여과 과정을 거 친 후 시료로서 사용하였다. 이동상으로는 물과 methanol(J.T. Baker, U.S.A), acetic acid(99.7%, JUNSEI, Japan)를 사용하였다.
HPLC 장치로는 펌프(110A, Backman, U.S.A), UV 검출장치(783A, Applied Biosystem, U.S.A), 데이터 수집 장치(540-0247W, Young Lin, Korea), ZORBAX 300SB-C18 column(4.6 mm×250 mm, Agilent, U.S.A)을 사용하였다. 그리고 이동상 탈기를 위해 Ultrasonic Cleaner (3210, Bransonic, USA) 사용하였다.
2-3. HPLC 실험
기본 이동상으로 물과 methanol를 사용하였으며, pH 조정을 위 해 acetic acid를 첨가하였다. 실험은 상온에서 수행하였으며 이동상 은 물/methanol/acetic acid의 조성비를 90/10/0.2(%v/v)로 하였다. 이 동상 유속은 0.5~1.0 mL/min으로, UV 검출장치의 파장은 270 nm 로 정하였다. 구아닌과 시토신 시료는 0.1, 0.3, 0.5 g/L의 농도로 구 아닌은 0.1 M의 HCl에 시토신은 물에 용해시켜 제조하였다. 두 시 료를 제조한 후 50/50(%v/v)로 섞었으며 100 µl의 sample loop를 이 용하여 칼럼에 주입하였다. 크로마토그램의 분리도와 이론단수를 계 산하기 위해 HPLC 실험에서 얻은 값들을 식 (1-2)에 대입하여 계 산하였다.
분리도(R)= (1)
이론 단수(N)= (2)
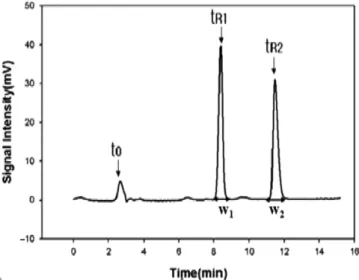
Fig. 1과 같이 tR은 성분의 체류시간을 나타내며 t0은 시료가 고 정상과 상호작용이 없고 검출기에 도달하는 시간을 표시한다. W1
과 W2는 두 피크의 기준선상에서 폭을 나타내고 시간단위로 표 시한다[8].
tR
2 RR
– 1
w1+w2 ---2 ---
16 tR w----
⎝ ⎠⎛ ⎞2
Table 1. Simulation data for cytosine and guanine in ASPEN chroma- tography batch simulation
Name Value Unit Description
Flow rate 0.5~2.0 mL/min Sample
concentration
0.25~1.0 g/L
Hb 25 cm Height of adsorbent layer Db 0.46 cm Internal diameter of adsorbent layer
Ei 0.38 Interparticle voidage
Np (cytosine) 1000~10000 Number of plates Np (guanine) 1000~10000 Number of plates IP1 (cytosine) 0.55 Isotherms parameter IP1 (guanine) 1.05 Isotherms parameter IP2 (cytosine) 0.3 Isotherms parameter
IP2 (guanine) 1.0 Isotherms parameter Fig. 1. General chromatogram and definition of retention times (tR: retention time, w: peak width and t0: dead time).
화학공학 제48권 제1호 2010년 2월
3. 결과 및 고찰
유속 0.5 mL/min 조건에서 혼합물의 주입량을 증가시켰을 경우 Aspen chromatography의 전산모사 결과는 Fig. 2와 같다. 0.25, 0.5 1.0 g/L으로 주입량의 증가에 따라 피크 크기는 증가하였지만 구아 닌과 시토신의 체류시간 차이는 관찰되지 않았다. 시료 변화량에 따 라 피크의 높이는 비례하여 증가하지 않았지만 피크아래 면적을 적 분한 결과 주입량은 일치하였다. 0.25 g/L 경우 구아닌과 시토신의 분리도에 영향을 미치는 곡선의 대칭성이 0.5와 1.0 g/L과 비교했을 때 적음을 관찰할 수 있다. 또한 피크 높이에 비해 폭이 넓어 분리 효율이 많이 떨어짐을 알 수 있다[8]. 두 농도 0.5와 1.0 g/L과 비교했 을 때 크로마토그래피의 피크 높이만 차이날 뿐 피크의 분리도 차 이는 없으므로 농도 1.0 g/L로 분석함이 0.5 g/L에 비해 경제적이고 적합하다고 사료된다.
시료농도 0.5 g/L 조건에서 이동상의 유속 0.5, 1.0, 1.5, 2.0 mL/
min 에서 시토신과 구아닌의 체류시간 변화는 Fig. 3에서 관찰할 수 있다. 이동상의 유속에 따른 체류시간의 비율을 비교한 결과 유속 과 체류시간은 반비례함을 보였다. 이동상의 유속이 줄어들수록 두 성분의 체류시간 차이가 커짐을 알 수 있었다. 이는 순수한 시토신과 구아닌 시료를 얻는데 중요하다. Table 2는 Aspen chromatography 전산모사에서 여러 이동상 유속에서 분리도를 계산한 결과이다. 식 (1)에서 분리도는 두 시료의 체류시간과 관련된다. 문헌 11에 토의 된 바와 같이 이동상의 유속이 증가할수록 두 시료의 체류시간 차 이가 줄어들어 분리도가 감소하고 그에 따라 분리되는 시토신과 구 아닌의 수율이 낮아진다.
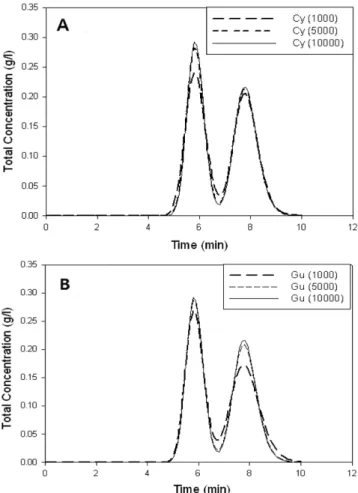
분리도를 증대시키는데 이론단수의 역할도 매우 크다[11]. 이론단 수 영향을 알아보기 위해 시토신과 구아닌 이론 단수를 변화시켰을 때 전산모사 결과를 Fig. 4에 나타냈다. Fig. 4(A)에서 구아닌 이론 단수가 10,000일 때, 시토신 이론단수를 1,000, 5,000, 10,000으로
Fig. 2. Chromatogram simulation results according to the increase of sample concentration (flow rate=0.5 mL/min, sample con- centration range=0.25~1.0 g/L, first peak is cytosine, second peak guanine).
Fig. 3. Simulated chromatograms according to the increase of flow rate (sample concentration=0.5 g/L, flow rate range=0.5~2.0 mL/min).
Table 2. Simulated resolution of cytosine and guanine according to the change of flow rate in ASPEN chromatography
Flow rate Resolution
2.0 ml/min 1.5 ml/min 1.0 ml/min 0.5 ml/min
1.9 2.7 3.3 4.2 Sample concentration = 0.5 g/L, sample volumn = 100 µL.
Fig. 4. Simulated chromatograms by changing number of plates (Np) for cytosine (A) and guanine (B) with fixed other compo- nent’s Np (fixed Np: 10000, sample concentration 0.5 g/L, flow rate range: 0.5 mL/min).
변화시켜 비교하였고 Fig. 4(B)는 시토신 이론단수가 10,000일 때 구아닌 이론단수를 1,000, 5,000, 10,000로 변화시켜 구아닌과 시토 신 크로마토그래피를 비교한 결과이다. 두 그림 모두 구아닌, 시토 신 이론단수 수치가 하나가 고정되고 나머지가 변하더라도 피크의 높이와 폭 모두 영향을 받는 것으로 나타났다. 그러므로 구아닌과 시토신의 분리 효율을 높이기 위해서는 두 이론 단수를 적절히 조 절하는 것이 요구된다. 또한 이론단수 변화 중 1,000과 5,000은 많 은 차이가 나지만 5,000과 10,000은 큰 차이가 나지 않음을 볼 수 있었다. 따라서 이론단수의 크기가 5,000 이상에서 분리효율의 변 화가 작았다.
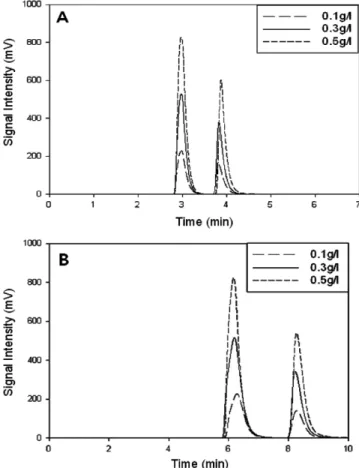
Fig. 5는 이동상 유속과 시료의 농도를 변화시켜 체류시간과 peak 의 높이를 비교한 실험결과이다. Fig. 5(A)는 유속 1.0 ml/min에서 시료농도를 0.1, 0.3, 0.5 g/L로 변화를 주었을 경우 결과이고 Fig.
5(B)는 유속 0.5 mL/min에서 시료농도를 0.1, 0.3, 0.5 g/L로 변화 시 두 성분의 체류시간 변화를 비교한 그림이다. 시토신과 구아닌 주입량에 따른 체류시간의 차이는 보이지 않았다. 그리고 Fig. 5의 결과로 유속에 따른 시료의 분리도와 이론단수를 Table 3에서 계산 하였다. 유속 0.5 mL/min은 1.0 mL/min에 비해 시료의 체류시간은 길지만 분리도와 이론단수에 중요한 체류시간의 차가 더 크고 분리 도와 이론단수역시 더 좋게 나타냈다. 따라서 두 유속에 대한 결과 를 비교하면 0.5 mL/min가 1.0 mL/min에 비해 분리효율 면에서 더 적합하다는 것을 관찰할 수가 있다.
Aspen chromatography 전산모사에서 얻은 결과와 HPLC C18 칼
럼을 이용한 실험을 통해 얻은 특성을 알아보고 두 결과를 비교하 였다. Table 2와 3의 분리도를 비교하면 유속 0.5, 1.0 mL/min Aspen chromatography 전산모사와 HPLC 실험에서 분리도가 거의 비슷한 수치를 나타냈다. 문헌 10에서도 언급했듯이 Aspen chromatography 전산모사는 최적의 크로마토그램을 얻는데 목적이 있다. Fig. 6은 Table 1의 조건으로 Aspen Chromatography 전산모사를 수행하여 HPLC 실험과 전산모사를 비교한 것이다. Fig. 6(A)는 유속 1.0 mL/
min, Fig. 6(B)는 유속 0.5 mL/min의 결과로 실험과 전산모사 크로 마토그래피가 일치하는 결과를 얻을 수 있었다.
감 사
한국연구재단의 기초연구비지원(20090072799)에 감사드립니다.
Fig. 5. Experimental HPLC chromatograms by changing sample con- centrations and mobile phase flow rates ((A) flow rate=1.0 mL/
min, (B) flow rate=0.5 mL/min first peak is cytosine, second peak guanine).
Table 3. Experimental resolution and Number of Plates of cytosine and guanine according to the change of flow rate
Flow rate Resolution Np
Cytosine Guanine 1.0 ml/min
0.5 ml/min
3.1 4.8
2800 6800
4500 9500 wavelength = 270 nm, sample loop = 100µl mobile phase (water/methanol/
acetic acid ) = 90/10/0.5
Fig. 6. Comparison of HPLC and Aspen chromatograpy simulation under the conditions in Table 1; sample loop=100 µl, concen- tration=0.5 g/L; (A) flow rate=1.0 mL/min, (B) flow rate=0.5 mL/min.
화학공학 제48권 제1호 2010년 2월
참고문헌
1. Li, L. S., Liu, M., Da, S. L. and Feng, Y. Q., “Studies on the Chromatographic Behavior of Nucleoside and Bases On p-tert- Butyl-calix[8]arene-bonded Silica Gel Sataionary Phase by HPLC,”
Talanta, 63, 433-441(2004).
2. Nelson, D. L. and Cox, M. M., The Lehninger Principles of Bio- chemistry, 4th ed., World Science, Seoul(2006).
3. Grob, M. K., O’Brien, K., Chu, J. J. and Chen, D. D. Y., “Opti- mization of Cellular Nucleotide Extraction and Sample Preparation for Nucleotide Pool Analyses Using Capillary Electrophoresis,”
J. Chromatogr. B, 788, 103-111(2003).
4. Minniti, G., Caruso, U., Cerone, R. and de Toni, E., “Purines and Pyrimidines Determination in Urine Using High-performance Liquid Chromatography,” Adv. Exp. Med. Biol., 431, 843-848(1998).
5. Mishra, D. and Pal, S., “Ionization Potential and Structure Relax- ation of Adenine, Thymine, Guanine and Cytosine Bases and Their Base Pairs: A Quantification of Reactive Sites,” J. Mol. Struct., 902, 96-102(2009).
6. Ping, W. and Jicun, Ren., “Separation of Purine and Pyrimidine Bases by Capillary Electrophoresis Using β-cyclodextrin as an Additive,” J Pharm. Biomed. Anal, 34, 277-283(2004).
7. Geldart, S. E. and Brown, P. R., “Separation of Purine and Pyri- midine Bases by Capillary Zone Electrophoresis with Carbonate Buffers,” J. Chromatogr. A, 831, 123-129(1999).
8. Park, M. B. and Kim, I. H., “Effect of Temperature and Eluent Composition on the Separation of Ketoprofen and Ibuprofen Racemates in Kromasil HPLC Column,” Korean Chem. Eng.
Res., 47, 54-58(2009).
9. Jeon, Y. J., Lee, E. and Kim, I. H., "HPLC study for egg white analysis,” Korean J. Biotechnol. Bioeng., 22, 119-122(2007).
10. Lee, S. H., Lee, E. and Kim, I. H., “Simulation of SMB(Simu- lated Moving Bed) Chromatography for Separation of L-ribose and L-arabinose by Aspen Chromatography,” Korean J. Biotech- nol. Bioeng, 23, 135-141(2008).
11. Kim, J. A., Park, M. B. and Kim, I. H., “Batch Chromatography Simulation of Tröger Base by Aspen Chromatography,” Korean Chem. Eng. Res, 47, 615-619(2009).