Clinical Significance of Non-Alcoholic Fatty Liver Disease as a Risk Factor for Prehypertension
Previous epidemiologic studies have shown the clinical association between non-alcoholic fatty liver disease (NAFLD) and cardiovascular disease (CVD). However, there is only limited information about the effect of NAFLD on the development of hypertension. Accordingly, we investigated the clinical association between NAFLD and prehypertension. A prospective cohort study was conducted on the 11,350 Korean men without prehypertension for 5 yr.
The incidences of prehypertension were evaluated, and Cox proportional hazard model was used to measure the hazard ratios (HRs) for the development of prehypertension according to the degree of NAFLD (normal, mild, moderate to severe). The incidence of prehypertension increased according to NAFLD states (normal: 55.5%, mild: 63.7%, moderate to severe:
70.3%, P < 0.001). Even after adjusting for multiple covariates, the HRs (95% confidence interval) for prehypertension were higher in the mild group (1.18; 1.07-1.31) and moderate to severe group (1.62; 1.21-2.17), compared to normal group, respectively (P for trend
< 0.001). The development of prehypertension is more potentially associated with the more progressive NAFLD than normal and milder state. These findings suggest the clinical significance of NAFLD as one of risk factors for prehypertension.
Keywords: Non-Alcoholic Fatty Liver Disease; Blood Pressure; Prehypertension Jae-Hong Ryoo,1,2* Woo Taek Ham,3*
Joong-Myung Choi,1 Min A Kang,1 So Hee An,1 Jong-Keun Lee,1 Ho Cheol Shin,4 and Sung Keun Park1,5
1Department of Preventive Medicine, School of Medicine, Kyung Hee University, Seoul; 2Department of Occupational and Environmental Medicine, Bucheon Daesung Hospital, Bucheon; 3Department of Physical Education, Graduate School, Sangji University, Wonju; 4Department of Family Medicine and 5Total Healthcare Center, Kangbuk Samsung Hospital, Sungkyunkwan University, School of Medicine, Seoul, Korea
*Jae-Hong Ryoo and Woo Taek Ham contributed equally to this work.
Received: 11 December 2013 Accepted: 24 April 2014 Address for Correspondence:
Sung Keun Park, MD
Total Healthcare Center, Kangbuk Samsung Hospital, 78 Saemunan-gil, Jongro-gu, Seoul 110-746, Korea Tel: +82.10-3377-6314, Fax: +82.2-2001-2626 E-mail: [email protected]
http://dx.doi.org/10.3346/jkms.2014.29.7.973 • J Korean Med Sci 2014; 29: 973-979
INTRODUCTION
Non-alcoholic fatty liver disease (NAFLD) is being recognized as not only most common liver disease but also metabolic dis- ease (1, 2). Especially, as NAFLD was known to be deeply relat- ed to metabolic syndrome, there was increasing attention for the clinical association between NAFLD and cardiovascular disease (CVD). In practice, CVD was the second common cause of death next to cancer in 18 yr’ follow up study for 132 NAFLD patients (3). In addition, diabetic patients with NAFLD had the higher prevalence of coronary arterial disease, cerebrovascular disease, and peripheral vascular disease than diabetic patients without NAFLD (4). As the pathophysiologic mechanisms of these associations, increased carotid artery intima-media thick- ness and decreased brachial artery endothelial flow-mediated vasodilation were suggested (5-7).
Nonetheless, there was only limited information about asso- ciation between NAFLD and hypertension. Although Donati et al. (8) reported that prevalence of hypertension is high in the NAFLD patients with normal liver enzyme, their report has a limitation of the small scale with a few cases. Especially, consid-
ering the role of hypertension in the development of CVD, there is necessity for a study to investigate the association between NAFLD and hypertension. Accordingly, we conducted this study to investigate the effects of NAFLD on the development of pre- hypertension, identified as a predictor for developing hyper- tension.
MATERIALS AND METHODS Study design
A prospective cohort study was conducted to examine the as- sociation between NAFLD and the development of prehyper- tension in Korean men participating in a medical health check- up program at the Health Promotion Center of Kangbuk Sam- sung Hospital, Sungkyunkwan University, Seoul, Korea. The background and purpose of the medical health check-up pro- gram is precisely described in the previous study of our group (9).
Study population
This study was based on the medical data derived from the health check-up program for Korean employees in 2005 yr. The study Gastroenterology & Hepatology
population was composed of Korean male workers, and the system of medical health check up was described in our previ- ous study in detail (9).
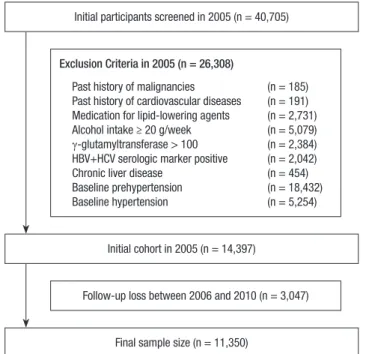
A total of 40,705 men, aged from 30 to 59 yr old, who under- went the abdominal ultrasonography (US) during a medical health check-up in 2005 participated in this study. Among the 40,705 participants, 26,308 men were excluded on the basis of the following exclusion criteria that might influence prehyper- tension or US findings: 185 had a past history of a malignancy;
191 had a past history of cardiovascular disease; 2,731 were re- ceiving medication for lipid-lowering agents; 5,079 had an al- cohol intake of ≥ 20 g/day; 2,384 had elevated γ-glutamyltrans- ferase (GGT) levels (> 100 U/L); 2,003 had a positive serologic marker for hepatitis B surface antigen (HBsAg); 39 had a posi- tive serologic marker for hepatitis C virus antibody (HCVAb);
454 had abnormal US findings such as chronic liver disease, liver cirrhosis, and/or current or past history of clonorchiasis;
18,432 and 5,254 had a baseline prehypertension or hyperten- sion, respectively at initial examinations.
Because some participants had more than one exclusion cri- teria, the total number of men eligible for the study was 14,397.
We further excluded 3,047 participants who lost to follow-up between 2006 and 2010. The lost to follow-up was developed for the reasons such as retirement, unexpected disease, acci- dents or changing hospital for their will. Accordingly, 11,350 participants were included in the final analysis (Fig. 1). The to- tal follow-up period was 32,180.1 person year and average fol- low-up period was 2.84 (standard deviation [SD], 1.44) person year.
Clinical and laboratory measurements
Study data included a medical history, a physical examination, information provided by a questionnaire, anthropometric mea- surements and laboratory measurements. The medical history and the history of drug prescription were assessed by the exam- ining physicians. All the participants were asked to respond to a questionnaire on health-related behavior. Questions about al- cohol intake included the frequency of alcohol consumption on a weekly basis and the usual amount that was consumed on a daily basis (≥ 20 g/day). Persons smoking at that time were considered to be current smokers. In addition, the participants were asked about their weekly frequency of physical activity, such as jogging, bicycling, and swimming that lasted long enough to produce perspiration (≥ 1 time/week).
Anthropometric measurements and procedures for obtain- ing and examining the blood samples were described in detail elsewhere (9). Systolic and diastolic blood pressure (BP) was measured by a standardized mercury sphygmomanometer af- ter at least 5 min of seated rest using the Hypertension Detec- tion Protocol (10). According to the JNC-7 guidelines, normal BP was defined as a systolic BP less than 120 mmHg and a dia- stolic BP less than 80 mmHg, prehypertension as a systolic BP of 120-139 mmHg or a diastolic BP of 80-89 mmHg, hyperten- sion as a systolic BP of at least 140 mmHg or a diastolic BP at least 90 mmHg, or current use of antihypertensive agents (11).
Diabetes mellitus was defined as fasting serum glucose ≥ 126 mg/dL, or current use of diabetic medications.
The clinical laboratory has been accredited and participated annually in inspections and surveys by the Korean Association of Quality Assurance for Clinical Laboratories.
The diagnosis of fatty liver and the evaluation of its degree were based on the results of abdominal US with a 3.5-MHz trans- ducer (Logic Q700 MR, GE, Milwaukee, WI, USA). Abdominal US were carried out by experienced radiologists who were un- aware of the aims of the study and blind to the laboratory val- ues. Images were captured in a standard fashion, with the pa- tient in the supine position, with the right arm raised above the head. The fatty liver disease was diagnosed according to the standard criteria described by previous studies, including pa- renchymal brightness, liver-to-kidney contrast, deep beam at- tenuation, and bright vessel walls (12-14). To assess the intra- and inter-observer reliability of ultrasound diagnosis of fatty liver, random samples of 200 stored ultrasonographic images were re-read at least two weeks apart by the eleven radiologists.
All radiologists were blinded to clinical information. The inter- observer reliability and intra-observer reliability for fatty liver diagnosis were substantial (kappa static of 0.74) and excellent (kappa static of 0.94), respectively.
The presence of metabolic syndrome (MetS) was evaluated according to the joint interim statement of the International Dia- betes Federation Task Force on Epidemiology and Prevention (15).
Fig. 1. Flow chart of the enrolled study population.
Initial participants screened in 2005 (n = 40,705)
Initial cohort in 2005 (n = 14,397)
Follow-up loss between 2006 and 2010 (n = 3,047) Exclusion Criteria in 2005 (n = 26,308)
Past history of malignancies (n = 185) Past history of cardiovascular diseases (n = 191) Medication for lipid-lowering agents (n = 2,731) Alcohol intake ≥ 20 g/week (n = 5,079) γ-glutamyltransferase > 100 (n = 2,384) HBV+HCV serologic marker positive (n = 2,042)
Chronic liver disease (n = 454)
Baseline prehypertension (n = 18,432) Baseline hypertension (n = 5,254)
Final sample size (n = 11,350)
Statistical analysis
Data were expressed as means ± (SD) or medians (interquartile range) for continuous variables and percentages of the number for categorical variables.
The one-way ANOVA and chi-square-test were used to ana- lyze the statistical differences among the characteristics of the study participants at the time of enrollment in relation to the NAFLD categories. Categories of the NAFLD comprised the fol- lowing: normal, mild, moderate and severe. Moderate (n = 382) and severe NAFLD (n = 9) was combined into moderate to se- vere NAFLD category for analyses, owing to the small number of severe NAFLD. The distributions of continuous variables were evaluated, and log transformations were used in the analysis as required. For incident prehypertension cases, the time of pre- hypertension development was assumed to be the midpoint between the time of visit when prehypertension was first diag- nosed and the time of baseline visit in 2005. The person years were calculated as the sum of follow-up times from the baseline to an assumed time of prehypertension development or to the final examination of each individual. Cox proportional hazards model was used to estimate adjusted hazard ratios (HRs) and 95% confidence intervals (CI) for incident prehypertension com- paring the mild and moderate to severe NAFLD categories vs.
the normal group. The data were adjusted, first for age alone, then for the multiple covariates. In the multivariate models, we included variables that might confound the relationship be- tween NAFLD and prehypertension, which include: age, log (hsCRP), HDL-cholesterol, serum creatinine, recent smoking status, regular exercise, MetS and diabetes mellitus. For the lin- ear trends of risk, the number of NAFLD categories was used as a continuous variable and tested on each model. To use the Cox proportional hazards models, we checked the validity of the proportional hazards assumption. Two approaches were used to assess the validity of the proportional hazards assumption.
First, the assumption was assessed by log-minus-log-survival function and found to graphically hold. Second, to confirm the validity of the proportional hazards assumption, time-depen- dent covariate analysis was used. The time-dependent covari- ate was not statistically significant, suggesting that the propor- tional hazards assumption is not violated (P = 0.441). P values
< 0.05 were considered to be statistically significant. Statistical analyses were performed PASW Statistics 18 (SPSS Inc., Chica- go, IL, USA).
Ethics statement
Ethics approvals for the study protocol and analysis of the data were obtained from the institutional review board of Kangbuk Samsung Hospital (IRB number: KBC12060). The informed consent requirement was exempted by the board because re- searchers only accessed retrospectively a de-identified data- base for analysis purposes.
RESULTS
During 32,180.1 person-years of follow-up, 6,602 (58.2%) inci- dent cases of prehypertension developed between 2006 and 2010. Compared with analytic cohort (n = 11,350), 3,047 partic- ipants not included in analytic cohort were 0.7 yr older (42.1 vs.
41.4) and had a less favorable baseline metabolic profiles in age, diastolic BP, fasting serum glucose, smoking status and di- abetes mellitus (Table 1).
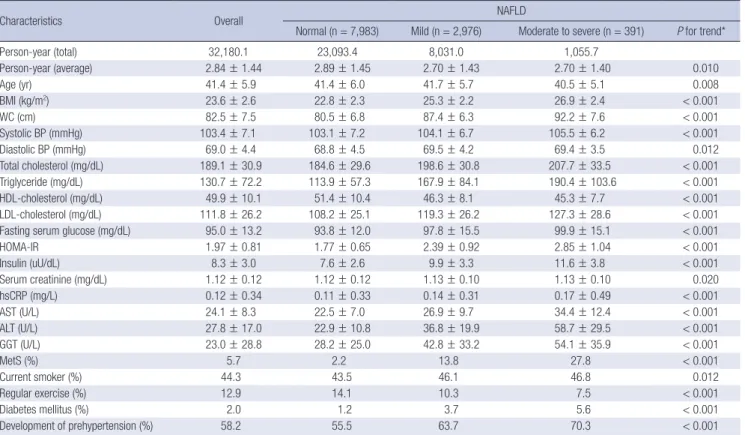
The baseline characteristics of the study participants in rela- tion to the NAFLD categories are presented in Table 2. At base- line, the mean (SD) age and BMI of study participants were 41.4 (5.9) yr and 23.6 (2.6) kg/m2, respectively. There were clear dose response relationships between all of the listed variables and NAFLD categories.
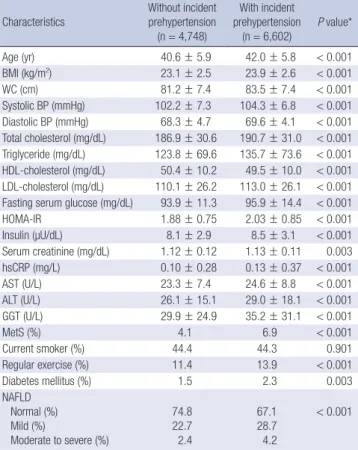
In contrast to participants without development of prehyper- tension, those with development of prehypertension were slight- ly older (42.0 vs. 40.6) and more likely to have the diabetes mel- litus and NAFLD. As expected, all clinical variables showed sta- tistically significant differences between two groups except for smoking status (Table 3).
Table 4 shows the hazard ratios and 95% CI for prehyperten- sion according to the NAFLD categories. In unadjusted model, Table 1. Comparison between exclusion from analysis and inclusion in analysis
Characteristics Exclusion from analysis (n = 3,047)
Inclusion in analysis (n = 11,350)
P value*
Age (yr) 42.1 ± 6.6 41.4 ± 5.8 < 0.001
BMI (kg/m2) 23.6 ± 2.6 23.6 ± 2.6 0.891
WC (cm) 82.5 ± 7.6 82.5 ± 7.5 0.794
Systolic BP (mmHg) 103.2 ± 7.4 103.4 ± 7.1 0.108
Diastolic BP (mmHg) 69.2 ± 4.5 69.0 ± 4.4 0.012
Total cholesterol (mg/dL) 189.8 ± 31.4 189.1 ± 30.9 0.213 Triglyceride (mg/dL) 131.8 ± 74.4 130.7 ± 72.2 0.470 HDL-cholesterol (mg/dL) 49.8 ± 10.1 49.9 ± 10.1 0.688 LDL-cholesterol (mg/dL) 112.7 ± 26.6 111.8 ± 26.2 0.102 Fasting serum glucose (mg/dL) 96.0 ± 16.0 95.0 ± 13.1 0.002
HOMA-IR 1.99 ± 0.84 1.97 ± 0.81 0.325
Insulin (uU/dL) 8.3 ± 3.0 8.3 ± 3.0 0.837
Serum creatinine (mg/dL) 1.12 ± 0.11 1.12 ± 0.11 0.258
hsCRP (mg/L) 0.12 ± 0.27 0.12 ± 0.34 0.886
AST (U/L) 24.2 ± 9.5 24.1 ± 8.3 0.544
ALT (U/L) 28.0 ± 17.7 27.8 ± 17.0 0.506
GGT (U/L) 32.8 ± 27.3 32.9 ± 28.8 0.850
MetS (%) 6.1 5.7 0.493
Current smoker (%) 48.2 44.3 < 0.001
Regular exercise (%) 14.4 12.9 0.024
Diabetes mellitus (%) 2.9 2.0 0.003
Data are expressed as means ± standard deviation or percentages. *P value by t- test for continuous variables and chi square test for categorical variables. BMI, body mass index; WC, waist circumference; BP, blood pressure; HDL, high density lipopro- tein; LDL, low density lipoprotein; HOMA-IR, homeostasis model assessment of insu- lin resistance; hsCRP, high-sensitivity c-reactive protein; AST, aspartate aminotrans- ferase; ALT, alanine aminotransferase; GGT, γ-glutamyltransferase; MetS, metabolic syndrome.
Table 2. Baseline characteristics of participants according to NAFLD categories (n=11,350)
Characteristics Overall NAFLD
Normal (n = 7,983) Mild (n = 2,976) Moderate to severe (n = 391) P for trend*
Person-year (total) 32,180.1 23,093.4 8,031.0 1,055.7
Person-year (average) 2.84 ± 1.44 2.89 ± 1.45 2.70 ± 1.43 2.70 ± 1.40 0.010
Age (yr) 41.4 ± 5.9 41.4 ± 6.0 41.7 ± 5.7 40.5 ± 5.1 0.008
BMI (kg/m2) 23.6 ± 2.6 22.8 ± 2.3 25.3 ± 2.2 26.9 ± 2.4 < 0.001
WC (cm) 82.5 ± 7.5 80.5 ± 6.8 87.4 ± 6.3 92.2 ± 7.6 < 0.001
Systolic BP (mmHg) 103.4 ± 7.1 103.1 ± 7.2 104.1 ± 6.7 105.5 ± 6.2 < 0.001
Diastolic BP (mmHg) 69.0 ± 4.4 68.8 ± 4.5 69.5 ± 4.2 69.4 ± 3.5 0.012
Total cholesterol (mg/dL) 189.1 ± 30.9 184.6 ± 29.6 198.6 ± 30.8 207.7 ± 33.5 < 0.001
Triglyceride (mg/dL) 130.7 ± 72.2 113.9 ± 57.3 167.9 ± 84.1 190.4 ± 103.6 < 0.001
HDL-cholesterol (mg/dL) 49.9 ± 10.1 51.4 ± 10.4 46.3 ± 8.1 45.3 ± 7.7 < 0.001
LDL-cholesterol (mg/dL) 111.8 ± 26.2 108.2 ± 25.1 119.3 ± 26.2 127.3 ± 28.6 < 0.001
Fasting serum glucose (mg/dL) 95.0 ± 13.2 93.8 ± 12.0 97.8 ± 15.5 99.9 ± 15.1 < 0.001
HOMA-IR 1.97 ± 0.81 1.77 ± 0.65 2.39 ± 0.92 2.85 ± 1.04 < 0.001
Insulin (uU/dL) 8.3 ± 3.0 7.6 ± 2.6 9.9 ± 3.3 11.6 ± 3.8 < 0.001
Serum creatinine (mg/dL) 1.12 ± 0.12 1.12 ± 0.12 1.13 ± 0.10 1.13 ± 0.10 0.020
hsCRP (mg/L) 0.12 ± 0.34 0.11 ± 0.33 0.14 ± 0.31 0.17 ± 0.49 < 0.001
AST (U/L) 24.1 ± 8.3 22.5 ± 7.0 26.9 ± 9.7 34.4 ± 12.4 < 0.001
ALT (U/L) 27.8 ± 17.0 22.9 ± 10.8 36.8 ± 19.9 58.7 ± 29.5 < 0.001
GGT (U/L) 23.0 ± 28.8 28.2 ± 25.0 42.8 ± 33.2 54.1 ± 35.9 < 0.001
MetS (%) 5.7 2.2 13.8 27.8 < 0.001
Current smoker (%) 44.3 43.5 46.1 46.8 0.012
Regular exercise (%) 12.9 14.1 10.3 7.5 < 0.001
Diabetes mellitus (%) 2.0 1.2 3.7 5.6 < 0.001
Development of prehypertension (%) 58.2 55.5 63.7 70.3 < 0.001
Data are means ± standard deviation, medians or percentages. *P value by ANOVA-test for continuous variables and chi square test for categorical variables. BMI, body mass index; WC, waist circumference; BP, blood pressure; HDL, high density lipoprotein; LDL, low density lipoprotein; HOMA-IR, homeostasis model assessment of insulin resistance;
hsCRP, high-sensitivity c-reactive protein; AST, aspartate aminotransferase; ALT, alanine aminotransferase; GGT, γ-glutamyltransferase; MetS, metabolic syndrome.
the hazard ratios and 95% CI for prehypertension increased ac- cording to the degree of NAFLD (mild NAFLD, 1.26 [1.20-1.33];
moderate to severe NAFLD, 1.40 [1.24-1.58], respectively [P for trend < 0.001]). These associations remained statistically signif- icant, even after further adjustments for covariates in model 1 and 2. In model 2, the adjusted hazard ratios and 95% CI for pre- hypertension were 1.18 (1.07-1.31) and 1.62 (1.21-2.17), respec- tively (P for trend < 0.001).
DISCUSSION
This study demonstrated a significant association between de- gree of NAFLD and the subsequent development of prehyper- tension in Korean men. This association was independent of age, HDL-cholesterol, log (hsCRP), serum creatinine, recent smoking status, regular exercise, MetS and diabetes.
These findings can be epidemiologic evidence sustaining the causative relation between NAFLD and CVD. As aforemention- ed, there is only limited data explaining the association between NAFLD and CVD. Although several studies have indicated the independent role of NAFLD on CVD (16-19), the pathophysio- logic mechanism remains unclear. However, our study findings may be one of pathophysiologic mechanism for these studies.
Especially, considering the disease progression from prehyper-
tension through hypertension to CVD, our study suggests the role of NAFLD in the development of CVD.
As the mechanism of our findings, we suggest theories con- cerning the effects of NAFLD on circulatory system. The first is insulin resistance identified as the critical factor for the devel- opment of NAFLD. Insulin resistance can induce dyslipidemia and provoke the secretion of proinflammatory cytokine such as tumor necrosis factor-α and interleukin-6, which accelerates the arteriosclerosis (20-22). These conditions can decrease the vascular elasticity and luminal width to increase blood pres- sure. The second is the oxidative stress, and chronically poten- tial inflammation associated with NAFLD (23, 24). NAFLD is related with the increased oxidative stress and hazardous cyto- kine as well as decreased anti-atherogenic factor like adiponec- tin (25, 26). These hazardous conditions can provoke the infla- mmatory response in the arterial inside to deteriorate the arte- riosclerosis. Considering the significant association between arteriosclerosis and hypertension, these theories may be a prob- able background to explain the mechanism of the present study.
When interpreting our results, some limitations should be considered. First, the presence of NAFLD was assessed by ultra- sonographic method instead of pathologic method. Although US is regarded reasonably accurate, it cannot identify fatty infil- tration of the liver below the threshold of 30% (27). However, it
Table 3. Comparison between participants with and without incident prehypertension Characteristics Without incident
prehypertension (n = 4,748)
With incident prehypertension
(n = 6,602) P value*
Age (yr) 40.6 ± 5.9 42.0 ± 5.8 < 0.001
BMI (kg/m2) 23.1 ± 2.5 23.9 ± 2.6 < 0.001
WC (cm) 81.2 ± 7.4 83.5 ± 7.4 < 0.001
Systolic BP (mmHg) 102.2 ± 7.3 104.3 ± 6.8 < 0.001 Diastolic BP (mmHg) 68.3 ± 4.7 69.6 ± 4.1 < 0.001 Total cholesterol (mg/dL) 186.9 ± 30.6 190.7 ± 31.0 < 0.001 Triglyceride (mg/dL) 123.8 ± 69.6 135.7 ± 73.6 < 0.001 HDL-cholesterol (mg/dL) 50.4 ± 10.2 49.5 ± 10.0 < 0.001 LDL-cholesterol (mg/dL) 110.1 ± 26.2 113.0 ± 26.1 < 0.001 Fasting serum glucose (mg/dL) 93.9 ± 11.3 95.9 ± 14.4 < 0.001
HOMA-IR 1.88 ± 0.75 2.03 ± 0.85 < 0.001
Insulin (µU/dL) 8.1 ± 2.9 8.5 ± 3.1 < 0.001
Serum creatinine (mg/dL) 1.12 ± 0.12 1.13 ± 0.11 0.003
hsCRP (mg/L) 0.10 ± 0.28 0.13 ± 0.37 < 0.001
AST (U/L) 23.3 ± 7.4 24.6 ± 8.8 < 0.001
ALT (U/L) 26.1 ± 15.1 29.0 ± 18.1 < 0.001
GGT (U/L) 29.9 ± 24.9 35.2 ± 31.1 < 0.001
MetS (%) 4.1 6.9 < 0.001
Current smoker (%) 44.4 44.3 0.901
Regular exercise (%) 11.4 13.9 < 0.001
Diabetes mellitus (%) 1.5 2.3 0.003
NAFLD Normal (%) Mild (%)
Moderate to severe (%)
74.8 22.7 2.4
67.1 28.7 4.2
< 0.001
Data are are means ± standard deviation, medians or percentages. *P value by ANO- VA-test for continuous variables and Chi square test for categorical variables. BMI, body mass index; WC, waist circumference; BP, blood pressure; HDL, high density li- poprotein; LDL, low density lipoprotein; HOMA-IR, homeostasis model assessment of insulin resistance; hsCRP, high-sensitivity c-reactive protein; AST, aspartate amino- transferase; ALT, alanine aminotransferase; GGT, γ-glutamyltransferase; MetS, meta- bolic syndrome.
Table 4. Hazard ratios and 95% confidence intervals for the incidence of prehypertension according to NAFLD categories
Categories Hazard ratios (95% confidence interval)
Unadjusted Age-adjusted Model 1 Model 2
NAFLD Normal Mild
Moderate to severe P for trend
1.00 (reference) 1.26 (1.20-1.33) 1.40 (1.24-1.58)
< 0.001
1.00 (reference) 1.25 (1.19-1.32) 1.44 (1.28-1.63)
< 0.001
1.00 (reference) 1.24 (1.16-1.32) 1.46 (1.27-1.66)
< 0.001
1.00 (reference) 1.18 (1.07-1.31) 1.62 (1.21-2.17)
< 0.001
Age 1.04 (1.03-1.04) 1.04 (1.03-1.04) 1.03 (1.03-1.04)
HDL-cholesterol 1.00 (0.99-1.00) 1.00 (0.99-1.00)
Log (hsCRP) 1.08 (1.05-1.11) 1.07 (1.03-1.12)
Serum creatinine 1.26 (0.95-1.65) 1.25 (0.81-1.93)
Smoking status 1.02 (0.93-1.11)
Regular exercise 0.84 (0.74-0.95)
MetS 1.37 (1.12-1.59)
Diabetes mellitus 1.04 (0.80-1.36)
Model 1 was adjusted for age, HDL-cholesterol, log (hsCRP) and serum creatinine. Model 2 was adjusted for model 1 plus recent smoking status, regular exercise, MetS and diabetes mellitus. HDL, high density lipoprotein; hsCRP, high-sensitivity c-reactive protein; MetS, metabolic syndrome.
is inappropriate to perform invasive tests in a population-based epidemiological study (28). In addition, all examinations were carried out by experienced radiologists using widely established
methods, and US examination of our group has credible inter- and intra-observer reliability. Thus, US might be clinically ap- propriate and reasonable modality to diagnose NAFLD in this study.
Second, we could not count obesity into adjusting covariates.
Especially, considering the significance of obesity in the devel- opment of hypertension, this limitation should be addressed.
However, when body mass index (BMI) was included in adjust- ing covariates, we found that statistical significance disappeared.
These findings suggest the pivotal role of obesity on the devel- opment of NAFLD and prehypertension. Actually, when study participants were divided to 2 groups of BMI < 28 and BMI ≥ 28, we could ascertain the interesting results. While people with BMI < 28 showed the statistically significant HR for prehyper- tension, people with BMI ≥ 28 did not have the significant HR.
This finding shows the stronger effect of obesity on prehyper- tension than that of NAFLD. Thus, we could not be sure that NAFLD was a risk factor for prehypertension independently of obesity. Nonetheless, it does not seem that NAFLD has no con- tributory relationship with the development of prehyperten- sion. In this study, NAFLD was significantly associated with the risk for prehypertension even after adjusting for diabetes, fast- ing glucose level and MetS. Diabetes, fasting glucose and meta- bolic syndrome are medical conditions encompassing meta- bolic conditions of insulin resistance. As aforementioned, insu- lin resistance plays a significant role in elevation of blood pres- sure. Accordingly, the finding that statistical significance remain- ed even after adjusting for parameters of insulin resistance is thought to be showing the significant association between NAF- LD and prehypertension.
Third, our study population was only limited to Korean men.
Although prevalence of NAFLD is different between two gen- ders, including women may be better to show the effect of NA- FLD on IR. Especially, the prevalence of NAFLD is compara-
tively lower in woman than man, and known to increase in post- menopausal state (29, 30). In addition, Bedogni et al. (31) showed that gender was the significant predictor of NAFLD. Thus, these results cannot be necessarily extrapolated to women and other ethnic groups and further studies are needed.
In conclusion, our findings, which were obtained from large number of cohort, showed that the risk of prehypertension in- creased in proportion to the degree of NAFLD during a 5-yr’
follow-up. However, when BMI was counted into adjusting co- variates, the statistical significance was not maintained. These findings suggest not only the availability but also the limitation of NAFLD as a risk factor for prehypertension. Therefore, to re- veal the more correct association between NAFLD and prehy- pertension, consecutive studies should be conducted to reveal the effect of NAFLD on the blood pressure.
DISCLOSURE
The authors have no potential conflicts of interest to disclose.
ORCID
Jae-Hong Ryoo http://orcid.org/0000-0002-5232-1426 Woo Taek Ham http://orcid.org/0000-0003-3212-1627 Joong-Myung Choi http://orcid.org/0000-0002-3610-6662 Min A Kang http://orcid.org/0000-0003-1889-8122 So Hee An http://orcid.org/0000-0002-8436-7402 Jong-Keun Lee http://orcid.org/0000-0003-1376-3202 Ho Cheol Shin http://orcid.org/0000-0003-0212-1917 Sung Keun Park http://orcid.org/0000-0003-4703-9917
REFERENCES
1. Neuschwander-Tetri BA, Caldwell SH. Nonalcoholic steatohepatitis:
summary of an AASLD Single Topic Conference. Hepatology 2003; 37:
1202-19.
2. Browning JD, Szczepaniak LS, Dobbins R, Nuremberg P, Horton JD, Cohen JC, Grundy SM, Hobbs HH. Prevalence of hepatic steatosis in an urban population in the United States: impact of ethnicity. Hepatology 2004; 40: 1387-95.
3. Ong JP, Pitts A, Younossi ZM. Increased overall mortality and liver-relat- ed mortality in non-alcoholic fatty liver disease. J Hepatol 2008; 49: 608- 12.
4. Targher G, Bertolini L, Padovani R, Poli F, Scala L, Tessari R, Zenari L, Falezza G. Increased prevalence of cardiovascular disease in Type 2 dia- betic patients with non-alcoholic fatty liver disease. Diabet Med 2006;
23: 403-9.
5. Brea A, Mosquera D, Martín E, Arizti A, Cordero JL, Ros E. Nonalcoholic fatty liver disease is associated with carotid atherosclerosis: a case-con- trol study. Arterioscler Thromb Vasc Biol 2005; 25: 1045-50.
6. Fracanzani AL, Burdick L, Raselli S, Pedotti P, Grigore L, Santorelli G, Valenti L, Maraschi A, Catapano A, Fargion S. Carotid artery intima-
media thickness in nonalcoholic fatty liver disease. Am J Med 2008; 121:
72-8.
7. Villanova N, Moscatiello S, Ramilli S, Bugianesi E, Magalotti D, Vanni E, Zoli M, Marchesini G. Endothelial dysfunction and cardiovascular risk profile in nonalcoholic fatty liver disease. Hepatology 2005; 42: 473-80.
8. Donati G, Stagni B, Piscaglia F, Venturoli N, Morselli-Labate AM, Rasciti L, Bolondi L. Increased prevalence of fatty liver in arterial hypertensive patients with normal liver enzymes: role of insulin resistance. Gut 2004;
53: 1020-3.
9. Chun H, Park SK, Ryoo JH. Association of serum gamma-glutamyltrans- ferase level and incident prehypertension in Korean men. J Korean Med Sci 2013; 28: 1603-8.
10. Pickering TG, Hall JE, Appel LJ, Falkner BE, Graves J, Hill MN, Jones DW, Kurtz T, Sheps SG, Roccella EJ. Recommendations for blood pres- sure measurement in humans and experimental animals: part 1: blood pressure measurement in humans: a statement for professionals from the Subcommittee of Professional and Public Education of the American Heart Association Council on High Blood Pressure Research. Circulation 2005; 111: 697-716.
11. Chobanian AV, Bakris GL, Black HR, Cushman WC, Green LA, Izzo JL Jr, Jones DW, Materson BJ, Oparil S, Wright JT Jr, et al. Seventh report of the Joint National Committee on Prevention, Detection, Evaluation, and Treatment of High Blood Pressure. Hypertension 2003; 42: 1206-52.
12. Saadeh S, Younossi ZM, Remer EM, Gramlich T, Ong JP, Hurley M, Mul- len KD, Cooper JN, Sheridan MJ. The utility of radiological imaging in nonalcoholic fatty liver disease. Gastroenterology 2002; 123: 745-50.
13. Saverymuttu SH, Joseph AE, Maxwell JD. Ultrasound scanning in the detection of hepatic fibrosis and steatosis. Br Med J (Clin Res Ed) 1986;
292: 13-5.
14. Hernaez R, Lazo M, Bonekamp S, Kamel I, Brancati FL, Guallar E, Clark JM. Diagnostic accuracy and reliability of ultrasonography for the detec- tion of fatty liver: a meta-analysis. Hepatology 2011; 54: 1082-90.
15. Alberti KG, Eckel RH, Grundy SM, Zimmet PZ, Cleeman JI, Donato KA, Fruchart JC, James WP, Loria CM, Smith SC Jr. Harmonizing the meta- bolic syndrome: a joint interim statement of the International Diabetes Federation Task Force on Epidemiology and Prevention; National Heart, Lung, and Blood Institute; American Heart Association; World Heart Federation; International Atherosclerosis Society; and International As- sociation for the Study of Obesity. Circulation 2009; 120: 1640-5.
16. Sung KC, Ryan MC, Wilson AM. The severity of nonalcoholic fatty liver disease is associated with increased cardiovascular risk in a large cohort of non-obese Asian subjects. Atherosclerosis 2009; 203: 581-6.
17. Choi SY, Kim D, Kim HJ, Kang JH, Chung SJ, Park MJ, Kim YS, Kim CH, Choi SH, Kim W, et al. The relation between non-alcoholic fatty liver dis- ease and the risk of coronary heart disease in Koreans. Am J Gastroen- terol 2009; 104: 1953-60.
18. Lin YC, Lo HM, Chen JD. Sonographic fatty liver, overweight and isch- emic heart disease. World J Gastroenterol 2005; 11: 4838-42.
19. Schindhelm RK, Dekker JM, Nijpels G, Bouter LM, Stehouwer CD, He- ine RJ, Diamant M. Alanine aminotransferase predicts coronary heart disease events: a 10-year follow-up of the Hoorn Study. Atherosclerosis 2007; 191: 391-6.
20. Kern PA, Di Gregorio GB, Lu T, Rassouli N, Ranganathan G. Adiponec- tin expression from human adipose tissue: relation to obesity, insulin re- sistance, and tumor necrosis factor-alpha expression. Diabetes 2003; 52:
1779-85.
21. Kern PA, Ranganathan S, Li C, Wood L, Ranganathan G. Adipose tissue tumor necrosis factor and interleukin-6 expression in human obesity and insulin resistance. Am J Physiol Endocrinol Metab 2001; 280: E745-51.
22. Targher G, Arcaro G. Non-alcoholic fatty liver disease and increased risk of cardiovascular disease. Atherosclerosis 2007; 191: 235-40.
23. Marchesini G, Brizi M, Bianchi G, Tomassetti S, Bugianesi E, Lenzi M, McCullough AJ, Natale S, Forlani G, Melchionda N. Nonalcoholic fatty liver disease: a feature of the metabolic syndrome. Diabetes 2001; 50: 1844- 50.
24. Yesilova Z, Yaman H, Oktenli C, Ozcan A, Uygun A, Cakir E, Sanisoglu SY, Erdil A, Ates Y, Aslan M, et al. Systemic markers of lipid peroxidation and antioxidants in patients with nonalcoholic Fatty liver disease. Am J Gastroenterol 2005; 100: 850-5.
25. Matsuzawa Y, Funahashi T, Kihara S, Shimomura I. Adiponectin and metabolic syndrome. Arterioscler Thromb Vasc Biol 2004; 24: 29-33.
26. Pischon T, Girman CJ, Hotamisligil GS, Rifai N, Hu FB, Rimm EB. Plas- ma adiponectin levels and risk of myocardial infarction in men. JAMA
2004; 291: 1730-7.
27. Bedogni G, Miglioli L, Masutti F, Tiribelli C, Marchesini G, Bellentani S.
Prevalence of and risk factors for nonalcoholic fatty liver disease: the Di- onysos nutrition and liver study. Hepatology 2005; 42: 44-52.
28. Joy D, Thava VR, Scott BB. Diagnosis of fatty liver disease: is biopsy nec- essary? Eur J Gastroenterol Hepatol 2003; 15: 539-43.
29. Park SH, Jeon WK, Kim SH, Kim HJ, Park DI, Cho YK, Sung IK, Sohn CI, Keum DK, Kim BI. Prevalence and risk factors of non-alcoholic fatty liv- er disease among Korean adults. J Gastroenterol Hepatol 2006; 21: 138- 43.
30. Gutierrez-Grobe Y, Ponciano-Rodríguez G, Ramos MH, Uribe M, Mén- dez-Sánchez N. Prevalence of non alcoholic fatty liver disease in pre- menopausal, posmenopausal and polycystic ovary syndrome women.
The role of estrogens. Ann Hepatol 2010; 9: 402-9.
31. Bedogni G, Bellentani S, Miglioli L, Masutti F, Passalacqua M, Casti- glione A, Tiribelli C. The Fatty Liver Index: a simple and accurate pre- dictor of hepatic steatosis in the general population. BMC Gastroenterol 2006; 6: 33.