Advancements in the Techniques of Magnetic Resonance Imaging in Neuro-ophthalmology
Yun Jung Bae, MD, Jae Hyoung Kim, MD
Departments of Radiology, Seoul National University Bundang Hospital, Seoul National University College of Medicine, Seongnam, Korea
Magnetic resonance imaging (MRI) is widely used in the field of neuro-ophthalmology. Recently, there has been great progress in the techniques of MRI, enabling better visualization of the pathophysiologic changes of neuro-ophthalmologic disorders. Here, we review our experience in using the conventional MRI sequences with recent developments for evaluating optic neuropathy and ocular motor disease. We hope to provide a better understanding of the advanced neuro-imaging in diagnosing neuro-oph- thalmologic conditions with this review.
Keywords: Magnetic resonance imaging; Ocular motility disorders; Optic nerve diseases
INTRODUCTION
Magnetic resonance imaging (MRI) is important in the field of neuro- ophthalmology.1,2 MRI can provide good spatial resolution and high contrast for soft tissues, enabling precise characterization of neuro-oph- thalmologic disorders.1,2 Traditionally, conventional MRIs, including T1-weighted image (T1-WI), T2-weighted image (T2-WI), fluid-attenu- ated inversion recovery (FLAIR) image, and post-contrast T1-WI, have played considerable parts in identifying the neuro-ophthalmologic le- sions.3 The signal intensity on T1-WI is high in fat tissues, and becomes low in free water contents.2 On the other hand, T2-WI demonstrates free water as high signal intensity; thus, most of the pathological lesions ap- pear to be hyperintense on T2-WI.2 For the detection of T2-hyperintense signal lesions, FLAIR image can be effective by suppressing the physio- logic fluid signal, such as the cerebrospinal fluid (CSF) in the brain or the vitreous fluid in the orbital globe.4 Moreover, post-contrast T1-WI fol- lowing the use of intravenous injection of gadolinium can be useful in the evaluation of tumor and inflammation.4
Recently, many advancements have been made in the techniques of
MRI, which can be applicable to the evaluation of neuro-ophthalmolog- ic disorders and enable better visualization of their pathophysiologic changes. This includes the effective fat suppression technique, diffusion- weighted or diffusion tensor imaging, high-resolution imaging, fast and radial imaging techniques – especially on 3T MRI vendor that allows higher signal-to-noise ratio (SNR) and resolution compared with 1.5T MRI.2 In this article, we will review our experience in using the conven- tional MRI sequences with recent technical developments. We will assess their applicability for neuro-ophthalmologic disorders to better identify the nature of lesions, especially for optic neuropathy and ocular motor disease.
CONVENTIONAL MRI
Upon the diagnosis of optic neuropathy, the most effective sequence for evaluating the normal anatomy of optic pathway is thin-section coro- nal T2-WI (Fig. 1). The intraorbital segment of the optic nerve is a round or oval structure in the center of the orbital globe surrounded by retro- bulbar fat, showing iso-intense signal with subcortical white matter in
Correspondence to: Yun Jung Bae, MD
Departments of Radiology, Seoul National University Bundang Hospital, 173-82 Gumi-ro, Bundang-gu, Seongnam 13620, Korea Tel: +82-31-787-7365, Fax: +82-31-787-4011, E-mail: [email protected]
Received: Nov. 1, 2018 / Accepted: Nov. 15, 2018
REVIEW
the brain.1 CSF in the optic nerve sheath has a bright signal intensity around the optic nerve. The optic nerve passes through the optic canal, forming the canalicular segment, and enters the intracranial space, be- coming the prechiasmatic segment; the prechiasmatic optic nerve is sur- rounded by the T2-hyperintense CSF in the brain. Bilateral prechias- matic optic nerves join at the level of the optic chiasm, and are re-divided into the bilateral optic tracts, which extend into the lateral geniculate bodies. These structures along the bilateral optic pathways are generally symmetric.
Pathologic segments of the optic pathway can be presented with in- creased signal intensity on T2-WI (Fig. 2A). Acute stage of optic neuritis shows T2-high signal change with swelling at the affected segment.
Chronic stage of optic neuropathy also shows increased T2-signal inten- sity; however, it can be accompanied with atrophic change, rather than swelling. To improve the detectability of T2-high signal intensity at the intraorbital segment of the optic nerve surrounded by retrobulbar fat, additional use of fat suppression technique is necessary.3,4 Moreover, the suppression of CSF signal via FLAIR imaging can improve the detection of the lesion in the intraorbital segment surrounded by CSF in the optic nerve sheath, or the lesion in the prechiasmatic segment, optic chiasm, or optic tract surrounded by CSF in the cisternal space.2,3
In case of active inflammation, the lesion can be enhanced on post- contrast T1-WI, following intravenous gadolinium injection (Fig. 2B).5 Tumorous condition such as optic nerve glioma can also be enhanced on Fig. 1. Normal anatomy of optic pathway on coronal T2-weighted image. (A) Intraorbital segment (arrows) of the optic nerve, (B) Canalicular segment (arrows) of the optic nerve, (C) Prechiasmatic segment (arrows) of the optic nerve, and (D) Optic chiasm (arrows).
A B C D
A
Fig. 2. A 42-year-old female with acute stage optic neuritis. (A) Coronal T2-weighted image shows swelling with T2-high signal change in the bilateral optic nerves (arrows). (B) Coronal post-contrast T1-weighted image with fat suppression shows prominent enhancement at bilateral optic nerves (arrows). The technique for fat suppression was the modified Dixon (mDixon) technique, achieving high signal-to-noise ratio and resolution.
B
post-contrast T1-WI; in such a case, diffuse enlargement of the affected optic nerve, the presence of co-existing brain lesion that might suggest demyelinating disease or neurofibromatosis-1 could assist in the differ- entiation between tumor and inflammation.1,5 Moreover, the fat sup- pression technique can facilitate the evaluation of enhancement in the intraorbital optic nerve to suppress T1-high signal intensity of the retro- bulbar fat.4,5
It is well known that gadolinium can increase the signal intensity not only on T1-WI, but also on FLAIR image.6,7 Lower gadolinium concen- tration can generate higher contrast-enhancement on FLAIR image than on T1-WI.8,9 To use this property, coronal contrast-enhanced FLAIR image can be utilized to improve the diagnosis of optic neuri- tis.7,10,11 Boegel et al.10 found out that the diagnostic accuracy of acute stage optic neuritis could be improved with the use of coronal contrast-en- hanced FLAIR image with the fat suppression technique. However, the authors found that the diagnostic accuracy of this sequence for chronic stage optic neuritis insufficient. Li et al.11 also reported the early diagnosis of recurrent optic neuritis made by contrast-enhanced FLAIR image. In addition, leptomeningeal inflammation of the optic neuritis was able to be detected using the same sequence.7
FAT SUPPRESSION TECHNIQUE
As previously stated, the effective fat suppression technique combined with T2-WI, FLAIR, or post-contrast T1-WI can improve the diagnostic quality of MRI for optic neuropathy. The traditional fat suppression technique utilized the short inversion time inversion recovery (STIR) method for the orbital region.12 The STIR technique utilizes non-selec- tive 180° inversion pulse, and the relative short T1 relaxation time of the protons binding to fat, for nullifying signals from lipid.12,13 This method is less sensitive to field inhomogeneity, but it has innate drawback of low SNR due to the use of non-selective inversion pulse.13 The inversion re-
covery can be hybridized with spectral presaturation; however, this method often fails to provide homogeneous fat suppression in the region with substantial field heterogeneity.12,13
Another fat suppression technique is the Dixon method. The original technique to date has been the two-point Dixon method; two images with different echo time are acquired for the decomposition of fat signal from the water signal in the same voxel.14 Between the two images, one is acquired with the protons of fat and water in the same phases; the other is acquired with the protons of fat and water in opposite phases. Then, the signals from the two images can be added to eliminate the fat signals.
This technique is advantageous due to its insensitivity to field heteroge- neity and high adaptability to various sequences.14 However, it may result in the shift of the fat and water peaks, and suppresses the unwanted com- ponent.14 Several modifications have been made to the original two- point Dixon method in the name of multi-point or modified Dixon (mDixon) technique. The mDixon technique is more robust to field het- erogeneity, and it can also increase SNR, as well as spatial resolution, which is higher than two-point Dixon technique (Fig. 2B).14 Another ad- vantage of mDixon technique is that it can provide objective quantifica- tion of fat and water fraction in the targeted structure.15 Using this prop- erty, Kaichi et al.15 calculated water fraction in the orbital fat. The authors found that the water fraction in patients with thyroid-associated orbi- topathy was significantly correlated with clinical activity score of the dis- ease and treatment response.
DIFFUSION-WEIGHTED IMAGING
Diffusion-weighted imaging (DWI) can measure the differences in tissue microstructure based on the random displacement of water mole- cules.13 The differences in free water mobility can be quantified using the value of apparent diffusion coefficient (ADC).2 The ADC value is in- versely correlated with tissue cellularity; the restricted diffusion presents
Fig. 3. A 40-year-old male with acute ischemic optic neuropathy. (A) Left optic nerve is swollen with T2-high signal change (arrows). (B) Note the prominent perioptic enhancement (arrows) and exophthalmos with retrobulbar fat infiltration and preseptal soft-tissue swelling, suggesting combined orbital cellulitis. (C, D) Left optic nerve shows definite diffusion-restriction with high signal intensity on diffusion-weighted image and low apparent diffusion coefficient value (arrows).
A B C D
with low ADC.15 Using this property, DWI can provide information re- garding the characterization of biologic tissue. General application of DWI has been on the evaluation of stroke – in particular, acute infarc- tion with cytotoxic edema showing diffusion restriction.1
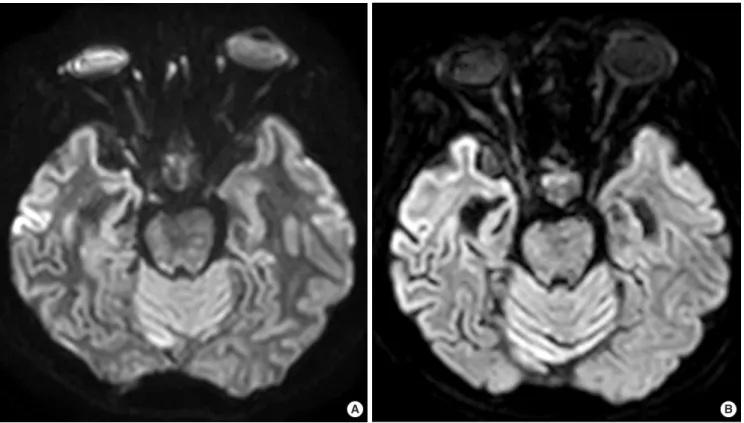
Ischemic optic neuropathy can show restricted diffusion with low ADC in the optic nerve (Fig. 3). DWI can help the detection of optic nerve infarction in acute stage, even with normal conventional MRI findings.1,16 DWI also can detect acute stage of optic neuritis in demyelin- ating diseases, such as multiple sclerosis (Fig. 4). Both acute and chronic optic neuritis can show T2-hyperintense signal, but acute optic neuritis
can reveal diffusion-restriction, unlike chronic stage optic neuritis.17 Acute attack of optic neuritis in multiple sclerosis can also show diffusion restrictions, even without the presence of contrast-enhancement.18
In clinical practice, DWI is usually obtained using a single-shot echo planar imaging (EPI) sequence.13 However, orbital regions have substan- tial magnetic field inhomogeneity due to bone/soft-tissue interfaces and air-containing structures, resulting in significant susceptibility artifact.1 One way to reduce this artifact is through the use of parallel imaging technique.19 In parallel imaging, the number of phase-encoding steps is reduced by the magnitude of a reduction factor, which refers to a ratio of
Fig. 4. A 56-year-old female diagnosed with multiple sclerosis. (A) Bilateral optic nerves present high signal intensity on T2-weighted image (arrows), suggesting optic neuritis. (B, C) Bilateral optic nerves demonstrate diffusion-restriction on diffusion-weighted image with accordant low apparent diffusion coefficient value (arrows).
A B C
A B
Fig. 5. Comparison between (A) single-shot and (B) multi-shot echo-planar imaging-based diffusion-weighted images. The geometric distortion of the optic nerve is much less on multi-shot diffusion-weighted image than on single-shot diffusion-weighted image.
the original to the reduced phase-encoding steps; for instance, a reduc- tion factor of 2 indicates 1/2 phase encoding steps compared with the original.19 The images are then reconstructed using a certain method to overcome the under-sampled signals. Increasing the reduction factor minimizes the errors associated with image distortion.
Recently, new multi-shot EPI sequence has been developed. The multi-shot EPI-based DWI obtains only a subset of k-space samples for each excitation to build an image.13,20,21 This can be performed with mul- tiple segmented readouts or multiple interleaved acquisitions of the echos. This method can reduce the phase errors and bandwidth-related EPI artifacts. Therefore, multi-shot EPI-based DWI has less susceptibili- ty artifacts and less geometric distortion or T2*-blurring, resulting in more homogeneous images in the orbital regions (Fig. 5). Accordingly, Lu et al.22 suggested that coronal multi-shot EPI-based DWI could offer high diagnostic performance for optic neuritis. Moreover, the use of small field-of-view DWI combined with multi-shot EPI-based DWI could improve image quality and diagnostic performance of optic neuri- tis.23 However, caution is warranted when using the absolute value of ADC derived from multi-shot EPI-based DWI to evaluate the disease, because the ADC values from multi-shot EPI-based DWI can differ from the single-shot EPI-based DWI.19
DIFFUSION TENSOR IMAGING AND FIBER TRACTOGRAPHY
Similar to DWI, diffusion tensor imaging (DTI) can measure the wa- ter diffusion in accordance with the tissue microstructure.1 By utilizing the multi-directional motion-sensitizing gradients, DTI can capture the maximal directional diffusion of the white matter tracts in the brain.1,24 The water diffusion in the white matter tract can be quantified in the voxel-base.1,24 Fractional anisotropy (FA) value can show the orientation of water diffusion; with uni-directional or anisotropic water diffusion pattern, FA gets close to 1, which goes closer to 0 with isotropic diffu- sion.25,26 The magnitude of water diffusion can be measured using the mean diffusivity (MD) value.25,26 These values are used to assess the in- tegrity of axonal architecture in the nervous system.25,26 In addition, DTI can create fiber tractography (Fig. 6), with the visualization of the neural pathways.27 Fiber tractography also can offer information about the neu- ral structure via quantitative measurements, such as fiber density, i.e. the numbers of the fibers visualized in a certain tract.19,27
Several studies have utilized the DTI to assess the neuropathy affect- ing the optic pathways from the optic nerves to optic tracts and radia- tions. In general, the pathologic lesions show increased MD from higher water proportions, and decreased FA from degraded neural integri- ty.1,24,25 Accordingly, Li et al.28 measured the diffusivity and FA in patients with optic neuritis; they found that the affected optic nerves and optic ra- diations showed increased diffusivity and decreased FA compared with the healthy controls. With respect to the fiber tractography, Gajamange et al.29 demonstrated that patients with optic neuritis showed low fiber density of inferior fronto-occipital fasciculus. Salmela et al.30 demon- strated that, in pediatric patients, DTI and fiber tractography of the optic nerve could differentiate the tumor from the optic nerves.
HIGH-RESOLUTION CRANIAL NERVE IMAGING
The internuclear network in the brainstem, including the oculomotor, trochlear, and abducens nuclei, as well as the cranial nerves are responsi- ble for the eye movement.31 The oculomotor nerve (cranial nerve III) is divided into the superior and inferior divisions; the former innervates the superior rectus and levator palpebrae superior muscles, while the lat- Fig. 6. Example of the fiber tractography of the left optic radiation in a 42-year- old female patient with brain tumor.
ter innervates the medial rectus, inferior rectus and inferior oblique muscles. The superior oblique muscle is innervated by the trochlear nerve (cranial nerve IV), and the lateral rectus muscle is innervated by the abducens nerve (cranial nerve VI).
In assessing ocular motility disorders, high-resolution cranial nerve imaging is mandatory. To assess the structure of the cisternal segment of the cranial nerves, high-resolution heavily T2-WI is the most optimal option. The sharp contrast between the bright T2-signal intensity of the CSF and the dark T2-signal intensity of the nerve allows for a clear visu- alization of the nerve. According to the type of the vendor, the three-di- mensional (3D) high-resolution heavily T2-WI is provided with the name of T2-volume isotropic turbo spin-echo acquisition (VISTA), T2- constructive interference in steady state (CISS), or T2-fast imaging em- ploying steady-state acquisition (FIESTA). By adopting a slice thickness of 0.7 mm, the cisternal segments of oculomotor and abducens nerves can be clearly visualized (Fig. 7). Particularly for the trochlear nerve, which has the smallest diameter of the cisternal segment (0.35-0.96 mm), a more advanced high-resolution image is required. Choi et al.32 utilized the 3D balanced turbo field echo sequence (bTFE) to visualize the troch- lear nerve. In this study, the voxel was down-sized to 0.25×0.25×0.25 mm3. This protocol demonstrates the cisternal segment of the trochlear nerve (Fig. 8). Using high-resolution heavily T2-weighted images, we can
diagnose various disorders that affect the cranial nerves (Fig. 9).
The cranial nerves pass through the cavernous sinus after passing CSF-filled cisterns and become the cavernous segment. On post-con- trast T1-WI, normal cavernous segment of the nerve is not enhanced, whereas the normal cavernous sinus is prominently enhanced; thus, cor-
A B
Fig. 7. Cisternal segments (arrows) of the (A) oculomotor and (B) abducens nerves on high-resolution heavily T2-weighted image.
Fig. 8. Cisternal segments (arrows) of the trochlear nerve on high-resolution balanced turbo field echo sequence image.
Fig. 10. Cranial nerves passing cavernous sinus. Oculomotor nerves (white long arrows), trochlear nerves (white arrow heads), trigeminal nerves (white short arrows), and abducens nerves (black long arrows).
onal post-contrast T1-WI has its advantages with respect to the assess- ment of cavernous segment of the cranial nerves. The high-resolution technique can also be applicable in post-contrast T1-WI. With the use of 3D T1-turbo field echo sequence combined with fat suppression, we can increase the spatial resolution of the image with a voxel size of 0.5×0.5×
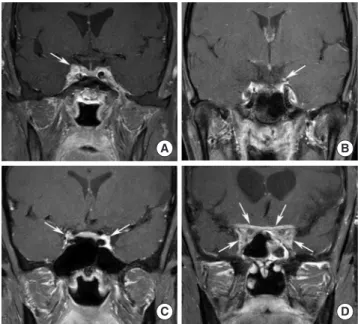
1 mm3. In this high-resolution image, we can effectively identify each cranial nerve that passes through the cavernous sinus (Fig. 10). If the cav- ernous segment of the cranial nerve has pathologies, such as inflamma- tion or tumor, the cavernous segment could be enhanced and allow for an effective diagnosis via the high-resolution coronal post-contrast T1- WI (Fig. 11).
FAST AND RADIAL IMAGING TECHNIQUES
To increase the spatial resolution while maintaining sufficient SNR in high-resolution image, long scan time is inevitable. However, long scan time can create motion artifact from patients, and increase the costs Fig. 9. Examples of congenital a-/hypo-plasia of the cranial nerve diagnosed by high-resolution image. (A) A 6-year-old female was diagnosed with hypoplasia of bi- lateral oculomotor nerves. The size of the nerve is small (arrows). (B) A 7-year-old male was diagnosed with aplasia of the left trochlear nerve. Left trochlear nerve is invisible on high-resolution image (arrows on the visible right trochlear nerve). (C) A 3-month-old male was diagnosed with right side Mobius syndrome (aplasia of ab- ducens and facial nerves) and left side Duane’s retraction syndrome (aplasia of abducens nerve). The affected nerves are not demonstrated on high-resolution image (arrows on the visible left facial nerve and bilateral cochleovestibular nerves).
A B C
Fig. 11. Examples of inflammatory disorders affecting cranial nerve diagnosed by high-resolution image. (A) A 55-year-old male was diagnosed with Tolosa- hunt syndrome. Right oculomotor nerve is abnormally enhanced in the cavern- ous sinus (arrow). (B) A 24-year-old female was diagnosed with ophthalmople- gic migraine. Left oculomotor nerve shows nodular enhancement (arrow). (C) A 35-year-old male was diagnosed with Miller-Fisher syndrome. Bilateral oculo- motor nerves are enhanced on post-contrast T1-weighted image (arrows). (D) An 83-year-old female was diagnosed with IgG4-related disease. Bilateral cav- ernous sinus is bulging (arrows) and the passing cranial nerves are enhanced abnormally. Note the abnormal dural enhancing thickening involved by the dis- ease (arrows).
A B
C D
while limiting the number of available patients. Therefore, many at- tempts have been made to accelerate MRI scanning without hampering image quality. One of the most recent and robust advancements in fast imaging is the compressed sense – or, compressed sensing (CS) – tech- nique.
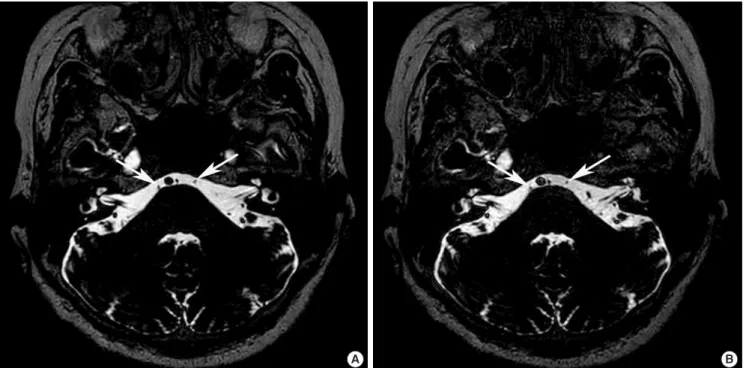
Like parallel imaging, the CS technique can reconstruct images from under-sampled data.33 However, CS does not use any complementary in- formation as in parallel imaging; instead, it uses incoherent under-sam- pling of the data, followed by a variety of algorithms, which can success- fully construct images with preserved diagnostic efficacy. It has been suggested that the CS technique can accelerate the scanning of the high- resolution heavily T2-WI, by as much as 80% with adequate diagnostic image quality.34 Using this method, the cisternal segment of the cranial nerve can effectively be visualized with reduced scan time (Fig. 12).
Another technique used to acquire non-uniform data in image for- mation is the radial imaging technique.35 Radial sampling refers to the non-uniform data acquisition in a non-rectangular matrix. Subsequent- ly, the data sampled in radial image do not have a unique frequency or phase-encoding direction, resulting in the diffuse distribution of the noise from motion across the entire image; this allows for a much less sensitivity to the motion artifact. Moreover, during radial sampling, the center of the image dataset tends to be oversampled. The oversampling
of the center can be used in the detection of motion and correction of it with equal distribution to the re-sampling center. In 2017, Sengupta et al.36 interestingly utilized the radial technique to the dynamic imaging of the orbital globe and extraocular muscles. Although the spatial and tem- poral resolution was not superb in this study, the authors opened the possibility for further improvement in the radial imaging technique and its applicability in ocular motor diseases.
CONCLUSION
MRI is an effective tool in evaluating the neuro-ophthalmologic con- ditions. For optic neuropathy and ocular motor disease, conventional MRIs, including T2-WI, FLAIR, and post-contrast T1-WI, may be use- ful, especially when they are combined with the fat suppression tech- nique. DWI and DTI can be helpful in the assessment of certain optic neuropathies. To properly diagnose ocular motor diseases, high-resolu- tion heavily T2-WI and post-contrast T1-WI are important for the status of relevant cranial nerves. The recently introduced fast and radial image techniques can enhance the high-resolution imaging. Thus, it is impor- tant not only for neuro-radiologists, but also for practicing physicians to remain up-to-date on both the conventional and advanced MRI tech- niques to allow precise interpretation of imaging findings. This will lead
A B
Fig. 12. Comparison of (A) standard and (B) fast compressed sensing imaging of high-resolution heavily T2-weighted image. Bilateral abducens nerves (arrows) are equally well visualized on standard and fast compressed sensing images.
to improved diagnostic performance and understanding with respect to the pathophysiology of the neuro-ophthalmologic disorders.
REFERENCES
1. Garcia-Carpintero ASM, Petcharunpaisan S, Ramalho JPRSNP, Castillo M. Advances in pediatric orbital magnetic resonance imaging. Expert Rev Ophthalmol 2010;5:483-500.
2. Pula JH, Daily J, DeSanto J. Radiology update in neuro-ophthalmology.
Curr Opin Ophthalmol 2011;22:451-457.
3. Moseley I. Imaging in neuro-ophthalmology. Curr Opin Neurol Neuro- surg 1991;4:829-832.
4. Kruger JM, Cestari DM, Cunnane MB. Systematic approaches for review- ing neuro-imaging scans in ophthalmology. Digit J Ophthalmol 2017;23:
50-59.
5. Lee AG, Johnson MC, Policeni BA, Smoker WR. Imaging for neuro‐oph- thalmic and orbital disease–a review. Clin Exp Ophthalmo 2009;37:30-53.
6. Azad R, Tayal M, Azad S, Sharma G, Srivastava RK. Qualitative and quantitative comparison of contrast-enhanced fluid-attenuated inversion recovery, magnetization transfer spin echo, and fat-saturation T1-weight- ed sequences in infectious meningitis. Korean J Radiol 2017;18:973-982.
7. Pino-Lopez L, Wenz H, Böhme J, Maros M, Schlichtenbrede F, Groden C, et al. Contrast-enhanced fat-suppressed FLAIR for the characterization of leptomeningeal inflammation in optic neuritis. Mult Scler 2018:13524 58518770268. doi: 10.1177/1352458518770268. [Epub ahead of print].
8. Lee EK, Lee EJ, Kim S, Lee YS. Importance of contrast-enhanced fluid- attenuated inversion recovery magnetic resonance imaging in various in- tracranial pathologic conditions. Korean J Radiol 2016;17:127-141.
9. Bleicher A, Kanal E. A serial dilution study of gadolinium-based MR im- aging contrast agents. AJNR Am J Neuroradiol 2008;29:668-673.
10. Boegel KH, Tyan AE, Iyer VR, Rykken JB, McKinney AM. Utility of cor- onal contrast-enhanced fat-suppressed FLAIR in the evaluation of optic neuropathy and atrophy. Eur J Radiol Open 2017;4:13-18.
11. Li L, Huang H, Chen Z. Early diagnosis of recurrent optic neuritis using contrast-enhanced T2 fluid-attenuated inversion recovery imaging: a case report. Chin Med Sci J 2018;33:130-134.
12. Delfaut EM, Beltran J, Johnson G, Rousseau J, Marchandise X, Cotten A.
Fat suppression in MR imaging: techniques and pitfalls. Radiographics 1999;19:373-382.
13. Bae YJ, Choi BS, Jeong HK, Sunwoo L, Jung C, Kim JH. Diffusion-weight- ed imaging of the head and neck: influence of fat-suppression technique and multishot 2D navigated interleaved acquisitions. AJNR Am J Neuro- radiol 2018;39:145-150.
14. Del Grande F, Santini F, Herzka DA, Aro MR, Dean CW, Gold GE, et al.
Fat-suppression techniques for 3-T MR imaging of the musculoskeletal system. Radiographics 2014;34:217-233.
15. Kaichi Y, Tanitame K, Itakura H, Ohno H, Yoneda M, Takahashi Y, et al.
Orbital fat volumetry and water fraction measurements using T2- weighted FSE-IDEAL imaging in patients with thyroid-associated orbi- topathy. AJNR Am J Neuroradiol 2016;37:2123-2128.
16. Kapur R, Sepahdari A, Mafee M, Putterman AM, Aakalu V, Wendel LJ, et al. MR imaging of orbital inflammatory syndrome, orbital cellulitis, and orbital lymphoid lesions: the role of diffusion-weighted imaging.
AJNR Am J Neuroradiol 2009;30:64-70.
17. Fatima Z, Motosugi U, Muhi A, Hori M, Ishigame K, Araki T. Diffusion- weighted imaging in optic neuritis. Can Assoc Radiol J 2013;64:51-55.
18. Davoudi Y, Foroughipour M, Torabi R, Layegh P, Matin N, Shoeibi A.
Diffusion weighted imaging in acute attacks of multiple sclerosis. Iran J Radiol 2016;13:e21740. doi: 10.5812/iranjradiol.21740.
19. Bae YJ, Park JB, Kim JH, Choi BS, Jung C. Diffusion tensor tractography of the brainstem pyramidal tract: a study on the optimal reduction factor in parallel imaging. J Korean Soc Radiol 2016;75:113-120.
20. Zhao M, Liu Z, Sha Y, Wang S, Ye X, Pan Y, et al. Readout-segmented echo-planar imaging in the evaluation of sinonasal lesions: a comprehen- sive comparison of image quality in single-shot echo-planar imaging.
Magn Reson Imaging 2016;34:166-172.
21. Koyasu S, Iima M, Umeoka S, Morisawa N, Porter DA, Ito J, et al. The clinical utility of reduced-distortion readout-segmented echo-planar im- aging in the head and neck region: initial experience. Eur Radiol 2014;24:
3088-3096.
22. Lu P, Sha Y, Wan H, Wang F, Tian G. Role of coronal high-resolution dif- fusion-weighted imaging in acute optic neuritis: a comparison with axial orientation. Neuroradiology 2017;59:737-745.
23. Seeger A, Schulze M, Schuettauf F, Ernemann U, Hauser TK. Advanced diffusion-weighted imaging in patients with optic neuritis deficit - value of reduced field of view DWI and readout-segmented DWI. Neuroradiol J 2018;31:126-132.
24. Becker M, Masterson K, Delavelle J, Viallon M, Vargas MI, Becker CD.
Imaging of the optic nerve. Eur J Radiol 2010;74:299-313.
25. Basser PJ, Pierpaoli C. Microstructural and physiological features of tis- sues elucidated by quantitative-diffusion-tensor MRI. J Magn Reson 2011;
213:560-570.
26. Sykova E. Extrasynaptic volume transmission and diffusion parameters of the extracellular space. Neuroscience 2004;129:861-876.
27. Mori S, Van Zijl PC. Fiber tracking: principles and strategies–a technical review. NMR Biomed 2002;15:468-480.
28. Li M, Li J, He H, Wang Z, Lv B, Li W, et al. Directional diffusivity changes in the optic nerve and optic radiation in optic neuritis. Br J Radiol 2011;
84:304-314.
29. Gajamange S, Raffelt D, Dhollander T, Lui E, van der Walt A, Kilpatrick T, et al. Fibre-specific white matter changes in multiple sclerosis patients with optic neuritis. Neuroimage Clin 2018;17:60-68.
30. Salmela MB, Cauley KA, Nickerson JP, Koski CJ, Filippi CG. Magnetic resonance diffusion tensor imaging (MRDTI) and tractography in chil- dren with septo-optic dysplasia. Pediatr Radiol 2010;40:708-713.
31. Bae YJ, Kim JH, Choi BS, Jung C, Kim E. Brainstem pathways for hori- zontal eye movement: pathologic correlation with MR imaging. Radio- graphics 2013;33:47-59.
32. Choi BS, Kim JH, Jung C, Hwang JM. High-resolution 3D MR imaging of the trochlear nerve. AJNR Am J Neuroradiol 2010;31:1076-1079.
33. Jaspan ON, Fleysher R, Lipton ML. Compressed sensing MRI: a review of the clinical literature. Br J Radiol 2015;88:20150487. doi: 10.1259/bjr.
20150487.
34. Yuhasz M, Hoch MJ, Hagiwara M, Bruno MT, Babb JS, Raithel E, et al.
Accelerated internal auditory canal screening magnetic resonance imag- ing protocol with compressed sensing 3-dimensional T2-weighted se- quence. Invest Radiol 2018 Jul 16. doi: 10.1097/RLI.0000000000000499.
[Epub ahead of print].
35. Pipe JG. Motion correction with PROPELLER MRI: application to head motion and free‐breathing cardiac imaging. Magn Reson Med 1999;42:
963-969.
36. Sengupta S, Smith DS, Smith AK, Welch EB, Smith SA. Dynamic imag- ing of the eye, optic nerve, and extraocular muscles with golden angle ra- dial MRI. Invest Ophthalmol Vis Sci 2017;58:4390-4398.