INTRODUCTION
Patients with advanced-stage head and neck squamous
Diffusion-weighted Magnetic Resonance Imaging for
Predicting Response to Chemoradiation Therapy for Head and Neck Squamous Cell Carcinoma: A Systematic Review
Sae Rom Chung, MD
1, Young Jun Choi, MD, PhD
1, Chong Hyun Suh, MD
1, 2, Jeong Hyun Lee, MD, PhD
1, Jung Hwan Baek, MD, PhD
11Department of Radiology and Research Institute of Radiology, University of Ulsan College of Medicine, Asan Medical Center, Seoul, Korea;
2Department of Radiology, Namwon Medical Center, Namwon, Korea
Objective: To systematically review the evaluation of the diagnostic accuracy of pre-treatment apparent diffusion coefficient (ADC) and change in ADC during the intra- or post-treatment period, for the prediction of locoregional failure in patients with head and neck squamous cell carcinoma (HNSCC).
Materials and Methods: Ovid-MEDLINE and Embase databases were searched up to September 8, 2018, for studies on the use of diffusion-weighted magnetic resonance imaging for the prediction of locoregional treatment response in patients with HNSCC treated with chemoradiation or radiation therapy. Risk of bias was assessed by using the Quality Assessment Tool for Diagnostic Accuracy Studies-2.
Results: Twelve studies were included in the systematic review, and diagnostic accuracy assessment was performed using seven studies. High pre-treatment ADC showed inconsistent results with the tendency for locoregional failure, whereas all studies evaluating changes in ADC showed consistent results of a lower rise in ADC in patients with locoregional failure compared to those with locoregional control. The sensitivities and specificities of pre-treatment ADC and change in ADC for predicting locoregional failure were relatively high (range: 50–100% and 79–96%, 75–100% and 69–95%, respectively). Meta- analytic pooling was not performed due to the apparent heterogeneity in these values.
Conclusion: High pre-treatment ADC and low rise in early intra-treatment or post-treatment ADC with chemoradiation, could be indicators of locoregional failure in patients with HNSCC. However, as the studies are few, heterogeneous, and at high risk for bias, the sensitivity and specificity of these parameters for predicting the treatment response are yet to be determined.
Keywords: Head and neck; Squamous cell carcinoma; Cancer; DWI; Diffusion-weighted imaging; Apparent diffusion coefficient;
Prediction; Treatment response; Response assessment; Systematic review; Meta-analysis
Received July 16, 2018; accepted after revision November 11, 2018.
Corresponding author: Young Jun Choi, MD, PhD, Department of Radiology and Research Institute of Radiology, University of Ulsan College of Medicine, Asan Medical Center, 88 Olympic-ro 43-gil, Songpa-gu, Seoul 05505, Korea.
• Tel: (822) 3010-1702 • Fax: (822) 476-0090
• E-mail: [email protected]
This is an Open Access article distributed under the terms of the Creative Commons Attribution Non-Commercial License (https://creativecommons.org/licenses/by-nc/4.0) which permits unrestricted non-commercial use, distribution, and reproduction in any medium, provided the original work is properly cited.
cell carcinoma (HNSCC) are mainly treated with the non- surgical methods of concurrent chemoradiation therapy (CCRT) or radical radiotherapy to preserve organ function and maintain the quality of life (1, 2). Despite these rigorous treatment methods, treatment still fails at local or nodal sites in the head and neck in approximately 25–30%
of patients (3-8). A reliable indicator for pre-treatment diagnosis of resistant HNSCC in patients could allow the CCRT regimes to be modified, or indicate the need for a switch to alternative strategies, improving their chances of success, and sparing the patients from ineffective treatment burdened by unnecessary toxicity (9). In addition, intra- treatment scanning for the adaptation of radiotherapy fields to the changing size of the tumor is already under Korean J Radiol 2019;20(4):649-661
https://doi.org/10.3348/kjr.2018.0446
evaluation, providing an opportunity to monitor early treatment response and adjust CCRT regimes accordingly (1, 2, 10, 11). However, differentiation of residual cancer from post-treatment change using conventional magnetic resonance imaging (MRI), computed tomography (CT), 18-fluorodeoxyglucose positron emission tomography-CT (18F-FDG PET/CT) in the early post-treatment period is a dilemma. The morphological criteria of CT and MRI with regard to volume regression (12-16), change in signal intensity (17, 18), and nodal density (19, 20) have shown heterogeneous results in the prediction of treatment response. The image results from 18F-FDG PET/CT are also often suboptimal due to low spatial resolution and presence of treatment-induced inflammation during the first four months post CCRT that may be misleading (21). Endoscopy of primary sites could be hampered by radiation-induced mucositis. Biopsy of primary and nodal sites could be affected by sampling errors and may initiate superimposed infection, fail to heal, and cause worsening of complaints (22).
Diffusion-weighted imaging (DWI) is a functional MRI technique allowing the quantification of the diffusion of water molecules in a tumor by measuring the apparent diffusion coefficient (ADC). Recently, researchers have focused on DWI for predicting treatment response in patients with HNSCC, and it has been demonstrated that tumors with high ADC values are less likely to respond to chemoradiation (23-32). This is probably because a high ADC value may reflect the presence of micronecrosis, tumor hypoxia, high stromal content, and low cellularity (lower proliferation), which consequently increase the resistance to CCRT. In addition, the diagnostic accuracy of change in ADC values between the pre-treatment and early intra-treatment or post-treatment periods has been investigated for the prediction of treatment response, under the consideration that treatment with CCRT leads to cell death and reduction of restrictive barriers to diffusion, and therefore a
consequent increase in the mean ADC value (9, 28, 30, 33, 34). However, several conflicting results have been reported (9, 25, 34-39), and previous studies have been limited by small numbers of patients and overlapping patient data (22, 29-32, 34, 40). To the best of our knowledge, no systematic review has assessed the role of DWI in predicting locoregional failure according to pre-treatment ADC and change in ADC during early intra-treatment or post- treatment in patients with HNSCC. Therefore, we performed this systematic review to evaluate the sensitivity and specificity of pre-treatment ADC and change in ADC during
the early intra-treatment or post-treatment period, for the prediction of the locoregional response to definitive CCRT or radiation therapy in patients with HNSCC.
MATERIALS AND METHODS
Literature Search Strategy
A computerized search of the Ovid-MEDLINE and Embase databases was performed to identify relevant original articles on the use of DWI for the prediction of locoregional treatment response in patients with HNSCC treated with definitive CCRT or radiation therapy, up until September 8, 2018. The following search terms were used: [(“head and neck”) OR (oropharyngeal) OR (tongue) OR (oral cavity) OR (oropharynx) OR (hypopharyngeal) OR (hypopharynx) OR (larynx) OR (laryngeal) OR (pharynx) OR (pharyngeal)] AND [(carcinoma) OR (carcinomas) OR (cancer) OR (cancers)]
AND [(chemoradiation) OR (chemoradiotherapy) OR (radiotherapy) OR (radiation therapy)] AND [(“diffusion weighted”) OR (“diffusion-weighted”) OR (dw-mri) OR (DWI) OR (“apparent diffusion coefficient”) OR (ADC)].
Only studies published in English were included. The bibliographies of the selected articles were screened to identify other relevant articles.
Inclusion Criteria
Studies investigating the use of DWI for the prediction of locoregional treatment response in HNSCC were eligible for inclusion.
Studies or subsets of studies satisfying all of the following criteria were included:
1) Population: patients with histologically proven HNSCC who underwent definitive CCRT or radiation therapy.
2) Index test: imaging with MRI including DWI with provision of pre-treatment ADC value or change in the pre- treatment and early intra-treatment or post-treatment ADC values.
3) Reference standard: the reference standards of the treatment outcome as determined by histologic confirmation or clinical/imaging follow-up, or a combination of these.
4) Outcomes: results of locoregional failure after definitive CCRT or radiation therapy, reported in sufficient detail.
5) Study design: all observational studies (retrospective or prospective).
Exclusion Criteria
The exclusion criteria were as follows: 1) case reports, review articles, editorials, letters, comments, and conference proceedings; 2) studies with insufficient data on the locoregional failure and locoregional control; 3) studies that did not provide ADC values; 4) studies that monitored the intra-treatment response during CCRT; and 5) studies with overlapping patients and data. Two reviewers independently selected appropriate study reports using a standardized form.
Data Extraction
One reviewer extracted data from the studies with the second reviewer double-checking the accuracy of the extracted data and resolving any uncertainty through discussion. The following data were extracted from each of the selected studies onto standardized data forms:
1) Study characteristics: authors, year of publication, hospital or medical school, years of patient recruitment, sample size, and study design.
2) Demographic and clinical characteristics of patients:
mean age, nodule size, and patient reference standards.
3) Imaging characteristics: timing of imaging, machine manufacturer and model, magnetic field strength, sequence, slice thickness, gap, and total acquisition time for DWI.
4) Interpretation: number of reviewers, experience, presence of consensus data.
5) True positives and negatives and false positives and negatives for the prediction of treatment response according to ADC value. In cases of incomplete 2 x 2 tables, the corresponding author was contacted, and data required to generate 2 x 2 tables was requested.
Quality Assessment
The methodological quality of the included studies was assessed independently by two reviewers using tailored questionnaires devised according to the Quality Assessment of Diagnostic Accuracy Studies-2 (QUADAS-2) criteria (41). Disagreements were very minor and were resolved by consensus.
Data Analysis
For the diagnostic accuracy assessment, 2 x 2 data were summarized in forest plots of sensitivity and specificity for each study. Pooling was not performed because of the relatively small number of studies, relatively high risk of bias, and inherent heterogeneity based on varying study
designs among the included studies. The presence of a threshold effect was visually assessed using coupled forest plots of sensitivity and specificity. The Spearman correlation coefficient between the sensitivity and false-positive rate was obtained; a value > 0.6 was deemed a considerable threshold effect (42).
RESULTS
Literature Search
The study selection process is illustrated in Figure 1.
Twelve studies were included in the systematic review and seven of these presented data that could be extracted to a 2 x 2 table format to calculate sensitivity and specificity.
The seven studies included four investigating the diagnostic accuracy of pre-treatment ADC (25, 26, 28, 30) for predicting the locoregional treatment response, and four investigating the diagnostic accuracy of change in ADC (9, 25, 33, 34).
Characteristics of the Included Studies
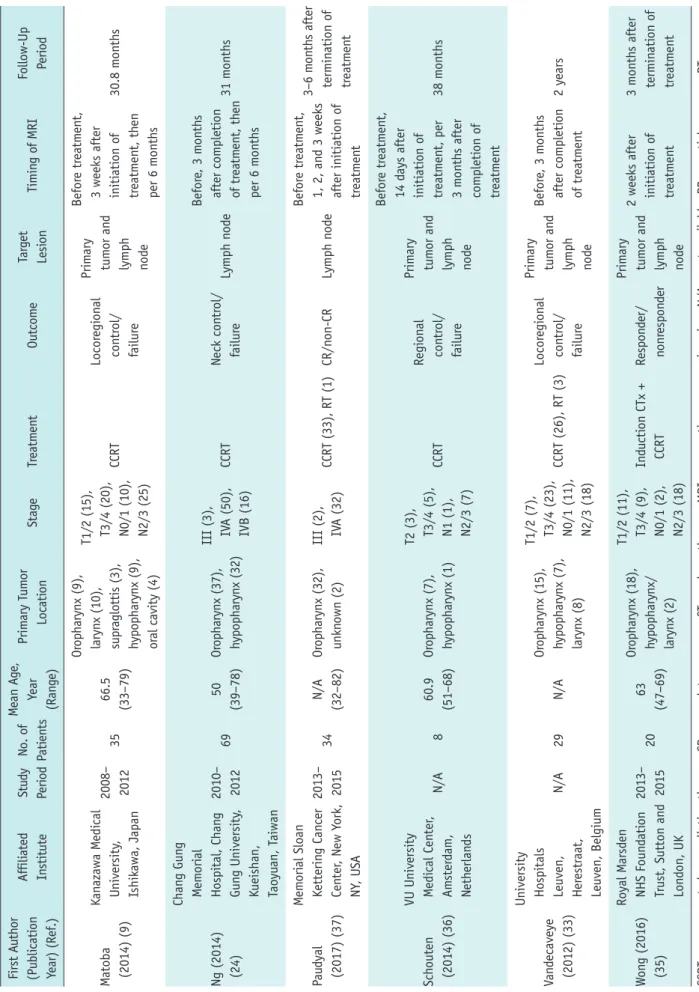
The characteristics of the 12 included studies are listed in Table 1. The 12 original articles included ten prospective studies (9, 24, 25, 30, 33-38), one retrospective study (26), and one study with an unclear design (28). The target lesions of the studies were primary tumors (n = 3) (26, 30, 34), lymph nodes (n = 4) (24, 25, 28, 37), or both (n = 5) (9, 33, 35, 36, 38). Eleven studies investigated the value of pre-treatment ADC (9, 24-26, 28, 30, 34-38) for predicting locoregional treatment response, and ten studies investigated the value of change in ADC (9, 25, 28, 30, 33-38). All studies had a clear description of the reference standard for determining the treatment outcome, and detailed descriptions of the proportion of patients with locoregional failures and locoregional control. Among the total population of 418 patients, locoregional failure occurred in 136 patients (32.5%) and locoregional control was achieved in 282 patients (67.5%) (analysis per-patient).
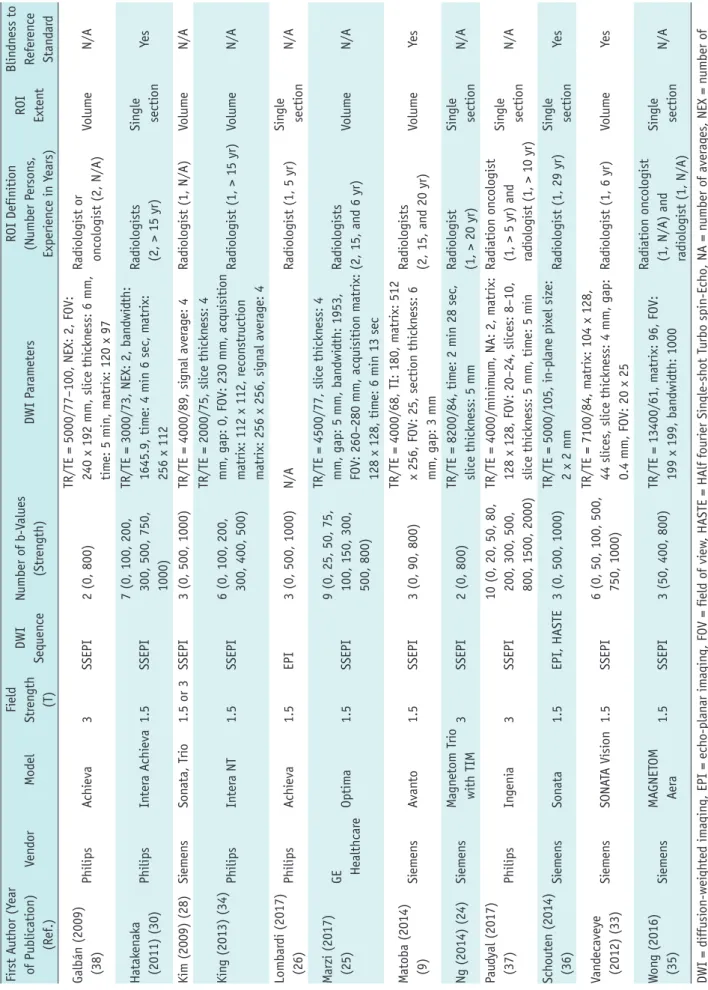
All studies included pre-treatment MRI including DWI, and ten studies performed MRI at early intra-treatment or post- treatment periods, to evaluate the change in ADC value (9, 25, 28, 30, 33-38). The detailed technical characteristics of the MRI acquisitions are listed in Table 2. All of the DWI images were acquired in the axial plane using spin-echo echo-planar imaging sequences. The number of b-values used for the DWI ranged from one to ten, with majority of the studies using b-values between one and six (9, 24-26, 28, 30, 33-38). The regions of interest (ROIs) were outlined
by experienced radiologists or oncologists, and were defined on either a single slice of the target lesion (24, 26, 30, 35- 37), or on every section of all targeted lesions (9, 25, 28, 34, 38, 43).
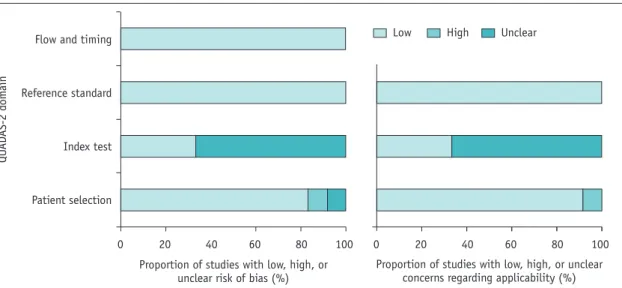
Quality Assessment
Overall, the quality of the studies was considered moderate, with 9 of the 12 studies satisfying at least 5 of the 7 QUADAS-2 domains (Fig. 2). Notable areas of quality concerns included no mention of blinding to the clinical outcomes of patients during ROI placement (24-26, 28, 34, 35, 37, 38). Regarding the patient selection domain, one study was considered to have a high risk of bias due to a non-consecutive case/control study design (26). In addition, one study was considered to have an unclear risk of bias as it did not explicitly mention whether patient enrollment was prospective or not (28). Only one study had a concern for applicability, which was because majority of the included patients were tested positive for human papillomavirus (HPV) (37). With regard to the reference standard and flow and timing domain, all studies were considered to have a low risk of bias.
Pre-treatment ADC Value for Predicting Locoregional Treatment Response of HNSCC
Eleven studies investigated the value of pre-treatment ADC for predicting locoregional treatment response in patients with HNSCC (9, 24-26, 28, 30, 34-38). Of these 11 studies, 5 found that pre-treatment ADC values were significantly associated with locoregional treatment response (24-26, 28, 30); in all 5 of these studies, pre-treatment ADC values were significantly higher in patients with locoregional failure than in those with locoregional control. A cut-off ADC value ranging from 0.86 to 1.2 was mentioned in 4 studies (25, 26, 28, 30). In the other 6 studies that did not show a significant difference in ADC between the 2 groups, 2 studies showed lower values of pre-treatment ADC in locoregional control (9, 34), whereas in 3 studies, the pre-treatment ADC value was higher in the locoregional control (36-38). In 1 study, locoregional control showed higher ADC values than locoregional failure in primary tumors, but showed lower ADC values in lymph nodes (35).
The diagnostic accuracy of pre-treatment ADC values for predicting locoregional failure was assessed in 4 studies (25, 26, 28, 30). Figure 3 is a forest plot of sensitivity and Fig. 1. Flow diagram of study selection process. ADC = apparent diffusion coefficient
IdentificationScreeningEligibilityIncluded
Records identified through databases searching (n = 349):
Ovid-MEDLINE (n = 110), EMBASE (n = 239)
Records after duplicates removed (n = 206)
Records screened (n = 206)
Full-text articles assessed for eligibility (n = 35)
Studies included in qualitative synthesis (n = 12)
Studies included in quantitative synthesis (n = 7) Pre ADC (4) Mean ADC change (4) Both (1)
Records excluded (n = 23) Not in field of interest (11)
Partially overlapping patient cohorts (8) Inappropriate outcome (4)
Records excluded (n = 171) Not in field of interest (61) Conference abstracts/paper (77) Review articles (27)
Case report (2)
Comments/editorial letter (3) Note (1)
Table 1. Characteristics of Included Studies First Author (Publication Year) (Ref.)Affiliated InstituteStudy PeriodNo. of PatientsMean Age, Year (Range)Primary Tumor LocationStageTreatmentOutcomeTarget LesionTiming of MRIFollow-Up Period Galbán (2009) (38)
University of Michigan Medical School, Ann Arbor, MI, USAN/A15N/AOr
opharynx (12), nasopharynx (1), hypopharynx (1), unkn
own (1)
T1/2 (9), T3/4 (5), Tx (1), N0/1 (1), N2/3 (14)
CCRTCR/PRPrimary tumor and
lymph node
1 week before treatment, 3
weeks after initi
ation of treatment
6 months after initiation of treatment Hatakenaka (2011) (30)Kyushu University
Hospital, Fuku
oka, Japan
2006– 2008
1764 (37–85)
Oropharynx (7), hypopharynx (8), larynx (1), oral cavity (1)
T1/2 (7), T3/4 (10), N0/1 (5), N2/3 (12)
CCRT (13), RT (4)Local control/ failurePrimary tumor
8 days before treatment, 1 week after initiation of treatment
Local failure (4.6 months), local control (23.6 months)
2006– 2009
4064 (37–85)
Oropharynx (15), hypopharynx (19), larynx (4), oral cavity (2)
T1/2 (21), T3/4 (19), N0/1 (14), N2/3 (26)
CCRT (35), RT (5)Local control/ failurePrimary tumor
Local failure (4.9 months), local control (16.4 months) Kim (2009) (28)
University of Pennsylvania, Philadelphia, PA, USA
2005– 2007
3361 (N/A)Or
opharynx (21), larynx (7), unkn
own (5)
T0 (1), T1/2 (10), T3/4 (15), Tx (7), N0/1 (2), N2/3 (31)
CCRT (26), RT + immunotherapy (7)CR/PRLymph node
Before treatment,
1 week after initi
ation of treatment, 2
weeks after completi
on of treatment
2 weeks after termination of treatment King (2013) (34)
Hong Kong Cancer Institute and Prince of Wales
Hospital, Shatin, Hon
g Kong SAR, China
2004– 2008
3757 (45–71)
Oral cavity or oropharynx (14),
nasal cavity (2), hypopharynx or larynx (20), maxillary sinus (1)
T1/2 (9), T3/4 (28)CCRT (33), RT (4)Local control/ failurePrimary tumor
Before treatment,
2 weeks after initi
ation of treatment, 6, 12, 18, 24 months after completion of treatment
Local failure (3.8 months), local control (43.9 months) Lombardi (2017) (26)
Maggiore della Carita University
Hospital, University o
f Eastern Piedmont, Corso Mazzini, Novara, Italy
2010– 2014
4759 (N/A)Nasopharynx (23), oropharynx (19), hypopharynx (5)
T1/2 (14), T3/4 (33), N0/1 (21), N2/3 (26)
CCRT (39), neoadjuvant CTx + RT (8)
Local control/
disease recurr
ence or persistence
Primary tumorBefore treatment
Disease recurrence or persistence (3–20 months), local control (10–36 months) Marzi (2017) (25)
Regina Elena National Cancer Institute, Via Elio Chianesi, Rome, Italy
2010– 2013
3454.5 (28–79)
Oropharynx (14), nasopharynx (13), hypopharynx or larynx (6), unkn
own (1)
T0/1/2 (21), T3/4 (13), N1/2 (29), N3 (5)
CCRTRegional control/ failureLymph node
Before treatment, 16–17 days after initiation of treatment, immediately and
8 weeks after completi
on of treatment, per 6 months for 2 years, then annually
Regional failure (6.8 months), regional control (27.6 months)
Table 1. Characteristics of Included Studies (continued) First Author (Publication Year) (Ref.)
Affiliated InstituteStudy PeriodNo. of Patients
Mean Age, Year (Range)
Primary Tumor LocationStageTreatmentOutcomeTarget LesionTiming of MRIFollow-Up Period Matoba (2014) (9)
Kanazawa Medical University, Ishikawa, Japan
2008– 20123566.5 (33–79)
Oropharynx (9), larynx (10), supraglottis (3), hypopharynx (9), oral cavity (4)
T1/2 (15), T3/4 (20), N0/1 (10), N2/3 (25)
CCRTLocoregional control/ failure
Primary tumor and lymph node
Before treatment, 3 weeks after initiation of treatment, then per 6 months
30.8 months Ng (2014) (24)
Chang Gung Memorial Hospital, Chang Gung University, Kueishan, Taoyuan, Taiwan
2010– 20126950 (39–78)Oropharynx (37), hypopharynx (32)
III (3), IVA (50), IVB (16)CCRTNeck control/ failureLymph node
Before, 3 months after completion of treatment, then per 6 months
31 months Paudyal (2017) (37)
Memorial Sloan Kettering Cancer Center, New York, NY, USA
2013– 201534N/A (32–82)Oropharynx (32), unknown (2)III (2), IVA (32)CCRT (33), RT (1)CR/non-CRLymph node
Before treatment, 1, 2, and 3 weeks after initiation of treatment
3–6 months after termination of treatment Schouten (2014) (36)
VU University Medical Center, Amsterdam, Netherlands
N/A860.9 (51–68)Oropharynx (7), hypopharynx (1)
T2 (3), T3/4 (5), N1 (1), N2/3 (7)
CCRTRegional control/ failure
Primary tumor and lymph node
Before treatment, 14 days after initiation of treatment, per 3 months after completion of treatment
38 months Vandecaveye (2012) (33)
University Hospitals Leuven, Herestraat, Leuven, Belgium
N/A29N/AOropharynx (15), hypopharynx (7), larynx (8)
T1/2 (7), T3/4 (23), N0/1 (11), N2/3 (18)
CCRT (26), RT (3)Locoregional control/ failure
Primary tumor and lymph node
Before, 3 months after completion of treatment2 years Wong (2016) (35)
Royal Marsden NHS Foundation Trust, Sutton and London, UK
2013– 20152063 (47–69)
Oropharynx (18), hypopharynx/ larynx (2)
T1/2 (11), T3/4 (9), N0/1 (2), N2/3 (18)
Induction CTx + CCRTResponder/ nonresponder
Primary tumor and lymph node
2 weeks after initiation of treatment
3 months after termination of treatment CCRT = concurrent chemoradiation therapy, CR = complete response, CTx = chemotherapy, MRI = magnetic resonance imaging, N/A = not available, PR = partial response, RT = radiation therapy
Table 2. Technical Characteristics of Included Studies First Author (Year of Publication) (Ref.)VendorModelField Strength (T)
DWI SequenceNumber of b-Values (Strength)DWI Parameters ROI Definition (Number Persons, Experience in Years)
ROI Extent
Blindness to Reference Standard Galbán (2009) (38)PhilipsAchieva3SSEPI2 (0, 800)TR/TE = 5000/77–100, NEX: 2, FOV: 240 x 192 mm, slice thickness: 6 mm, time: 5 min, matrix: 120 x 97
Radiologist or oncologist (2, N/A)VolumeN/A Hatakenaka (2011) (30)PhilipsIntera Achieva1.5SSEPI7 (0, 100, 200, 300, 500, 750, 1000)
TR/TE = 3000/73, NEX: 2, bandwidth: 1645.9, time: 4 min 6 sec, matrix: 256 x 112
Radiologists (2, > 15 yr)Single sectionYes Kim (2009) (28)SiemensSonata, Trio1.5 or 3 SSEPI3 (0, 500, 1000)TR/TE = 4000/89, signal average: 4Radiologist (1, N/A)VolumeN/A King (2013) (34) PhilipsIntera NT1.5SSEPI6 (0, 100, 200, 300, 400, 500)
TR/TE = 2000/75, slice thickness: 4 mm, gap: 0, FOV: 230 mm, acquisition matrix: 112 x 112, reconstruction matrix: 256 x 256, signal average: 4
Radiologist (1, > 15 yr)VolumeN/A Lombardi (2017) (26)PhilipsAchieva1.5EPI3 (0, 500, 1000)N/ARadiologist (1, 5 yr)Single sectionN/A Marzi (2017) (25)GE HealthcareOptima1.5SSEPI9 (0, 25, 50, 75, 100, 150, 300, 500, 800)
TR/TE = 4500/77, slice thickness: 4 mm, gap: 5 mm, bandwidth: 1953, FOV: 260–280 mm, acquisition matrix: 128 x 128, time: 6 min 13 sec
Radiologists (2, 15, and 6 yr)VolumeN/A Matoba (2014) (9)SiemensAvanto1.5SSEPI3 (0, 90, 800)TR/TE = 4000/68, TI: 180, matrix: 512 x 256, FOV: 25, section thickness: 6 mm, gap: 3 mm
Radiologists (2, 15, and 20 yr)VolumeYes Ng (2014) (24)SiemensMagnetom Trio with TIM3SSEPI2 (0, 800)TR/TE = 8200/84, time: 2 min 28 sec, slice thickness: 5 mmRadiologist (1, > 20 yr)Single sectionN/A Paudyal (2017) (37)PhilipsIngenia3SSEPI10 (0, 20, 50, 80, 200, 300, 500, 800, 1500, 2000)
TR/TE = 4000/minimum, NA: 2, matrix: 128 x 128, FOV: 20–24, slices: 8–10, slice thickness: 5 mm, time: 5 min
Radiation oncologist (1, > 5 yr) and radiologist (1, > 10 yr)
Single sectionN/A Schouten (2014) (36)SiemensSonata1.5EPI, HASTE3 (0, 500, 1000)TR/TE = 5000/105, in-plane pixel size: 2 x 2 mmRadiologist (1, 29 yr)Single sectionYes Vandecaveye (2012) (33)SiemensSONATA Vision1.5SSEPI6 (0, 50, 100, 500, 750, 1000)
TR/TE = 7100/84, matrix: 104 x 128, 44 slices, slice thickness: 4 mm, gap: 0.4 mm, FOV: 20 x 25Radiologist (1, 6 yr)VolumeYes Wong (2016) (35)SiemensMAGNETOM Aera1.5SSEPI3 (50, 400, 800)TR/TE = 13400/61, matrix: 96, FOV: 199 x 199, bandwidth: 1000
Radiation oncologist (1, N/A) and radiologist (1, N/A)
Single sectionN/A DWI = diffusion-weighted imaging, EPI = echo-planar imaging, FOV = field of view, HASTE = HAlf fourier Single-shot Turbo spin-Echo, NA = number of averages, NEX = number of excitations, ROI = region of interest, SSEPI = single-shot spin-echo EPI, T = tesla, TE = echo time, TI = inversion time, TR = repetition time
specificity for the 4 included studies. The coupled forest plots of the sensitivity and specificity for the pre-treatment ADC did not reveal any apparent threshold effect and the Spearman correlation coefficient between sensitivity and false-positive rate was -0.519 (95% confidence interval [CI], -0.961–0.670). Meta-analytic pooling of the sensitivity and specificity values was not performed due to the apparent heterogeneity in these values that were unexplainable with threshold effect, and infeasibility of robust analysis of the causes of heterogeneity. The total population comprised of 171 patients, with 52 patients (30.4%) having locoregional failure. The sensitivities and specificities of the 4 individual
studies ranged from 50% to 100% and from 79% to 96%, respectively (Table 3).
Change in ADC Value for Predicting Locoregional Failure of HNSCC
Ten studies investigated the value of change in ADC for predicting locoregional treatment response in HNSCC (9, 25, 28, 30, 33-38). In all 10 studies, the change in ADC was larger in the patients with locoregional control than in those with locoregional failure, and 5 studies showed a statistically significant difference (9, 28, 30, 33, 34).
The cut-off value for change in ADC was mentioned in 4 Fig. 2. QUADAS-2 criteria for included studies. QUADAS-2 = Quality Assessment of Diagnostic Accuracy Studies-2
Flow and timing
Reference standard
Index test
Patient selection
QUADAS-2 domain
0 20 40 60 80 100 0 20 40 60 80 100 Proportion of studies with low, high, or
unclear risk of bias (%) Proportion of studies with low, high, or unclear concerns regarding applicability (%)
High Unclear Low
Fig. 3. Forest plots of sensitivity and specificity of pre-treatment ADC for prediction of locoregional recurrence. Horizontal lines indicate 95% CIs of individual studies. CI = confidence interval, Ref = reference
Study (Ref)
Lombardi et al., 2017 (26)
Marzi et al., 2017 (25)
Kim et al., 2009 (28)
Hatakenaka et al., 2011 (30) (validation set) Hatakenaka et al., 2011 (30) (prospective group)
Sensitivity (95% CI)
0.50 (0.23–0.77)
0.70 (0.35–0.93)
0.71 (0.29–0.96)
0.92 (0.64–1.00)
1.00 (0.63–1.00)
0.2 1.0 Sensitivity
Study (Ref)
Lombardi et al., 2017 (26)
Marzi et al., 2017 (25)
Kim et al., 2009 (28)
Hatakenaka et al., 2011 (30) (validation set) Hatakenaka et al., 2011 (30) (prospective group)
Specificity (95% CI)
0.85 (0.68–0.95)
0.79 (0.58–0.93)
0.85 (0.65–0.96)
0.96 (0.81–1.00)
0.89 (0.52–1.00)
0.5 1.0 Specificity
studies, and ranged from 15.5% to 25% (9, 25, 33, 34). The time over which the change in ADC was measured ranged from one to three weeks from the start of CCRT, except for one study where the ADC was measured three weeks after completion of CCRT (33). The diagnostic accuracy of the change in ADC for predicting locoregional failure was assessed using 4 studies (9, 25, 33, 34). The coupled forest plots of sensitivity and specificity for the change in ADC did not reveal any apparent threshold effect and the Spearman correlation coefficient between sensitivity and false-positive rate was -0.829 (95% CI, -0.996–0.650). (Fig. 4). Meta- analytic pooling of the sensitivity and specificity values was not performed for the same reasons as those mentioned above. The total population comprised of 135 patients, with locoregional failure in 43 (31.9%). The sensitivities and specificities of the 4 individual studies ranged from 75% to 100% and from 69% to 95%, respectively (Table 4).
DISCUSSION
In the current systematic review, we demonstrated that high pre-treatment ADC and a low rise in ADC during the early intra-treatment or post-treatment periods of CCRT were indicators of locoregional failure in patients with HNSCC.
Considering the consistency in the results of change in ADC obtained, we propose that it could be a promising approach to predict treatment response after CCRT.
In clinical practice, an accurate prediction of disease progression after treatment could be extremely useful for selecting the appropriate adjuvant treatment and improving the patient’s prognosis (9). Cases of HNSCCs with high stromal content, low cellularity, and micronecrosis are associated with resistance to treatment and poor outcome (44). These tumor characteristics decrease diffusion of water molecules (45-47), and therefore it is Fig. 4. Forest plots of sensitivity and specificity of change in ADC for prediction of locoregional recurrence. Horizontal lines indicate 95% CIs of individual studies.
Study (Ref)
King et al., 2013 (34)
Marzi et al., 2017 (25)
Matoba et al., 2014 (9) Vandecaveye et al.,
2012 (33)
Study (Ref)
King et al., 2013 (34)
Marzi et al., 2017 (25)
Matoba et al., 2014 (9) Vandecaveye et al.,
2012 (33) Sensitivity (95% CI)
0.77 (0.46–0.95)
0.75 (0.35–0.97)
1.00 (0.77–1.00)
1.00 (0.63–1.00)
Specificity (95% CI)
0.71 (0.44–0.90)
0.70 (0.46–0.88)
0.81 (0.58–0.95)
0.95 (0.77–1.00)
0.3 1.0 0.4 1.0
Sensitivity Specificity
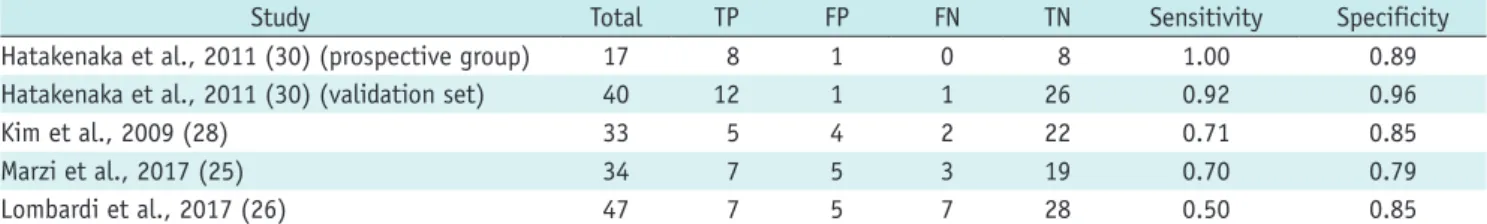
Table 3. Summary of Diagnostic Accuracy of Pre-Treatment ADC Value in Predicting Locoregional Failure in HNSCC
Study Total TP FP FN TN Sensitivity Specificity
Hatakenaka et al., 2011 (30) (prospective group) 17 8 1 0 8 1.00 0.89
Hatakenaka et al., 2011 (30) (validation set) 40 12 1 1 26 0.92 0.96
Kim et al., 2009 (28) 33 5 4 2 22 0.71 0.85
Marzi et al., 2017 (25) 34 7 5 3 19 0.70 0.79
Lombardi et al., 2017 (26) 47 7 5 7 28 0.50 0.85
ADC = apparent diffusion coefficient, FN = false negative, FP = false positive, HNSCC = head and neck squamous cell carcinoma, TN = true negative, TP = true positive
Table 4. Summary of Diagnostic Accuracy of Change in ADC Value in Predicting Locoregional Failure in HNSCC
Study Total TP FP FN TN Sensitivity Specificity
Vandecaveye et al., 2012 (33) 30 8 1 0 21 1.00 0.95
Matoba et al., 2014 (9) 35 14 4 0 17 1.00 0.81
Marzi et al., 2017 (25) 28 6 6 2 14 0.75 0.70
King et al., 2013 (34) 30 10 5 3 12 0.77 0.71
hypothesized that high ADC is a predictor of poor outcome.
However, the results from using pre-treatment ADC for the prediction of locoregional failure are inconsistent. The treatment response may be attributed to differences in tumor aggressiveness, HPV status, treatment protocol, or the intensity of treatment, and hence, the use of only a single ADC measurement at pre-treatment appears to be inadequate for the prediction of treatment response (9, 35).
As response-adapted therapy becomes more widespread in cancer management, there will be greater interest in performing intra-treatment scanning (44). Increase in ADC during treatment has been correlated with the histological presence of necrosis, apoptosis, and inflammation (33, 48), and is thought to be a useful predictor of treatment response. All of the 10 studies that investigated the role of change in ADC at early intra-treatment or post-treatment periods found consistent results (9, 25, 28, 30, 33-38). A lower rise in the mean ADC was found at one to three weeks after the start of treatment in patients with locoregional failure, compared to that in patients with locoregional control. This approach may be more appropriate because the change in ADC is more objective and reproducible across centers than absolute ADC values (i.e., pre-treatment ADC) (44). In many malignant tumors, it is well known that successful treatment is correlated with an increase in ADC values (49-53). Additionally, the ability of DWI to predict treatment outcome at one to three weeks after the start of treatment seems to be in agreement with the expected optimal timing of adjuvant neck dissection after CCRT or radiotherapy (54-56).
Heterogeneity was not quantified since it is an expected flaw in systematic reviews of diagnostic test accuracy.
Instead, the possible sources for heterogeneity were explored. First, among the 12 studies, 3 acquired data from the primary tumors (26, 30, 34), 4 from lymph nodes (24, 25, 28, 37), and 5 from both sites (9, 33, 35, 36, 38). The study by Wong et al. (35) found that mean pre- treatment ADC values were higher in locoregional control than in locoregional failure in primary tumors, but found opposite results in lymph nodes. It may be related to the fact that ADC values acquired from the primary sites may be more influenced by physiologic motion and susceptibility artifacts than those acquired from cervical lymph nodes (9). Second, the included studies used different numbers and distributions of b-values, with majority of the studies using one to six b-values (9, 24, 26, 28, 30, 33-36, 38), although 2 studies used nine or ten b-values (25, 37).
Recent studies show that mean ADCs obtained from high b-value ranges of 300–1000 s/mm2 are more appropriate for predicting treatment response than mean ADCs obtained from low b-value ranges of 0–300 s/mm2 (27, 30, 44, 57).
Finally, the HNSCC showed heterogeneous histopathology with areas of micronecrosis, even though it was not readily distinguishable on imaging. Therefore, the use of the mean ADC of the whole tumor is considered more accurate than the measurement from a single section ROI (9).
The prediction of tumor response with ADC offers several advantages over the use of other imaging modalities like 18F-FDG PET/CT, contrast-enhanced MRI, magnetic resonance spectroscopy, and dynamic contrast-enhanced MRI. These include: absence of the need for injection of an isotope or contrast agent, short acquisition time, and simple estimation. Despite these advantages of ADC, the clinical use of ADC for the prediction of tumor response in HNSCC presents challenges due to susceptibility and motion artifacts. Furthermore, there is no clear threshold for the differentiation between locoregional failure and locoregional control. Finally, different MRI systems and different b-values have been used in previous studies. This means that the use of ADC cannot be extrapolated across hospital sites. Thus, further clinical studies to standardize and validate ADC measurements are necessary.
This study was limited by the relatively few included studies and its potential heterogeneity. This precluded our ability to perform meta-analysis, analyze subgroups, and identify potentially important covariates. When sufficient papers have been published in the future, a meta- analysis considering the factors that may cause heterogeneity may be performed.
In conclusion, high pre-treatment ADC and a low rise in ADC during the early intra-treatment or post-treatment periods of CCRT could be indicators of locoregional failure in patients with HNSCC. Considering the consistency of the results obtained with change in ADC, we propose that it could be used to identify patients who require more aggressive investigations to identify any residual cancer.
However, as the studies are few, heterogeneous, and at high risk for bias, the sensitivity and specificity of these parameters for predicting treatment response are yet to be determined. Continued research on standardization and validation of ADC measurement, and determination of the optimal threshold for percentage change, are required for clinical use.
Conflicts of Interest
The authors have no potential conflicts of interest to disclose.
ORCID iDs Young Jun Choi
https://orcid.org/0000-0001-7098-5042 Sae Rom Chung
https://orcid.org/0000-0003-4219-7166
REFERENCES
1. Bonner JA, Harari PM, Giralt J, Azarnia N, Shin DM, Cohen RB, et al. Radiotherapy plus cetuximab for squamous-cell carcinoma of the head and neck. N Engl J Med 2006;354:567-578
2. Argiris A, Karamouzis MV, Raben D, Ferris RL. Head and neck cancer. Lancet 2008;371:1695-1709
3. Chiesa F, Mauri S, Tradati N, Calabrese L, Giugliano G, Ansarin M, et al. Surfing prognostic factors in head and neck cancer at the millennium. Oral Oncol 1999;35:590-596
4. Ang KK, Trotti A, Brown BW, Garden AS, Foote RL, Morrison WH, et al. Randomized trial addressing risk features and time factors of surgery plus radiotherapy in advanced head-and- neck cancer. Int J Radiat Oncol Biol Phys 2001;51:571-578 5. Agra IM, Carvalho AL, Ulbrich FS, de Campos OD, Martins
EP, Magrin J, et al. Prognostic factors in salvage surgery for recurrent oral and oropharyngeal cancer. Head Neck 2006;28:107-113
6. Carvalho AL, Magrin J, Kowalski LP. Sites of recurrence in oral and oropharyngeal cancers according to the treatment approach. Oral Dis 2003;9:112-118
7. Goodwin WJ Jr. Salvage surgery for patients with recurrent squamous cell carcinoma of the upper aerodigestive tract: when do the ends justify the means? Laryngoscope 2000;110:1-18
8. Kowalski LP, Bagietto R, Lara JR, Santos RL, Silva JF Jr, Magrin J. Prognostic significance of the distribution of neck node metastasis from oral carcinoma. Head Neck 2000;22:207-214 9. Matoba M, Tuji H, Shimode Y, Toyoda I, Kuginuki Y, Miwa K, et al. Fractional change in apparent diffusion coefficient as an imaging biomarker for predicting treatment response in head and neck cancer treated with chemoradiotherapy. AJNR Am J Neuroradiol 2014;35:379-385
10. Newman JP, Terris DJ, Pinto HA, Fee WE Jr, Goode RL, Goffinet DR. Surgical morbidity of neck dissection after chemoradiotherapy in advanced head and neck cancer. Ann Otol Rhinol Laryngol 1997;106:117-122
11. Lavertu P, Bonafede JP, Adelstein DJ, Saxton JP, Strome M, Wanamaker JR, et al. Comparison of surgical complications after organ-preservation therapy in patients with stage III or IV squamous cell head and neck cancer. Arch Otolaryngol Head Neck Surg 1998;124:401-406
12. Davuluri R, Krase JM, Cui H, Goyal UD, Cheung MK, Hsu CC, et al. Image guided volumetric response during chemoradiotherapy for head and neck squamous cell carcinoma as a predictor of disease outcomes. Am J Otolaryngol 2016;37:304-310 13. Tang C, Fuller CD, Garden AS, Awan MJ, Colen RR, Morrison
WH, et al. Characteristics and kinetics of cervical lymph node regression after radiation therapy for human papillomavirus- associated oropharyngeal carcinoma: quantitative
image analysis of post-radiotherapy response. Oral Oncol 2015;51:195-201
14. Belli ML, Fiorino C, Zerbetto F, Raso R, Broggi S, Chiara A, et al. Early volume variation of positive lymph nodes assessed by in-room mega voltage CT images predicts risk of loco-regional relapses in head and neck cancer patients treated with intensity-modulated radiotherapy. Acta Oncol 2015;54:1490- 1495
15. Ojiri H, Mendenhall WM, Mancuso AA. CT findings at the primary site of oropharyngeal squamous cell carcinoma within 6-8 weeks after definitive radiotherapy as predictors of primary site control. Int J Radiat Oncol Biol Phys 2002;52:748-754 16. Hermans R, Pameijer FA, Mancuso AA, Parsons JT, Mendenhall
WM. Laryngeal or hypopharyngeal squamous cell carcinoma:
can follow-up CT after definitive radiation therapy be used to detect local failure earlier than clinical examination alone?
Radiology 2000;214:683-687
17. King AD, Keung CK, Yu KH, Mo FK, Bhatia KS, Yeung DK, et al. T2-weighted MR imaging early after chemoradiotherapy to evaluate treatment response in head and neck squamous cell carcinoma. AJNR Am J Neuroradiol 2013;34:1237-1241 18. Lell M, Baum U, Greess H, Nomayr A, Nkenke E, Koester M,
et al. Head and neck tumors: imaging recurrent tumor and post-therapeutic changes with CT and MRI. Eur J Radiol 2000;33:239-247
19. Sanguineti G, Ricchetti F, Wu B, Agrawal N, Gourin C, Agbahiwe H, et al. Volumetric change of human papillomavirus-related neck lymph nodes before, during, and shortly after intensity- modulated radiation therapy. Head Neck 2012;34:1640-1647 20. Munck JN, Cvitkovic E, Piekarski JD, Benhamou E, Recondo
G, Bachouchi M, et al. Computed tomographic density of metastatic lymph nodes as a treatment-related prognostic factor in advanced head and neck cancer. J Natl Cancer Inst 1991;83:569-575
21. McCollum AD, Burrell SC, Haddad RI, Norris CM, Tishler RB, Case MA, et al. Positron emission tomography with 18F-fluorodeoxyglucose to predict pathologic response after induction chemotherapy and definitive chemoradiotherapy in head and neck cancer. Head Neck 2004;26:890-896
22. King AD, Mo FK, Yu KH, Yeung DK, Zhou H, Bhatia KS, et al.
Squamous cell carcinoma of the head and neck: diffusion- weighted MR imaging for prediction and monitoring of treatment response. Eur Radiol 2010;20:2213-2220 23. Srinivasan A, Chenevert TL, Dwamena BA, Eisbruch A,
Watcharotone K, Myles JD, et al. Utility of pretreatment mean apparent diffusion coefficient and apparent diffusion