Diffusion-Weighted MR Imaging of Upper Abdomen:
Comparison of Breath-Hold, Free-Breathing, and Respiratory-Triggered Techniques
1Kyung Eun Cho, M.D., Jeong-Sik Yu, M.D., Jae-Joon Chung, M.D., Joo Hee Kim, M.D., Ki Whang Kim, M.D.
1Department of Radiology and the Research Institute of Radiological Science, Yonsei University College of Medicine, Gangnam Severance Hospital, Korea Received February 15, 2011 ; Accepted March 22, 2011
Address reprint requests to : Jeong-Sik Yu, M.D., Department of Radiology, Yonsei University College of Medicine, Gangnam Severance Hospital, 712 Eonju-ro, Gangnam-gu, Seoul 135-720, Korea.
Tel. 82-2-2019-3510 Fax. 82-2-3462-5472 E-mail: [email protected]
Purpose: To compare the image quality and stability of apparent diffusion coefficient (ADC) in diffusion-weighted MRI (DWI) of the upper abdomen among the breath-hold (BH), free-breathing (FB) and respiratory-triggered (RT) techniques.
Materials and Methods: We analyzed the qualitative and quantitative parameters of 204 consecutive patients who underwent DWI (BH-DWI, FB-DWI or RT-DWI; n=68 in each technique). Qualitative parameters included liver contour, vascular landmarks, intra-slice homogeneity, and inter-slice discontinuity on DWI with a b-factor of 800 s/mm2 and a four-grade scale. Quantitative parameters included inter-slice or intra- slice inhomogeneity of ADC in the spleen.
Results: RT-DWI showed better liver contour compared to BH-DWI (p <0.001) or FB- DWI (p = 0.001). As for the quality of the vascular landmarks, BH-DWI was inferior to FB-DWI (p = 0.025) and RT-DWI (p < 0.001). FB-DWI had the poorest result (p
<0.001) for inter-slice discontinuity compared to the other techniques. FB-DWI showed significantly larger inter-slice differences between the highest and the lowest ADCs in the spleen compared with those of RT-DWI (p < 0.001). Intra-slice homogene- ity was significantly better in RT-DWI and FB-DWI than in BH-DWI (p < 0.001).
Conclusion: Compared with BH or FB techniques, RT-DWI appears to result in the best imaging by providing better anatomic detail without skipping continuous slices, in addition to more homogeneous ADCs.
Index words :Abdomen Liver Spleen
Magnetic Resonance Imaging
Diffusion Magnetic Resonance Imaging
In the magnetic resonance imaging (MRI) of the upper abdomen, especially for the liver, diffusion-weighted MRI (DWI) has been reported to be useful for the detec- tion and characterization of focal lesions (1-3). While conventional unenhanced MRI depends on tissue-spe- cific T1 and T2 relaxation times and dynamic MRI de- pends on arterial hypervascularity, DWI achieves tissue contrast based on tissue differences in the Brownian motion of intra- and extracellular water molecules (4).
Generally, DWI forms images using T2-weighted spin- echo echo-planar imaging (EPI) sequences with two or more different diffusion gradients designated as “b-fac- tors” before and after the 180。refocusing pulses (5). The apparent diffusion coefficient (ADC) of the target tissue can be calculated by eliminating background T2 effects in order to better characterize a disease process. Various methods have been proposed to achieve high-quality DWI by optimizing the signal-to-noise ratio (SNR) in lim- ited scanning time, thereby reducing the susceptibility artifact of EPI and reducing artifact from inevitable physiologic motion. For clinical imaging of the upper ab- domen, three different techniques have been proposed for daily practice: the breath-hold (BH), free-breathing (FB), and respiratory-triggered (RT) (6). Although these techniques are widely used in obtaining DWI, there are limited comparative studies dealing with the ADC re- producibility or the image quality (7, 8). Aside from the reproducibility between the different DWI sessions, the stability, defined as the degree of intra- and inter-slice variability in the same imaging session, would be also important to grant a reliability for the measured values of ADC; however, there has been no such study dealing with the comparative stability among the different data acquisition techniques of DWI. In the present study, we compared the image quality and ADC stability in the DWI of the upper abdomen among the three different methods of data acquisition.
Materials and Methods
Patients
Approval for this retrospective study was obtained from our institutional review board, which waived the requirement of informed consent. We retrospectively analyzed a total of 204 consecutive patients (135 men and 69 women aged between 16 and 86 years [mean, 59.6 years]), examined by hepatic MRI using one of the three approaches (BH, FB, or RT); DWI during BH (BH- DWI) was performed between March and May 2007 in
68 patients, DWI during FB (FB-DWI) was performed between August and October 2007, in 68 different pa- tients, and DWI during RT (RT-DWI) was performed between February and April 2008 on a third set of 68 pa- tients. Among the three groups of patients, there were no remarkable differences for the number of cirrhotic and non-cirrhotic patients (Table 1).
MRI Techniques
The MRI was performed using a 1.5 Tesla (T) system (Magnetom Avanto; Siemens, Erlangen, Germany) equipped with high-performance gradients (maximum amplitude 45 mT/m) and a six-element phased-array surface coil. Patients were placed in the supine position, with anterior and posterior phased-array coils centered over the liver. After obtaining localizer images in the supine position, spectrally fat-suppressed breath-hold T2-weighted turbo spin echo (TSE) images (repetition time [TR] = 3,020 ms, echo time [TE] = 109 ms, flip an- gle = 150�, echo train length = 13, slice thickness = 6 mm, slices = 21), were obtained in the axial plane. After obtaining a double-echo chemical shift gradient echo se- quence (GRE) (TR 100 ms, first-echo TE 2.0 ms [op- posed-phase], second-echo TE 4.2 ms [in-phase], flip an- gle 70�), dynamic contrast-enhanced imaging was per-
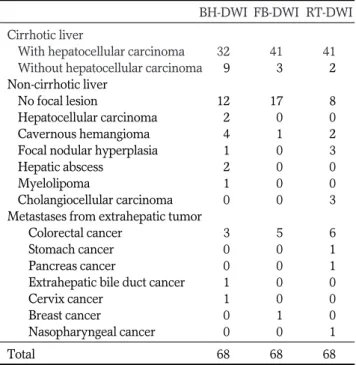
Table 1. Patients in Three Groups of Different Diffusion- Weighted MR Imaging Techniques
BH-DWI FB-DWI RT-DWI Cirrhotic liver
With hepatocellular carcinoma 32 41 41 Without hepatocellular carcinoma 09 03 02 Non-cirrhotic liver
No focal lesion 12 17 08
Hepatocellular carcinoma 02 00 00
Cavernous hemangioma 04 01 02
Focal nodular hyperplasia 01 00 03
Hepatic abscess 02 00 00
Myelolipoma 01 00 00
Cholangiocellular carcinoma 00 00 03 Metastases from extrahepatic tumor
Colorectal cancer 03 05 06
Stomach cancer 00 00 01
Pancreas cancer 00 00 01
Extrahepatic bile duct cancer 01 00 00
Cervix cancer 01 00 00
Breast cancer 00 01 00
Nasopharyngeal cancer 00 00 01
Total 68 68 68
Note.─The values represent the number of the patients for each technique.
DWI = diffusion-weighted MR imaging, BH = breath-hold, FB = free-breathing, RT = respiratory-triggered
formed using a three-dimensional (3D) GRE sequence (VIBE; Siemens, Erlangen, Germany) by ultrafast image reconstruction using parallel imaging algorithms (GRAPPA factor, 2) in the axial plane (TR 4.4 ms, TE 2.1 m, flip angle 10�, matrix 448×224, field of view [FOV], 271×379 mm, slice thickness 5 mm, slice spacing 2.5 mm, slices 72) during a 20 s breath-holding period. A dy- namic series consisted of one precontrast series fol- lowed by three successive postcontrast series including early arterial, late arterial, and portal phase imaging with 34 s intervals (20 s for image acquisition with breath-holding and 14 s for re-breathing), prior to the start of each phase imaging followed by 5 min delayed phase imaging.
DWI was performed before dynamic imaging using a single-shot spin-echo EPI sequence that combined the two diffusion (motion-probing) gradients before and af- ter the 180�pulse along the three directions of section- select, phase-encoding, and frequency-encoding. Data acquisition with an EPI read-out was obtained by apply- ing three different b-factors of 50, 400, and 800 s/mm2. Common parameters for DWI sequences are as follows:
A generalized auto-calibrating partially parallel acquisi- tion (GRAPPA) algorithm of parallel imaging with a twofold acceleration factor was added to reduce acquisi- tion time, and spectral fat saturation was used systemat- ically to suppress chemical-shift artifacts. Technical pa- rameters of BH-DWI were as follows (Table 2): TR 1000 ms, TE 69 ms, matrix 128×192, FOV 308-379 mm, slices 27 (9 slices for each b factor), thickness 6 mm, in- ter-slice gap 1.8 mm, number of excitations = 2, band- width 1735 Hz/pixel, acquisition time 24s. The sequence was obtained within a single breath-holding period for the upper half of the liver and another single breath- holding period for the lower half of the liver; a total of 18 slices were acquired for a given liver for each b- fac- tor. ADC maps of the isotropic images were automati- cally acquired. Sequence parameters examining the dif- ference between FB-DWI and BH-DWI were as follows (Table 2): TR 3900 ms, TE 75 ms, matrix 156×192, slices 90 (30 slices for each b-factor), thickness 6 mm with no inter-slice gap, number of excitations = 5. The acquisition time for the entire liver with three different b-factors was 130 s; other parameters were the same as those for the BH technique. RT-DWI sequence parame- ters were as follows: TR 3900 ms, TE 75 ms, matrix 156
× 192, FOV 360-400, slices 78 (26 slices for each b-fac- tor), thickness 6 mm, inter-slice gap 1.2 mm, number of excitations = 4, bandwidth 1,736 Hz/pixel, acquisition
time 4-5 min (Table 2). All scans were sent to the pic- ture archiving and communication system (PACS) for interpretation on PACS workstations.
Image Analysis
MR images were reviewed retrospectively by consen- sus of three attending radiologists who had 6, 13 and 15 years of experience in abdominal MRI. Each imaging set of diffusion images using b=800 s/mm2from the three different DWI techniques was qualitatively evaluated using a 4-grade scale for (a) delineation of the left liver contour (1, poor; 2, fair; 3,good; 4, excellent), (b) sharp- ness of the intrahepatic vessels of right hemiliver (1, se- vere blurring; 2, moderate blurring; 3, minimal blurring;
4, good visualization of the peripheral branch), (c) inho- mogeneity of signal intensity across the field of view (1, severe; 2, moderate; 3, mild; 4, no or minor), and (d) in- ter-slice discontinuity (1, severe; 2, moderate; 3, mild; 4, no or minor). We calculated the average among the three radiologists.
Quantitative comparison of the three techniques was performed by analyzing the ADC values of the spleen, which was empirically selected in this study due to the measurable organ size, less vulnerability to the cardiac or respiratory motion, and internal homogeneity with- out large intervening vasculature. ADC values of the spleen were calculated from the ADC maps with use of all b factors of 50, 400 and 800 s/mm2in each patient us- ing operator-defined region-of- interest (ROI) measure- ments performed by a fourth-year radiology resident.
ROIs were located in the central portion of the spleen, which was free from large vessels and any artifacts or focal changes approximately 75 mm2in size for every slice. Among the measured mean ADCs of all the differ- ent slices, inter-slice inhomogeneity was determined as
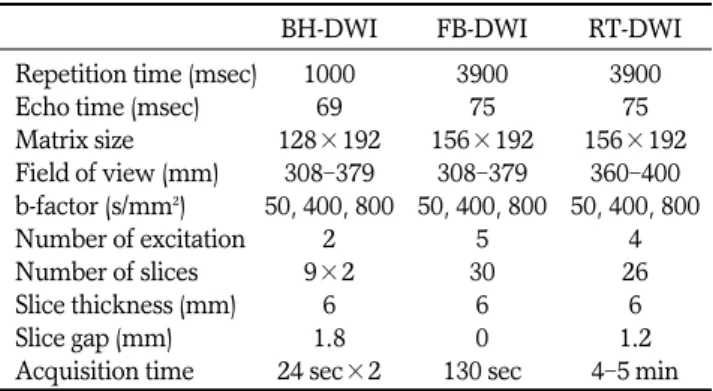
Table 2. Imaging Parameters of Three Diffusion-Weighted MR Imaging Techniques
BH-DWI FB-DWI RT-DWI
Repetition time (msec) 1000 3900 3900
Echo time (msec) 69 75 75
Matrix size 128×192 156×192 156×192
Field of view (mm) 308-379 308-379 360-400 b-factor (s/mm2) 50, 400, 800 50, 400, 800 50, 400, 800
Number of excitation 2 5 4
Number of slices 9×2 30 26
Slice thickness (mm) 6 6 6
Slice gap (mm) 1.8 0 1.2
Acquisition time 24 sec×2 130 sec 4-5 min Note.─DWI = diffusion-weighted MR imaging, BH = breath- hold, FB = free-breathing, RT = respiratory-triggered
the difference between the highest and the lowest ADC values in each patient. For evaluation of intra-slice inho- mogeneity, the axial slice of the ADC map showing the maximum diameter of the spleen was chosen to draw the ROI over the largest area possible. Intra-slice image noise was quantified as the standard deviation of the sig- nal intensity measured in the ADC map of the spleen.
Statistical Analysis
For statistical analysis of all quality scores, the Kruskal-Wallis test was used to compare multiple non- parametric data sets for the three different techniques.
The Mann-Whitney test was also used for each compari- son between two techniques in three combinations among the three techniques. ADC values of the spleen for inter-slice and intra-slice inhomogeneity were com- pared using a one-way ANOVA test for the three differ-
A B
C
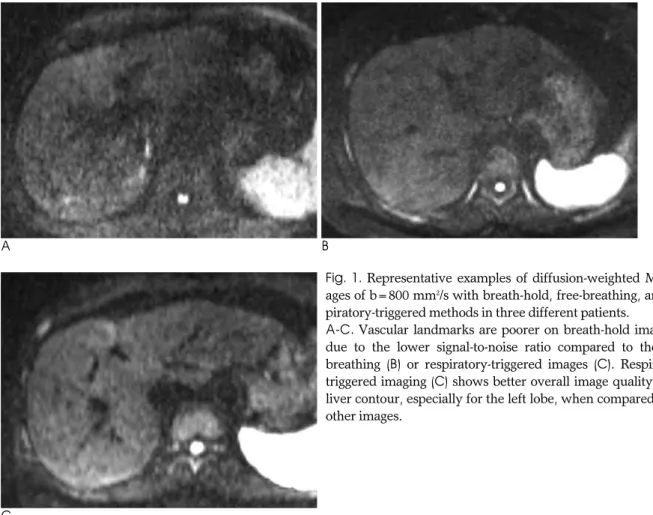
Fig. 1. Representative examples of diffusion-weighted MR im- ages of b=800 mm2/s with breath-hold, free-breathing, and res- piratory-triggered methods in three different patients.
A-C. Vascular landmarks are poorer on breath-hold image (A) due to the lower signal-to-noise ratio compared to the free- breathing (B) or respiratory-triggered images (C). Respiratory- triggered imaging (C) shows better overall image quality in the liver contour, especially for the left lobe, when compared to the other images.
Table 3. Results of Qualitative Analysis for the Three Diffusion-Weighted MR Imaging Techniques Using a 4-Grade Scale for Each Analysis
BH-DWI FB-DWI RT-DWI P-value*
Liver contour a 2.2 ± 1.1 2.3 ± 1.1 2.9 ± 1.0 <0.001
Vascular landmark b 2.3 ± 1.2 2.8 ± 1.2 3.2 ± 1.0 <0.001
Intra-slice inhomogeneity c 3.2 ± 0.5 3.4 ± 0.8 3.4 ± 0.6 <0.166
Inter-slice discontinuity d 3.8 ± 0.5 3.4 ± 0.6 3.8 ± 0.5 <0.001
Note.─Data represent the mean ± standard deviation. Scoring system: 1= poor, 2 = fair, 3 = good, 4 = excellent.
*Kruskal-Wallis test used for multiple comparisons
a RT-DWI shows significantly better quality scores than the other two techniques on the Mann-Whitney test (p ≤ 0.001).
b BH-DWI shows a significantly worse score than RT-DWI (p<0.001) or FB-DWI (p=0.025).
c No significant differences in all combination of comparisons between two different techniques (p>0.05).
d FB-DWI shows a worse score than the other two techniques (p<0.001).
DWI = diffusion-weighted MR imaging, BH = breath-hold, FB = free-breathing, RT = respiratory-triggered
ent techniques, followed by a post-hoc analysis (Bonferroni test) for comparison of two-technique com- binations for the three techniques. A p-value less than 0.05 was considered to be statistically significant.
Results
There were significant differences in image quality in- cluding liver contour, vascular landmarks, and inter- slice discontinuity (p < 0.001), while there was no statis- tically significant difference in intra-slice inhomogeneity (p = 0.166) among the three techniques (Figs. 1, 2) (Table 3). Comparison between two techniques showed that RT-DWI resulted in a clearer liver contour com- pared to BH-DWI (p < 0.001) and FB-DWI (p = 0.001).
The mean quality score of the liver contour in BH-DWI was comparable to the FB-DWI score (p = 0.684). The mean quality score of vascular landmarks was lower in BH-DWI than in FB-DWI (p = 0.025) or RT-DWI (p <
0.001), while there was no significant difference be- tween scores for FB-DWI and RT-DWI (p = 0.077). FB- DWI had the lowest quality score for continuity be- tween slices (p < 0.001), while BH-DWI and RT-DWI showed similar scores (p = 0.748) (Fig. 2) (Table 3).
Inter- and intra-slice differences in ADCs measured on the map were significantly different (p < 0.001) be- tween the three techniques. There was no significant mean inter-slice difference between the ADCs of BH- DWI (0.420 ± 0.221×10⁻³mm2/s) and RT-DWI (0.349
± 0.183×10⁻³mm2/s) (p = 0.241) or between those of BH-DWI and FB-DWI (0.516 ± 0.294×10⁻³mm2/s) (p = 0.058). However, FB-DWI showed a significantly greater inter-slice difference between the highest and lowest ADCs compared to RT-DWI (p < 0.001) (Fig. 3).
The mean standard deviations representing intra-slice homogeneity were smaller in RT-DWI (0.040×10⁻³
mm2/s) and FB-DWI (0.044×10⁻³ mm2/s) than in BH- DWI (0.048×10⁻³mm2/s) (p < 0.001), while there was no significant difference between those of FB-DWI and RT-DWI (p = 0.395) (Fig. 4).
Discussion
DWI is a non-enhanced technique that does not re- quire administration of intravenous contrast agent and provides unique tissue contrast that reflects cellularity, the integrity of cellular membranes, and the viscosity of extracellular fluid (9, 10). However, due to DWI’s sensi- tivity to the microscopic motion of water molecules, ab- dominal imaging is easily affected by the physiologic motion such as respiration, bowel peristalsis, cardiac pulsation, and blood flow (11). To minimize the adverse
A B C D E
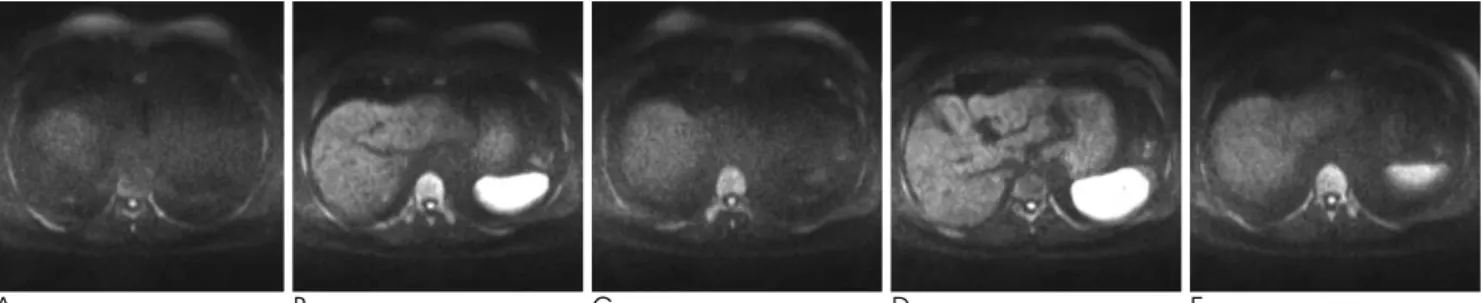
Fig. 2. A representative example of five contiguous slices of diffusion-weighted imaging (b=800 mm2/s) with use of the free-breath- ing technique in a 64-year-old man with a cirrhotic liver.
A-E. From (A) to (E), the axial image slices are markedly discontinuous, passing around the liver dome to right hepatic vein level.
The signal intensities of the hepatic parenchyma are not homogeneous between the slices due to a serious misregistration effect during the free-breathing.
Fig. 3. Box-plots of mean inter-slice differences of apparent dif- fusion coefficients (ADCs) measured in the spleen on the three diffusion-weighted images of the breath-hold (BH), free- breathing (FB) and respiratory-triggered (RT) techniques. The decimal numbers on the y-axis are inter-slice differences of ADCs (×10-3 mm2/s). FB shows a significantly greater inter- slice difference between the highest and lowest ADCs com- pared to RT.
effects of inherent susceptibility artifact and limited sig- nal-to-noise ratio in the EPI sequence and motion-relat- ed image degradation, several methods have been intro- duced for DWI of the liver including BH-, FB-, and RT- DWI (6). The short imaging time required in BH-DWI aims to eliminate respiratory motion, although it also minimizes the number of excitations and thus limits the signal-to-noise ratio (SNR) (12). FB-DWI was originally designed for whole-body DWI with the advantage of a large number of excitations to enhance the SNR and ob- tain thinner section imaging (13). Furthermore, the long image acquisition time of RT-DWI can reduce marginal blurring by minimizing the physiologic motion and high SNR (6, 7, 14, 15). All three methods have been used in clinical practice for DWI of the upper abdomen; howev- er, the relative value of each technique’s ADC has rarely been addressed in the scientific literature (7, 8). In the present study, we aimed to compare the technical feasi- bility of the three methods of DWI acquisition by quali- tative and quantitative analysis.
As noted in previous reports (6, 12), no single DWI technique satisfies all qualitative or quantitative criteria.
Therefore, selection of a DWI technique depends upon
its clinical indication and institutional protocol.
Nevertheless, our study found significant differences between qualitative and quantitative values of the three different techniques. The key advantages of BH-DWI, which requires a 6 mm or thicker slice to maintain im- age quality, include short imaging time (8, 12). In our study, even with a slice thickness of 6 mm, BH-DWI had a lower quality of liver contour than RT-DWI in ad- dition to a lower quality of vascular landmarks (b=800 s/mm2). Although we did not separately analyze the quality scores for the right and left hemilivers, the pul- satile movement of the heart is well-known for degrad- ing the image of the left hemiliver on DWI with large b- factors (6), which might have influenced the poor over- all quality scores of BH-DWI in our study. The poorest overall intra-slice homogeneity of BH-DWI, quantified by the standard deviation on the ADC maps, may also be due to the inherently poor SNR in the present study.
Taking advantage of numerous excitations within a limited imaging time, FB-DWI inherently guarantees a high SNR, enabling thin section imaging with use of multiple b-factors for more accurate ADC calculation (6, 8, 12, 13). However, our qualitative and quantitative
A B
C
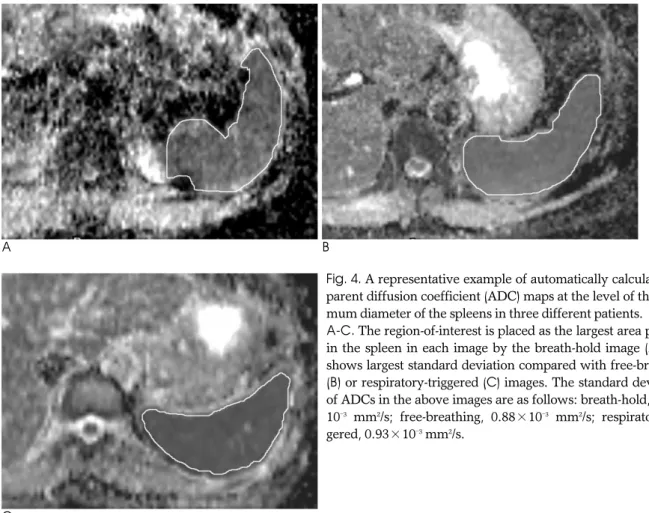
Fig. 4. A representative example of automatically calculated ap- parent diffusion coefficient (ADC) maps at the level of the maxi- mum diameter of the spleens in three different patients.
A-C. The region-of-interest is placed as the largest area possible in the spleen in each image by the breath-hold image (A), and shows largest standard deviation compared with free-breathing (B) or respiratory-triggered (C) images. The standard deviations of ADCs in the above images are as follows: breath-hold, 1.50×
10-3 mm2/s; free-breathing, 0.88×10⁻³ mm2/s; respiratory-trig- gered, 0.93×10⁻³mm2/s.
analysis showed the inter-slice variability of FB-DWI to be too large to expect a full set of images covering the entire anatomic structure in the imaging fields. This un- expected skip of imaging slices may be due to the inabil- ity to fix the exact location of individual slices during breathing in this kind of image acquisition. This draw- back seems to be fatal for the assessment of small focal lesions in upper abdominal imaging (15). The acquisi- tion time of single-shot EPI, which was used for DWI in the present study, is very short. Although an individual image made of one excitation is free of motion effects, more time is necessary for multiple excitations of the same slice to improve SNR of FB-DWI (12). In this situa- tion, signal misregistration would be inevitable, even in the same image slice, which resulted in the blurring of anatomic details and low quality scores of FB-DWI in the present study. Consequently, the ADC may be less accurate and less reproducible in FB-DWI (6).
At the expense of prolonged examination time, RT- DWI provides sharper anatomic detail (6, 8). In the pre- sent study, all RT-DWI quality scores, which were rela- tively free from respiration-related marginal blurring with a high SNR from multiple excitations, were compa- rable or superior to other techniques. Even though Kwee et al. (8) reported ADCs of the hepatic parenchy- ma to be more scattered in RT-DWI than other tech- niques, we found the inter-slice difference and inter- slice inhomogeneity of ADCs of the spleen in RT-DWI to be significantly smaller than those in FB-DWI and BH-DWI, respectively. Regarding the ADC measure- ment in RT-DWI, a pseudo-anisotrophy phenomenon originated in localized hepatic movements during signal acquisition, given that extension, contraction, and rota- tion are known to accelerate molecular motion (16). A healthy liver is elastic and easily distorted by slight ex- ternal forces such as respiratory movement, and such movements during RT-DWI in particular, have been shown produce higher ADCs (16, 17). However, in the present study, the absolute ADCs were not compared between techniques. We also acknowledge that there may be a difference in the elasticity between the liver and spleen, which we used in this study to measure ADC. Our findings of better inter-slice and intra-slice homogeneity of ADCs suggests better reproducibility of the ADC measurement in RT-DWI than in the other techniques, regardless of ADC size.
This study had several limitations. First, the three dif- ferent techniques were not simultaneously performed or compared in the same patient due to the nature of
this retrospective study. However, we contend that the number of patients was large enough to validate the sta- tistical analysis. Second, the spleen was empirically se- lected for the ADC measurement instead of the liver, which is more often the subject of clinical imaging in- vestigations. We selected the spleen to avoid a partial volume averaging effect by the large hepatic vascula- ture, as well as to prevent image degradation by cardiac pulsation in the left hemiliver. Although the possible dif- ference in elasticity between the spleen and the liver may have influenced the ADC measurement, splenomegaly caused by liver cirrhosis and portal hy- pertension would not affect the ADC of the spleen (18).
The absolute value of ADC was out of focus in our study. Additionally, the number of cirrhotic and non-cir- rhotic livers was not so different among the three groups of different DWI technique in our study. Although the ADCs of the intra-abdominal organs would be quite variable, even in novel contemporary units (17), we used the spleen as it was the organ showing the most ho- mogeneous signal intensity in the upper abdomen (19) for the comparative analysis of the relative inter-slice stability and intra-slice homogeneity among the three different techniques. Third, it may be unfair to compare techniques which used different parameters, especially considering the number of excitations and scan time.
For example, if the scan time were fixed in a short time, the SNR of RT-DWI would be worse than BH- or FB- DWI (6). However, our study used individually opti- mized parameters for each technique. Lastly, the results of our study are limited to a 1.5T machine, or even to our specific MRI scanner. High-field units would in- crease SNR and susceptibility effects, invalidating these results. For example, inherently higher SNR of the 3T machine would provide better image quality, even in the BH-DWI (6). To reduce the adverse effect of in- creased susceptibility for the local magnetic field inho- mogeneity in the high field machine, other technical tri- als of multi-shot EPI or propeller-EPI have been applied for DWI of upper abdomen (20, 21), which are beyond the focus of our study.
In conclusion, compared to the BH or FB techniques, RT-DWI may provide the best overall image quality, in- cluding better anatomic detail, more homogeneous data acquisition for ADCs, and without unexpected skips of continuous slices. Although the imaging time of RT- DWI is far longer than the other techniques, RT-DWI seems valuable enough to be applied for DWI of the up- per abdomen.
References
1. Ichikawa T, Haradome H, Hachiya J, Nitatori T, Araki T.
Diffusion-weighted MR imaging with a single-shot echoplanar se- quence: detection and characterization of focal hepatic lesions.
AJR Am J Roentgenol 1998;170:397-402
2. Nasu K, Kuroki Y, Nawano S, et al. Hepatic metastases: diffusion- weighted sensitivity-encoding versus SPIO-enhanced MR imaging.
Radiology 2006;239:122-130
3. Kim T, Murakami T, Takahashi S, Hori M, Tsuda K, Nakamura H.
Diffusion-weighted single-shot echoplanar MR imaging for liver disease. AJR Am J Roentgenol 1999;173:393-398
4. Le Bihan D, Breton E, Lallemand D, Aubin ML, Vignaud J, Laval- Jeantet M. Separation of diffusion and perfusion in intravoxel inco- herent motion MR imaging. Radiology 1988;168:497-505
5. Stejskal EO, Tanner JE. Spin diffusion measurements: spin-echo in the presence of a time dependent field gradient. J Chem Phys 1962;
42:288-292
6. Naganawa S, Kawai H, Fukatsu H, Sakurai Y, Aoki I, Miura S, et al. Diffusion-weighted imaging of the liver: technical challenges and prospects for the future. Magn Reson Med Sci 2005;4:175-186 7. Kandpal H, Sharma R, Madhusudhan KS, Kapoor KS. Respiratory-
triggered versus breath-hold diffusion-weighted MRI of liver le- sions: comparison of image quality and apparent diffusion coeffi- cient values. AJR Am J Roentgenol 2009;192:915-922
8. Kwee TC, Takahara T, Koh DM, Nievelstein RA, Luijten PR.
Comparison and reproducibility of ADC measurements in breath- hold, respiratory triggered, and free-breathing diffusion-weighted MR imaging of the liver. J Magn Reson Imaging 2008;28:1141-1148 9. Taouli B, Koh DM. Diffusion-weighted MR imaging of the liver.
Radiology 2010;254:47-66
10. Koh DM, Collins DJ. Diffusion-weighted MRI in the body: applica- tions and challenges in oncology. AJR Am J Roentgenol 2007;188:
1622-1635
11. Charles-Edwards EM, deSouza NM. Diffusion-weighted magnetic resonance imaging and its application to cancer. Cancer Imaging
2006;6:135-143
12. Koh DM, Takahara T, Imai Y, Collins DJ. Practical aspects of as- sessing tumors using clinical diffusion-weighted imaging in the body. Magn Reson Med Sci 2007;6:211-224
13. Takahara T, Imai Y, Yamashita T, Yasuda S, Nasu S, van Cauteren M. Diffusion weighted whole body imaging with background body signal suppression (DWIBS): technical improvement using free breathing, STIR and high resolution 3D display. Radiat Med 2004;22:275-282
14. Asbach P, Hein PA, Stemmer A, Wagner M, Hyppertz A, Hamm B, et al. Free-breathing echo-planar imaging based diffusion- weighted magnetic resonance imaging of the liver with prospec- tive acquisition correction. J Comput Assist Tomogr 2008;32:372- 378
15. Nasu K, Kuroki Y, Sekiguchi R, Nawano S. The effect of simulta- neous use of respiratory triggering in diffusion-weighted imaging of the liver. Magn Reson Med Sci 2006;5:129-136
16. Nasu K, Kuroki Y, Fujii H, Minami M. Hepatic pseudo-anisotropy:
a specific artifact in hepatic diffusion-weighted images obtained with respiratory triggering. MAGMA 2007;20:205-211
17. Kim SY, Lee SS, Byun JH, et al. Malignant hepatic tumors: short- term reproducibility of apparent diffusion coefficients with breath- hold and respiratory-triggered diffusion weighted MR imaging.
Radiology 2010;255:815-823
18. Kim T, Murakami T, Takahashi S, Hori M, Tsuda K, Nakamura H.
Diffusion-weighted single-shot echoplanar MR imaging for liver disease. AJR Am J Roentgenol 1999;173:393-398
19. Mu¨ller MF, Prasad P, Siewert B, Nissenbaum MA, Raptopoulos V, Edelman RR. Abdominal diffusion mapping with use of a whole- body echo-planar system. Radiology 1994;190:475-458
20. Weih KS, Driesel W, von Mengershausen M, Norris DG. Online motion correction for diffusion-weighted segmented-EPI and FLASH imaging. MAGMA 2004;16:277-283
21. Deng J, Omary RA, Larson AC. Multishot diffusion-weighted SPLICE PROPELLER MRI of the abdomen. Magn Reson Med 2008;59:947-953
대한영상의학회지 2011;64:465-473
상복부의 확산강조자기공명영상: 호흡정지기법, 자유호흡기법, 호흡유발기법간의 비교1
1연세대학교 의과대학 강남세브란스병원 영상의학과 조경은∙유정식∙정재준∙김주희∙김기황
목적: 상복부의 확산강조자기공명영상을 위한 호흡정지기법, 자유호흡기법, 또는 호흡유발기법에서 각 기법 간에 상 대적인 영상의 질과 겉보기확산계수의 안정성을 평가하고자 하였다.
대상과 방법: 호흡정지기법, 자유호흡기법, 또는 호흡유발기법을 이용하여 상복부 확산강조자기공명영상을 촬영한 각각 68명씩의 연속적인 환자들을 대상으로 하였다. 간윤곽, 혈관지표, 영상절편 내의 균일성, 그리고 영상절편간의 불연속성을 b값 800 s/mm2의 확산강조영상에서 4점 스케일로 질적평가하였고 영상절편간 혹은 영상절편 내의 불 균일성을 비장의 겉보기확산계수로 서로 비교하였다.
결과: 간윤곽은 호흡정지기법(p < 0.001)이나 자유호흡기법(p =0.001)에 비해 호흡유발기법의 점수가 높았다. 혈 관 지표는 자유호흡기법(p =0025)이나 호흡유발기법(p < 0.001)에 비해 호흡정지기법의 점수가 낮았다. 자유호흡 기법은 다른 기법들에 비해 영상절편간의 불연속성이 심각하였으며(p < 0.001) 겉보기확산계수도 가장 높은 수치와 가장 낮은 수치 간의 차이가 컸다(p < 0.001). 호흡정지기법에서 한 절편 내의 겉보기확산계수의 균일성이 떨어졌다 (p < 0.001).
결론: 상복부의 확산강조자기공명영상에 있어 호흡유발기법은 호흡정지기법이나 자유호흡기법에 비해 균일한 겉보 기확산계수를 얻을 수 있을 뿐만 아니라 영상절편의 건너뜀이 없이 더욱 우수한 해부학적 정보를 제공할 수 있다.