음식 중심의 식품섭취빈도 조사지 개발을 위한 상용 음식 추출 시 성별에 따른 차이 분석
강민지1, 이정은2,3, 심재은4,5, 백희영1,2
1한국여성과학기술단체총연합회 젠더혁신연구센터, 2서울대학교 식품영양학과, 3서울대학교 생활과학연구소, 4대전대학교
식품영양학과, 5대전 동구 어린이급식관리지원센터
Gender Analysis of Food Items Selection for Food Frequency Questionnaire Development
Minji Kang1, Jung Eun Lee2,3, Jae Eun Shim4,5, Hee-Young Paik1,2
1Center for Gendered Innovations in Science and Technology Research (GISTeR), Korea Federation of Women’s Science & Technology Associations, Seoul, Korea
2Department of Food and Nutrition, Seoul National University, Seoul, Korea
3Research Institute of Human Ecology, Seoul National University, Seoul, Korea
4Department of Food and Nutrition, Daejeon University, Daejeon, Korea
5Daejeon Dong-gu Center for Children’s Food Service Management, Daejeon, Korea
Background: The aims of this study were 1) to compare foods between men and women with high contributions to absolute intake and the variability in energy and nutrient intakes, which are common criteria of selecting foods for food frequency questionnaire (FFQ), 2) to analyze possible inaccuracies due to not taking gender into consideration.
Methods: The study used 1-day 24 hour recall data of 7,952 participants (n=3,250 men, n=4,702 women) aged 19-64 years who participated in the 2013-2014 Korea National Health and Nutrition Examination Survey. Foods which have high possibility of being included in FFQ items, called candidate foods, were selected by analyzing their contribution to absolute intake and variability in the intakes of energy and 15 nutrients in total participants, men and women.
Results: The number of candidate foods selected was 133 for total participants, 126 for men, and 153 for women. Intakes of candidate foods for total participants were significantly higher in energy and six nutrients out of selected 16 nutrients than those of candidate foods for men only. On the contrary, all nutrient intakes of candi- date foods for total participants were significantly lower than those of candidate foods for women only.
Conclusions: Differences were revealed between men and women not only in the total numbers, but also in the selected food items from the candidate foods for FFQ. Thus, developing FFQs without considering gender may produce systematic errors in dietary assessment, possibly in different directions for men and women.
Korean J Health Promot 2018;18(2):98-106
Keywords: Gender, Food selection, FFQ development, Dietary assessment, KNHANES
■ Received: Jun. 6, 2018 ■ Revised: Jun. 20, 2018 ■ Accepted: Jun. 25, 2018
■ Corresponding author : Hee-Young Paik, ScD
Center for Gendered Innovations in Science and Technology Research (GISTeR), Korea Federation of Women’s Science & Technology Associations, 22 Teheran-ro 7-gil, Gangnam-gu, Seoul 06130, Korea Tel: +82-2-565-3701, Fax: +82-2-3452-2912
E-mail: [email protected]
■ This research was supported by Support Program for Women in Science, Engineering and Technology through the National Research Foundation of Korea (NRF) funded by the Ministry of Science and ICT (Grant no. 2016H1C3A1903202).
Copyright ⓒ 2018 The Korean Society of Health Promotion and Disease Prevention
This is an Open Access article distributed under the terms of the Creative Commons Attribution Non-Commercial License (http://creativecommons.org/licenses/by-nc/3.0/) which permits unrestricted noncommercial use, distribution, and reproduction in any medium, provided the original work is properly cited.
Introduction
The selection of an appropriate food list during the devel- opment of food frequency questionnaires (FFQs) is essential for adequate assessment of the dietary intake of study populations.1,2) Such a list should include not only foods that are major sources of nutrients, but also those that are important with respect to between-person variance in intake
Characteristic Total
(n=7,952) Men
(n=3,250) Women
(n=4,702) Pa
Age, y 43.4±12.4 43.3±12.5 43.5±12.3 0.3736
Age group
19-29 years 1,237 (15.6) 523 (16.1) 714 (15.2) 0.4030
30-49 years 3,830 (48.2) 1,571 (48.3) 2,259 (48.0)
50-64 years 2,885 (36.3) 1,156 (35.6) 1,729 (36.8)
Residential areab
Rural 1,385 (17.4) 616 (19.0) 769 (16.4) 0.0005
City 2,980 (37.5) 1,244 (38.3) 1,736 (36.9)
Metropolitan 3,587 (45.1) 1,390 (42.8) 2,197 (46.7)
Household income, monthly, won
≤2,000,000 1,939 (24.5) 717 (22.2) 1,222 (26.1) 0.0009
2,000,000-3,500,000 2,227 (28.1) 944 (29.2) 1,283 (27.4)
3,500,000-5,000,000 1,762 (22.3) 733 (22.6) 1,029 (22.0)
>5,000,000 1,988 (25.1) 843 (26.0) 1,145 (24.5)
Education
Middle school or less 1,445 (21.1) 461 (17.2) 984 (23.6) <0.0001
High school 2,722 (39.7) 1,081 (40.2) 1,641 (39.4)
College or more 2,685 (39.2) 1,144 (42.6) 1,541 (37.0)
Values are mean±standard deviation or number (%).
aDifferences between men and women were analyzed by t-test for continuous variable and by χ2 test for categorical variables.
bResidential area was categorized as rural area (Eup-Myeon area of the administrative district in Korea), city (Dong area in non-metropolitan cities, such as Gyeonggi-do), and metropolitan area (Dong area in metropolitan cities such as Seoul).
Table 1. Descriptions of 6th (2013-2014) Korea National Health and Nutrition Examination Survey whose dietary intake data were included in the present study
of energy and nutrients.2-4)
Individual dietary intakes from dietary survey can be in- fluenced by many factors such as sex, day of the week, and environmental factors including economic status and cul- tural characteristics.5-8) However, among many factors stud- ied, Beaton et al.5), found sex was a major contributing fac- tor in variance of nutrient intakes, but not nutrient density.
We previously reported that only 21 of 196 FFQs re- ported in the literature considered gender, while during de- velopment only 5 (2.6%) took into consideration differences in preferences between men and women.9) In this study, when intake levels obtained using an FFQ were compared with reference amounts for energy and seven nutrients,
‘non-gender-specific FFQ’ overestimated the intake of en- ergy and several nutrients in women, but not in men, where- as a ‘gender-specific FFQ’ underestimated the intake of some nutrients similarly in both sexes.9) Several FFQs have been developed in Korea, but none of them reported considering gender during the development process. Using a gender-in- appropriate food list would likely yield erroneous results;
however, no study has examined this exposure.
There has been no report comparing foods which have high possibility of being included in FFQ items, called can- didate foods, between men and women and the con-
sequences of selecting items for use in dietary assessments without taking gender into consideration. The aims of this study were 1) to compare candidate foods between men and women that have a high contribution to total intake and the variability of intake of energy and nutrients of interest, which are the common criteria of selecting items for FFQ;
2) to analyze the possible inaccuracies in the energy and ma- jor nutrient intake data in men and women.
Methods
1. Data source
One-day 24 hour dietary recall data from 7,952 partic- ipants (men, n=3,250; women, n=4,702), aged 19-64 years and who participated in the 2013-2014 Korea National Health and Nutrition Examination Survey (KNHANES), were used in this study (Table 1). The KNHANES is a na- tionally representative, cross-sectional survey carried out by the Korea Centers for Disease Control and Prevention. The 2013-2014 KNHANES used a stratified, multiple sampling design. Detailed information on KNHANES is available elsewhere (http://knhanes.cdc.go.kr).10) KNHANES was ap- proved by the Korea Centers for Disease Control Prevention
Abbreviation: KNHANES, Korea National Health and Nutrition Examination Survey.
aCandidate foods: foods which have high possibility of being in- cluded in FFQ items, which were identified as foods with high contribution to total energy and major nutrient intakes as well as foods of major sources of between-person variation in energy and nutrient intakes.
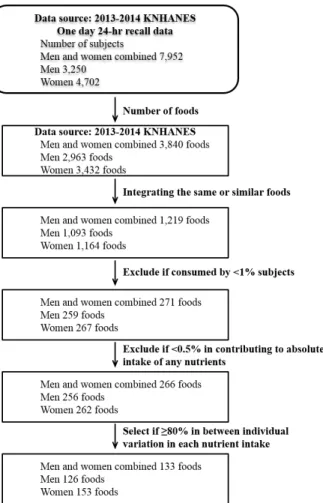
Figure 1. Selection of candidate foods for the food frequency questionnaire (FFQ).a
Institutional Review Board, and informed written consent was provided by all participants.
2. Selection of candidate foods for FFQ
Candidate foods for the FFQ were selected from reported intakes of cooked foods and beverages. The number of food items consumed by participants was 3,840 for total partic- ipants, 2,963 for men, and 3,432 for women. The process of selecting candidate foods followed the database approach used in previous studies (Figure 1).3,11-13) Based on the results from the 2013-2014 KNHANES, intakes of total daily en- ergy and 15 nutrients: protein, fat, saturated fatty acid, poly- unsaturated fatty acid, carbohydrate, calcium, phosphorous,
iron, sodium, potassium, vitamin A, thiamin, riboflavin, nia- cin, and vitamin C from each food were calculated for the total participants and for each gender separately. Candidate foods were identified as foods with high contribution to to- tal energy and major nutrient intakes, as well as foods of major sources of between-person variation in energy and nu- trient intakes among total participants, men, and women.
Before analysis, cooked foods were grouped based on the similarity of their main ingredients, resulting in 1,219 foods for total participants, 1,093 foods for men, and 1,164 foods for women. The similarity of the cooking methods was as- sessed based on the methods used to establish the Han-sik database.14) For example, foods such as “soybean paste soup with radish”, “soybean paste soup with spinach”, “soybean paste soup with fried tofu”, “soybean paste soup with clams”, “soybean paste soup with soybean sprouts”, “soy- bean paste soup with seafood”, “soybean paste soup with pumpkin” were reclassified as “soybean paste soup.”
For the analysis, foods consumed by less than 1% of sub- jects in each group were excluded from the analysis of that group, leaving 271 foods for total participants, 259 foods for men, and 267 foods for women.
The major food sources of absolute nutrient intake were evaluated based on the contribution of each food to total intake (contribution analysis). The percent contributions of each food (“y”) were calculated as follows:
y = Nutrient intake provided by specific food
× 100 Total nutrient intake provided by all food Foods making a contribution of less than 0.5% percent to energy or nutrient intake were excluded from the sub- sequent variance analysis of the contribution to the be- tween-person variation in intake of energy or a specific nutrient.12,13) For the variance analysis, stepwise multiple re- gressions were performed; the total nutrient intake from all foods was included as a dependent variable and the nutrient intake from each of food was included as an independent variable. Cumulative R2 was used to assess the contribution to variability in nutrient intake of each food. Foods that contributed more than 80% of the between-person variation in intake of each nutrient were included separately for total participants, men, and women.12,13)
The candidate foods for the FFQ were classified into 25 categories based on the KNHANES classification of cooked dishes,10) as follows: “cooked rice”, “breads and baked prod-
ucts”, “noodles and dumplings”, “porridges”, “soups”,
“stews”, “steamed food”, “grilled food”, “pan-fried food”,
“stir-fried food”, “braised food”, “fried food”, “cooked and seasoned vegetables”, “seasoned fresh vegetables of other food”, “Kimchi”, “pickled or preserved food”, “seasoning”,
“milk and milk products”, “beverages and tea”, “alcoholic beverages”, “fruits”, “grain, starch and grain products”,
“legumes, nuts and seeds”, “vegetables and seaweeds”,
“meat, poultry and fish”.
3. Evaluation of candidate foods selected for each gender
To evaluate the suitability of candidate foods selected for total participants for assessing the dietary intake of each gender, energy and nutrient intakes from these candidate foods were compared to those of the foods selected for each gender. Therefore, the suitability of candidate foods for men was calculated by comparing the energy and nutrient intakes calculated from candidate foods for total participants to the intakes calculated from the candidate foods for men. The same calculation was done for women. The ratios between the energy and nutrients intakes estimated from the candi- date foods for total participants to the intakes estimated from the candidate foods for each gender were calculated.
Among the study population, participants who did not con- sume any of the candidate foods (men, n=1; women, n=3) were excluded from the nutrient intake comparison; the foods consumed by the three women were included among the candidate foods for dietary data of women but were not among the candidate foods for dietary data of total participants. The ratio was calculated as follows:
Ratio = estimated nutrient intake of a candidate food for all subjects estimated nutrient intake of a candidate food for each gender
4. Statistical analysis
Data are presented as n (%) for categorical variables and as mean±standard deviation for continuous variables.
Nutrient intakes from candidate foods selected for total par- ticipants were compared with intakes from candidate foods selected for each gender, and the significance of differences was determined by paired t-test. The ratios of nutrient in- takes from candidate foods selected for total participants to intakes from candidate foods selected for men only and
women only were calculated. Differences were assessed for significance by t-test. Differences were considered sig- nificant if P<0.05. Data were analyzed using SAS software (ver. 9.4; SAS Institute, Inc., Cary, NC, USA).
Results
Out of the total 7,952 participants included in this analy- sis, 59.1% were women (Table 1). Mean age was similar in men (43.3 years) and women (43.5 years). Men were more likely to be educated and had higher household income than women (P<0.05).
There were 133 candidate foods items for total partic- ipants, 126 for men, and 153 for women (Table 2). The list of 133 candidate foods selected for total participants did not include 15 foods (11.9%) selected for men only and 30 foods (19.6%) selected for women only. When the selected foods were examined by food group, the number and type of foods in only two food groups – grilled dishes and fried dishes – were identical among all three study groups. For other food groups, there were differences in the number and type of foods selected by study group. For example, in the cooked rice food group, 13 types of rice (“dried seaweed rolls”, “rice with barley”, “fried rice”, “fried rice with Kimchi”, “cooked rice with assorted vegetables and meat”, “raw fish on rice”,
“cooked rice”, “rice with assorted grains”, “rice with gluti- nous rice”, “rice with beans”, “rice with assorted grain and beans”, “rice with black rice”, and “rice with brown rice”) were selected for total participants. In contrast, 11 (exclusion of “raw fish on rice” and “rice with glutinous rice”) and 14 (addition of “rice with glutinous millet”) types of rice were selected for men and women, respectively.
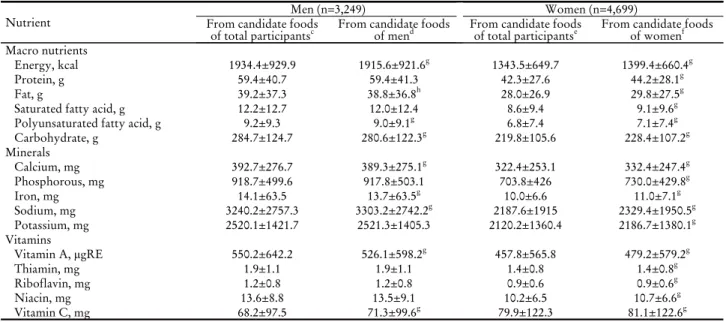
Table 3 shows the mean intakes of each nutrient for men and women, calculated from the candidate foods selected for total participants and those selected for each gender. Intakes of energy, fat, polyunsaturated fatty acid, carbohydrate, cal- cium, iron, and vitamin A calculated from candidate foods selected for total participants were significantly higher than those calculated from candidate foods selected for men (P<0.05). On the contrary, intakes of energy and all nu- trients calculated from candidate foods selected for total participants were significantly lower than those calculated from candidate foods selected for women (P<0.05).
The ratios of nutrient intakes between candidate foods selected for total participants and those selected by gender
Group Total participants
(n=7,952) Men
(n=3,250) Women
(n=4,702)
Cooked rice 13 11 14
Breads and baked products 7 9 11
Noodles and dumplings 9 7 11
Porridges 1 1 2
Soups 4 4 6
Stews 6 6 7
Steamed food 3 3 3
Grilled food 10 10 10
Pan-fried food 3 3 3
Stir-fried food 5 6 8
Braised food 4 3 2
Fried food 4 4 4
Cooked and seasoned vegetables 4 4 5
Seasoned fresh vegetables of other food 4 5 4
Kimchi 5 5 8
Pickled or preserved food 4 3 4
Seasoning 4 7 3
Milk and milk products 5 4 5
Beverages and tea 10 8 12
Alcoholic beverages 3 3 2
Fruits 11 11 11
Grain, starch and grain products 7 2 9
Legumes, nuts, and seeds 3 2 4
Vegetables and seaweeds 3 3 3
Meat, poultry, and fish 1 2 2
Total 133 126 153
aCandidate foods: foods which have high possibility of being included in food frequency questionnaire items, which were identified as foods with high contribution to total energy and major nutrient intakes as well as foods of major sources of between-person variation in energy and nutrient intakes.
Table 2. Number of candidate foods selected among total participants, men, and women in the 2013-2014 Korea National Health and Nutrition Examination Surveya
Nutrient Men (n=3,249) Women (n=4,699)
From candidate foods
of total participantsc From candidate foods
of mend From candidate foods
of total participantse From candidate foods of womenf Macro nutrients
Energy, kcal 1934.4±929.9 1915.6±921.6g 1343.5±649.7 1399.4±660.4g
Protein, g 59.4±40.7 59.4±41.3 42.3±27.6 44.2±28.1g
Fat, g 39.2±37.3 38.8±36.8h 28.0±26.9 29.8±27.5g
Saturated fatty acid, g 12.2±12.7 12.0±12.4 8.6±9.4 9.1±9.6g
Polyunsaturated fatty acid, g 9.2±9.3 9.0±9.1g 6.8±7.4 7.1±7.4g
Carbohydrate, g 284.7±124.7 280.6±122.3g 219.8±105.6 228.4±107.2g
Minerals
Calcium, mg 392.7±276.7 389.3±275.1g 322.4±253.1 332.4±247.4g
Phosphorous, mg 918.7±499.6 917.8±503.1 703.8±426 730.0±429.8g
Iron, mg 14.1±63.5 13.7±63.5g 10.0±6.6 11.0±7.1g
Sodium, mg 3240.2±2757.3 3303.2±2742.2g 2187.6±1915 2329.4±1950.5g
Potassium, mg 2520.1±1421.7 2521.3±1405.3 2120.2±1360.4 2186.7±1380.1g
Vitamins
Vitamin A, μgRE 550.2±642.2 526.1±598.2g 457.8±565.8 479.2±579.2g
Thiamin, mg 1.9±1.1 1.9±1.1 1.4±0.8 1.4±0.8g
Riboflavin, mg 1.2±0.8 1.2±0.8 0.9±0.6 0.9±0.6g
Niacin, mg 13.6±8.8 13.5±9.1 10.2±6.5 10.7±6.6g
Vitamin C, mg 68.2±97.5 71.3±99.6g 79.9±122.3 81.1±122.6g
Values are mean±standard deviation or number (%).
aCandidate foods: foods which have high possibility of being included in food frequency questionnaire items, which were identified as foods with high contribution to total energy and major nutrient intakes as well as foods of major sources of between-person variation in energy and nutrient intakes.
bAmong the participants (men, n=3,250; women, n=4,702), those who did not consume the candidate foods (men, n=1; women, n=3) were ex- cluded from the nutrient intake comparison.
cNutrient intakes among men calculated from candidate foods of total participants.
dNutrient intakes among men calculated from candidate foods of only men.
eNutrient intakes among women calculated from candidate foods of total participants.
fNutrient intakes among women calculated from candidate foods of only women.
gNutrient intakes from candidate foods selected for total participants, and for each gender, were compared by paired t-test (<0.001).
hNutrient intakes from candidate foods selected for total participants, and for each gender, were compared by paired t-test (<0.05).
Table 3. Energy and nutrient intakes from the selected candidate foodsa,b
(a) Macronutrients
<0.0001 <0.0001 <0.0001 <0.0001 <0.0001 <0.0001
(b) Minerals
0.0421 <0.0001 <0.0001 0.0158 <0.0001
(c) Vitamins
<0.0001 0.0182
NS NS NS
Abbreviations: SFA, saturated fatty acid; PUFA, polyunsaturated fatty acid; NS, not significant; FFQ, food frequency questionnaire.
aCandidate foods: foods which have high possibility of being included in FFQ items, which were identified as foods with high contribution to total energy and major nutrient intakes as well as foods of major sources of between-person variation in energy and nutrient intakes.
bRatios of energy and nutrients intakes of candidate foods between total participants and men, and between total participants and women.
cDifferences in ratios between men and women were compared by t-test.
Figure 2. Ratios of energy and nutrient intakes for the selected candidate foods.a-c
ranged from 1.01 to 1.16 for men and from 0.93 to 1.11 for women (Figure 2). Differences in the intake ratios between men and women were significant for all nutrients, with the exception of vitamin A, thiamin, and vitamin C.
Discussion
We identified the possible differences between men and women in dietary assessment based on the candidate foods
for FFQ. Candidate foods selected from the dietary data of the total participants, men only, and women only differed not only in the total numbers but also in the selected food items. Nutrient intakes from candidate foods for total partic- ipants were higher than those from candidate foods for men, and were lower than those from candidate foods for women.
FFQs are the most widely used dietary assessment tools in nutritional epidemiology studies, and development of ap- propriate food lists for these instruments is crucial.15) Food lists should include foods that either make considerable con- tributions to absolute intake or differentiate intake levels be- tween individuals.2-4,15) For instance, a previous study used stepwise regression analysis of dietary data from a target pop- ulation to differentiate intake levels between individuals.15) This is a frequently used method for selecting items for FFQ that meets research objectives and reflects the characteristics of the target population.
Several studies have reported the importance of consider- ing gender when developing FFQs.6,11,16) In a Danish study of FFQ development, all relevant analyses were performed for the study group as a whole, and for men and women separately, to include the foods important for single sex/gender but not for the group as a whole.11) However, the number of different foods that were included to reflect gender differences was not stated. When Block et al.16) de- veloped a short-form dietary questionnaire, age, sex, and race-specific analyses were performed to determine whether any foods important to particular demographic groups had been omitted. However, how the number and type of foods were modified to reflect differences by gender is unknown.
We investigated the possible effects of ignoring differ- ences between men and women when selecting foods for in- clusion in FFQs. Candidate foods selected for total partic- ipants, and for men and women separately, differed not only in total number but also by food group. The characteristics of the target population are important in determining the length and items of FFQs.15) Greater numbers of candidate foods for women implies greater diversity in sources of en- ergy and nutrients. In several studies, women were reported to consume a greater variety of foods than men.17,18)
In this study, the intakes of candidate foods selected for men and women separately were significantly different from the values obtained for total participants, for both energy and all nutrients for women, and for energy and 9 nutrients out of 16 selected nutrients for men. These differences are
reflected by the opposite directions of the ratios of energy and nutrient intakes of candidate foods for total participants compared to those of men only and women only. The ratios for men were >1, while they were <1 for women. The dif- ferences in intake ratios between men and women were sig- nificant for energy and most nutrients. This is presumably because fewer foods were selected for men than for total participants (126 vs. 133); in contrast, the number was much greater for women (153 vs. 133). Difference in the number of food items selected may be partly because differences in the preferences and intakes of foods between men and women. Previous studies of Korean adults have reported differences in food perception and consumption patterns be- tween men and women. Women exhibited a greater prefer- ence for cereal, fruit, fast food, and sweetened foods than men.19,20) Similar differences by gender have also been re- ported in other countries. Women tend to eat more fruits and vegetables than men in the United States and Norway,21,22) and men tend to eat more eggs, sugar, and cer- tain meat products, and drink more alcohol, in the United Kingdom.23) The median intakes of several food groups, as well as specific foods, also differ between men and wom- en;24,25) how these differences may affect dietary assessment conducted with one FFQ is difficult to speculate.
Several limitations should be taken into consideration when interpreting the findings from this study. First, we used 1-day 24 hour recall data of adults from the KNHANES. Therefore, the findings may not represent the usual intake data which are more suitable for developing FFQs. Second, the results may not be generalizable to other age groups or populations with different dietary patterns.
Third, the presented study is theoretical in nature and the obtained food items list were not transferred in FFQ, nor was it validated in a group of patients. In addition, we could not assess the intakes of folate, vitamin D, or dietary fiber, which are of interest in relation to chronic diseases, because no nutrient database on Korean foods is available.
Nevertheless, this study is the first, to our knowledge, on the effects of ignoring differences in food preferences se- lection between men and women when selecting foods for inclusion in an FFQ. There may be systematic errors in di- etary intake assessment using FFQs developed without con- sidering gender, possibly in a different directions for men and women. More studies are required to further assess the effects of gender to foods selection in development of FFQs.
요 약
연구배경: 성별/젠더는 식품 선택 시 영향을 끼치는 중요
한 요인 중 하나이나, 식품섭취빈도조사지 개발 과정 중 식
품/음식 목록 선정 과정에서 거의 고려되지 않는 실정이다.
따라서, 본 연구에서는 식품섭취빈도조사지 개발을 위한 식 품/음식 목록 선정 과정에서 성별/젠더에 따른 차이를 비교 하고, 식품/음식 목록 선정 시 성별/젠더를 고려하지 않았을
때의 잠재적인 오류에 대하여 분석하고자 한다.
방법: 제6기(2013-2014) 국민건강영양조사 식품섭취조사 에 응답한 만 19-64세 성인 7,952명의 자료를 이용하였다.
식품섭취빈도조사지 개발을 위한 상용 식품/음식 목록 추
출 시 식품/음식 목록을 선정하는 주된 방법인 에너지 및 영양소의 급원 분석 및 변이 분석 방법을 적용하여 전체 대 상자, 남자 대상자, 여자 대상자의 세 그룹에서 식품/음식
목록을 추출하고, 선정된 식품/음식에서 비롯된 영양소 섭
취량을 비교하였다.
결과: 전체 대상자로부터 선정된 식품/음식 수는 133종,
남자 대상자로부터 선정된 식품/음식 수는 126종, 여자 대상
자로부터 선정된 식품/음식 수는 153종으로 선정된 항목 수
에서 차이를 보였으며, 선정된 식품/음식의 종류에도 차이 를 보였다. 또한 선정된 식품/음식에서 비롯된 영양소 섭취 량을 비교하였을 때, 전체 대상자 자료에서 비롯된 에너지 및 일부 미량 영양소 섭취량이 남자 대상자 만의 자료에서 비롯된 섭취량보다 유의적으로 높았다. 반면, 여자 대상자에 서는 전체 대상자 자료에서 비롯된 분석한 모든 영양소 섭
취량이 유의적으로 낮아, 성별에 따라 다른 양상을 보였다.
결론: 남자와 여자에서 선정된 주요 식품/음식의 항목수 뿐 아니라 주요 식품/음식의 종류에서 차이가 도출되었다.
따라서, 식품섭취빈도조사지에 포함할 식품/음식의 선정에
서 성별 차이를 고려하지 않으면 성별/젠더에 따른 식생활
차이를 적절히 평가하기 어려울 가능성이 있으며, 특히 차
이의 방향성으로 인한 계통적 오류 발생의 가능성이 있다.
중심 단어: 젠더, 식품/음식 목록 선정, 식품섭취빈도조사지 개발, 식이 평가, 국민건강영양조사
REFERENCES
1. Block G, Dresser CM, Hartman AM, Carroll MD. Nutrient sources in the American diet: quantitative data from the NHANES II survey. I. Vitamins and minerals. Am J Epidemiol 1985;122(1):13-26.
2. Block G, Dresser CM, Hartman AM, Carroll MD. Nutrient sources in the American diet: quantitative data from the NHANES II survey. II. Macronutrients and fats. Am J Epidemiol 1985;122(1):27-40.
3. Block G, Hartman AM, Dresser CM, Carroll MD, Gannon J, Gardner L. A data-based approach to diet questionnaire design and testing. Am J Epidemiol 1986;124(3):453-69.
4. Stryker WS, Salvini S, Stampfer MJ, Sampson L, Colditz GA, Willett WC. Contributions of specific foods to absolute intake and between-person variation of nutrient consumption. J Am Diet Assoc 1991;91(2):172-8.
5. Beaton GH, Milner J, Corey P, McGuire V, Cousins M, Stewart E, et al. Sources of variance in 24-hour dietary recall data: im- plications for nutrition study design and interpretation. Am J Clin Nutr 1979;32(12):2546-59.
6. Ireland P, Jolley D, Giles G, O’Dea K, Powles J, Rutishauser I, et al. Development of the Melbourne FFQ: a food frequency questionnaire for use in an Australian prospective study involv- ing an ethnically diverse cohort. Asia Pac J Clin Nutr 1994;3(1):19-31.
7. Park MK, Kim DW, Kim J, Park S, Joung H, Song WO, et al.
Development of a dish-based, semi-quantitative FFQ for the Korean diet and cancer research using a database approach. Br J Nutr 2011;105(7):1065-72.
8. Hebden L, Kostan E, O’Leary F, Hodge A, Allman-Farinelli M.
Validity and reproducibility of a food frequency questionnaire as a measure of recent dietary intake in young adults. PLoS One 2013;8(9):e75156.
9. Lee H, Kang M, Song WO, Shim JE, Paik HY. Gender analysis in the development and validation of FFQ: a systematic review.
Br J Nutr 2016;115(4):666-71.
10. Korea Centers for Disease Control and Prevention. The sixth Korea National Health and Nutrition Examination Survey (KNHANES VI). [Internet]. Sejong: Ministry of Health and Welfare; 2015. [Accessed June 5, 2018]. Available from:
https://knhanes.cdc.go.kr/knhanes/sub02/sub02_03.do.
11. Overvad K, Tjønneland A, Haraldsdóttir J, Ewertz M, Jensen OM. Development of a semiquantitative food frequency ques- tionnaire to assess food, energy and nutrient intake in Denmark.
Int J Epidemiol 1991;20(4):900-5.
12. Yum J, Lee S. Development and evaluation of a dish-based semi- quantitative food frequency questionnaire for Korean adolescents. Nutr Res Pract 2016;10(4):433-41.
13. Yun SH, Shim JS, Kweon S, Oh K. Development of a food fre- quency questionnaire for the Korea National Health and Nutrition Examination Survey: data from the fourth Korea National Health and Nutrition Examination Survey (KNHANES IV). Korean J Nutr 2013;46(2):186-96.
14. Kang M, Jung HJ, Joung H, Shim JE, Lee SE, Park YH, et al.
Development of Han-sik database utilizing an expert focus group and assessment of Han-sik effects on diet quality. Korean J Food culture 2014;29(1):9-17.
15. Cade J, Thompson R, Burley V, Warm D. Development, vali- dation and utilisation of food-frequency questionnaires - a review. Public Health Nutr 2002;5(4):567-87.
16. Block G, Hartman AM, Naughton D. A reduced dietary ques- tionnaire: development and validation. Epidemiology 1990;1(1):
58-64.
17. Drewnowski A, Henderson SA, Shore AB, Fischler C, Preziosi P, Hercberg S. Diet quality and dietary diversity in France: im- plications for the French paradox. J Am Diet Assoc 1996;96(7):
663-9.
18. Jayawardena R, Byrne NM, Soares MJ, Katulanda P, Yadav B,
Hills AP. High dietary diversity is associated with obesity in Sri Lankan adults: an evaluation of three dietary scores. BMC Public Health 2013;13:314-21.
19. Kim CW, Kim TH. Study on the food selection by analyzing the correlates of perceptions and consumptions frequency of foods.
Korean J Food Culture 2004;19(5):524-31.
20. Hong YH. A study of dietary pattern and food preference of unversity students in Gwangju and Chonnam province. Korean J Food Culture 2008;23(3):318-27.
21. Blanck HM, Gillespie C, Kimmons JE, Seymour JD, Serdula MK. Trends in fruit and vegetable consumption among U.S.
men and women, 1994-2005. Prev Chronic Dis 2008;5(2):1-10.
22. Fagerli RA, Wandel M. Gender differences in opinions and prac-
tices with regard to a "healthy diet". Appetite 1999;32(2):171-90.
23. Bates CJ, Prentice A, Finch S. Gender differences in food and nutrient intakes and status indices from the National Diet and Nutrition Survey of people aged 65 years and over. Eur J Clin Nutr 1999;53(9):694-9.
24. Noh H, Park MK, Lee H, Kim J, Joung H, Paik HY.
Reanalyzing sex/gender specific portion sizes of dish items for a dish-based, semi-quantitative FFQ for Korean adults. Gender Summit 4 in Europe; 2014 June 30 - July 01; Brussels.
25. Nishi N, Horikawa C, Murayama N. Characteristics of food group intake by household income in the National Health and Nutrition Survey, Japan. Asia Pac J Clin Nutr 2017;26(1):156-9.