INTRODUCTION
Mammalian development initiates transcription factor cas- cades and DNA methylation to maintain the orderly transcri- ption of housekeeping and tissue-specific genes (1). During this process, the DNA methyltransferase 3 establishes a geno- me-wide methylation pattern to lock the inactive state of the tissue-specific genes, while the DNA methyltransferase 1 plays a vital role in the maintenance of a tissue-specific methylation pattern (1). In addition, in vivo and vitro adult tissue stud- ies have shown the multi-lineage differentiation of stromal cells derived from fat and bone marrow tissues (2, 3). Specif- ically, marrow stem cells have been found to migrate to gas- tric mucosa infected with Helicobacter pylori, where they then undergo gastric epithelial differentiation (4). Errors in the maintenance of DNA methylation, which occur much more frequent than errors in DNA replication, are believed to cre- ate variations in methylation patterns associated with the pro- cess of tissue development and renewal (5).
CpG-rich islands in germ-line and adult somatic tissues remain unmethylated throughout the lifetime of individuals,
while promoter regions lacking CpG islands are methylated to various degrees (6, 7). Accordingly, the CpG islands usu- ally overlap with the unmethylated promoters of the house- keeping genes, whereas the tissue-specific genes that do not contain CpG islands have methylation-variable sites in their promoter regions (8). The methylation-variable sites that are prone to replication errors have been expected to induce the dynamic process of development and differentiation (9, 10).
However, the relationship between the methylation and tran- scription of individual genes has remained elusive due to the complexity of the methylated CpG position and content (7).
Alu and L1 retroelements are highly repetitive sequences that are dispersed throughout the human genome as a result of long-term evolution (11). Several studies have suggested that the densely methylated retroelements influence the gene expression profiles via methylation-based mechanism (12, 13).
In fact, it has been demonstrated that the transitional area bet- ween the unmethylated promoters and nearby methylated retroelements, such as the margin of the CpG islands and the non-island-CpG sites near the transcription start sites, is me- thylated in a tissue-specific manner (13, 14) (Fig. 1). There-
918
Seung-Jin Hong1,*, Moo-Il Kang2,*, Jung-Hwan Oh2, Yu-Chae Jung1, Young-Ho Kim1, Sung-Ja Kim1, Seung-Hye Choi3, Eun-Joo Seo4, Sang-Wook Choi2, and Mun-Gan Rhyu1
Departments of Microbiology1, Internal Medicine2, Surgery3, and Clinical Pathology4, College of Medicine, The Catholic University of Korea, Seoul, Korea
*Seung-Jin Hong and Moo-Il Kang contributed equally to this work.
Address for correspondence Mun-Gan Rhyu, M.D.
Department of Microbiology, College of Medicine, The Catholic University of Korea, 505 Banpo-dong, Seocho-gu, Seoul 137-701, Korea
Tel : +82.2-590-1215, Fax : +82.2-596-8969 E-mail : [email protected]
This work was supported by grants 2006005041 from Catholic Institute of Cell therapy Basic Science Programs Foundation made in the program year of 2006.
DOI: 10.3346/jkms.2009.24.5.918
DNA Methylation and Expression Patterns of Key Tissue-specific Genes in Adult Stem Cells and Stomach Tissues
CpG-island margins and non-island-CpG sites round the transcription start sites of CpG-island-positive and -negative genes are methylated to various degrees in a tissue-specific manner. These methylation-variable CpG sites were analyzed to delin- eate a relationship between the methylation and transcription of the tissue-specific genes. The level of tissue-specific transcription was estimated by counting the num- ber of the total transcripts in the SAGE (serial analysis of gene expression) database.
The methylation status of 12 CpG-island margins and 21 non-island CpG sites near the key tissue-specific genes was examined in pluripotent stromal cells obtained from fat and bone marrow samples as well as in lineage-committed cells from marrow bulk, stomach, colon, breast, and thyroid samples. Of the 33 CpG sites examined, 10 non-island-CpG sites, but none of the CpG-island margins were undermethy- lated concurrent with tissue-specific expression of their nearby genes. The net methy- lation of the 33 CpG sites and the net amount of non-island-CpG gene transcripts were high in stomach tissues and low in stromal cells. The present findings suggest that the methylation of the non-island-CpG sites is inversely associated with the ex- pression of the nearby genes, and the concert effect of transitional-CpG methylation is linearly associated with the stomach-specific genes lacking CpG-islands.
Key Words : DNA Methylation; Stem Cells; Stomach; Tissue-Specific Gene; CpG Islands
Received : 4 February 2009 Accepted : 1 July 2009
fore, the variable methylation of the transitional-CpG sites is likely to mediate the regulation of cell differentiation.
To delineate the methylation patterns of the key tissue-spe- cific genes in pluripotent cells and lineage-committed tissues, the methylation-variable sites of housekeeping genes with CpG islands and tissue-specific genes without CpG islands were examined using seven adult tissues including fat and bone marrow stromal cells and gastrointestinal tissues. The non-island-CpG sites of the genes lacking CpG islands in sto- mach tissues tended to be undermethylated in a pattern con- sistent with the stomach-specific strong expression of their nearby genes. In addition, there was a linear association bet- ween the net methylation of the transitional-CpG sites and the expression of tissue-specific genes without CpG islands.
This suggests that the methylation of the transitional-CpG sites has both negative individual and positive concert effects on the expression of the stomach-specific genes lacking CpG islands.
MATERIALS AND METHODS Adult stromal and glandular tissue preparation
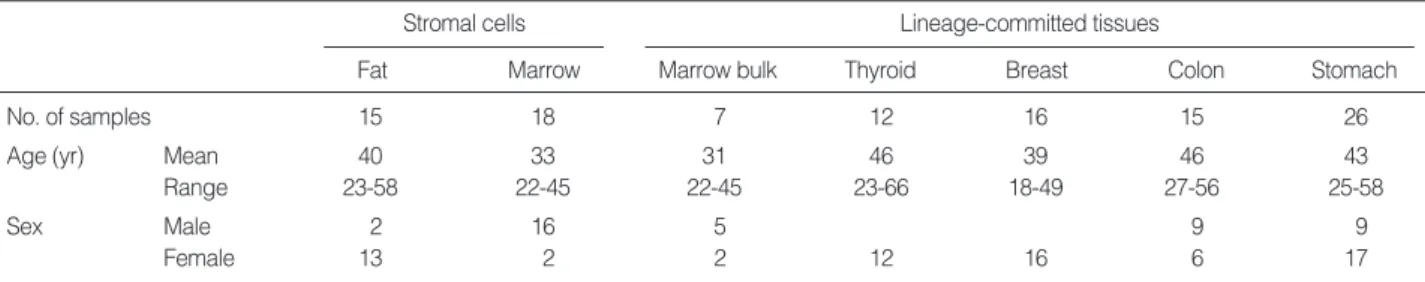
Stromal cells from 15 fat and 18 bone marrow samples, 7 marrow bulk samples, and glandular tissue samples from 12 thyroids, 16 breasts, 15 colons, and 26 stomachs were collect- ed from 41 males and 68 females between 18 and 66 yr old during September 2005 and January 2007 (Table 1). The In- stitutional Review Board approved this study and the writ- ten informed consent was obtained from each individual that
provided samples (Document number 48, ‘Genetic study of gastrointestinal cancer’, January 28, 2005, St. Paul’s Hospi- tal, The Catholic University of Korea, Seoul, Korea). Fat tis- sues and bone marrow aspiration samples were cultured for the preparation of stromal cells using a previously described method (10). The cell pellets isolated from marrow aspiration specimens were used as marrow bulk cells. The glandular tis- sues of the thyroid and breast were dissected microscopical- ly from surgically resected adenoma tissues. Normal mucosa of the colon and stomach antrum and body separated by a 5- cm distance were obtained by endoscopic biopsy. The pres- ence of H. pylori in normal stomach mucosa was confirmed using the Warthin-Starry silver impregnation method. Frozen or fresh tissues were then digested in a Tween 20-Proteinase K lysis buffer for 12 hr at 50℃, after which the genomic D- NA was extracted using a DNA isolation Kit (A1120, Pro- mega, Madison, WI, U.S.A.) according to the manufactur- er’s instruction.
DNA modification with sodium bisulfite
Bisulfite conversion of the genomic DNA extracted from the fresh tissue was performed as described previously (10, 14). Briefly, 1 μg of genomic DNA was denatured with 10 μL of 3 M NaOH for 15 min at 37℃prior to modification with sodium bisulfite. Next, 100 μL of the denatured DNA was treated with 1,040 μL of 2.3 M sodium bisulfite and 60 μL of 10 mM hydroquinone for 12 hr at 50℃. The modified DNA was then purified using a Wizard DNA purification resin (Promega), after which it was precipitated with ethanol and then dissolved in 35 μL of 5 mM Tris buffer (pH 8.0). A 1 μL aliquot of the modified DNA solution was then placed in a 200 μL microcentrifuge tube and stored at -20℃until further analysis.
Radioisotope-labeling methylation-specific PCR analysis
Methylation-specific PCR (MSP) primer sets designed to contain a GC content >40% and 3 to 5 CpG dinucleotides near the 3′-position. The MSP sites are shown in Fig. 2. All the MSP primer sets covered a short amplicon of ≤150 bp and a small number of CpG dinucleotides. These CpG-poor MSP sites reduced the difference in GC content between the
Stromal cells
Fat Marrow
Lineage-committed tissues
Marrow bulk Thyroid Breast Colon Stomach
No. of samples 15 18 7 12 16 15 26
Age (yr) Mean 40 33 31 46 39 46 43
Range 23-58 22-45 22-45 23-66 18-49 27-56 25-58
Sex Male 2 16 5 9 9
Female 13 2 2 12 16 6 17
Table 1. Adult stromal cells and lineage-committed tissues examined for tissue-specific methylation
Non-island CpGs
5′
3′
5′ 3
′
Transcriptional start sites
Retroelement Methylation
Retroelement Methylation CpG island CpG-island
margins
Fig. 1. A schematic diagram of the methylation-variable CpG sites in transitional-CpG sites close to transcriptional start sites (TSS).
The transitional-CpG sites are distinguished from so-called T-DMRs (tissue-dependent differentially methylated regions) widespread in the human genome regardless of gene-control regions.
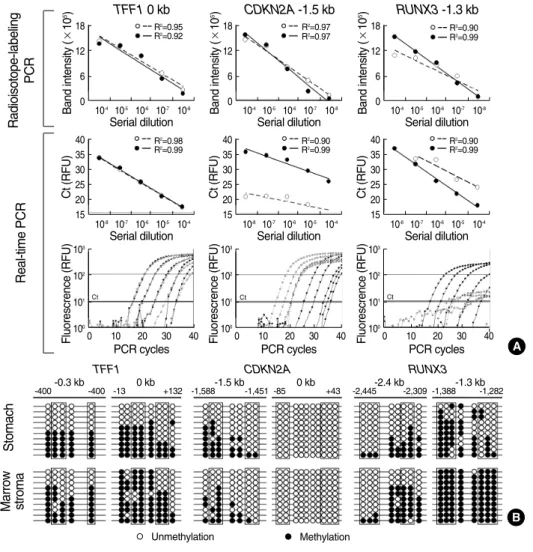
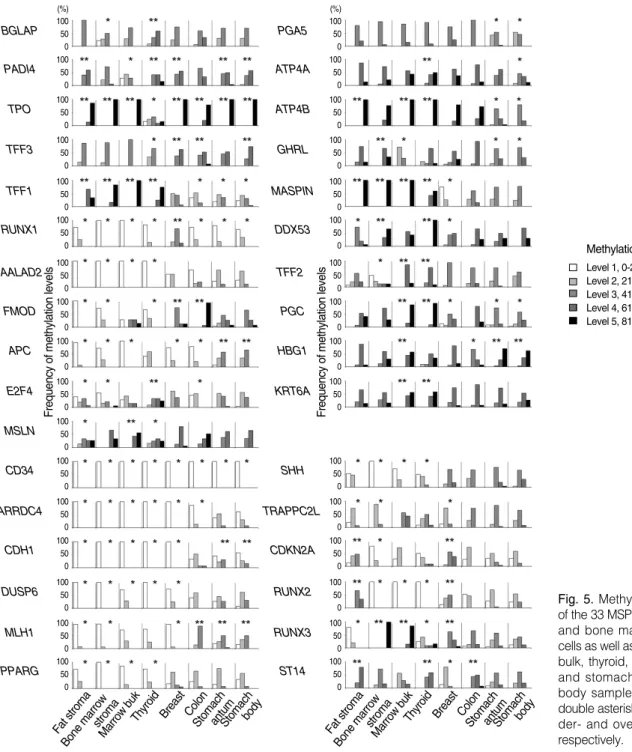
unmethylated and methylated DNA following bisulfite mod- ification, and then allowed the linear amplification of the un- methylated and methylated sequences under a stringent PCR condition (Fig. 3A).
Repeated radioisotope-labeling experiments have demon- strated that the dTTP-radioisotope, in conjunction with a low concentration of dNTP, produces a balance of PCR band in- tensities from the same amount of unmethylated and methy- lated DNA (14-16). Finally, a 1 μL of bisulfite-modified DNA was labeled with 1 μCi of α-32P dTTP (PerkinElmer, Boston, MA, U.S.A.) in 10 μL PCR mixture that contained 62.5 μM of dATP, dCTP and dGTP, 25 μM of dTTP, 0.5 pM of each primer, 0.1% Tween 20, and 0.06 μL of Taq polymerase (5 U/μg, R001, Takara, Shiga, Japan). This mixture was sub- jected to 32 PCR cycles under a hot start condition to reach sub-plateau DNA amplification. The band intensity was mea- sured by repeated autoradiography using a radioluminograph scanner (BAS 2500, Fuji Photo Film, Kanakawa, Japan) and the TINA image software (Raytest Isotopenmeβgerate, Strau- benha_rdt, Germany).
The common-PCR primer sets were designed to encompass both the unmethylated and methylated CpGs in the CpG amplicons. Each CpG amplicon was analyzed by cloning and sequencing the common-PCR DNA as previously described (10, 14, 15). The methylation-variable sites estimated by the radioisotope method were similarly confirmed by cloning and sequencing of common PCR products (16) (Fig. 3B). The PCR specificity of each MSP primer set was then validated by plotting a standard curve for a mixture containing differ- ent ratios of the methylated and unmethylated DNA clones.
Next, the density of methylation was calculated as the rela- tive proportion of the methylated-band intensity to the total intensity of unmethylated and methylated bands following a method that has been described elsewhere (10, 14-17). The density of methylation was then reported using the following scale: level 1 (0-20% methylation), level 2 (21-40% methy- lation), level 3 (41-60% methylation), level 4 (61-80% met- hylation), and level 5 (81-100% methylation). The band sharp- ness and reproducibility of wide-range variable methylation were improved with the radioisotope-labeling protocol when compared with the non-radioisotope PCR bands including real-time PCR and with the results of common PCR DNA sequencing (Fig. 3, 4). The radioisotope-labeling amplification of bisulfite-modified DNA was found to reproduce the same levels of band intensities in >95% of 20 experiments conduct- ed using the duplicated DNAs for each MSP primer set.
Tissue-specific transcription estimated using in-silico data
A total of 17,723 reference genes identified in a public data- base (http://genome.ucsc.edu/, March 2006 assembly) were analyzed to calculate the GC percent and CpG content in a 6-kb segment spanning from 5-kb upstream to 1-kb down- stream of the transcription start site. Genes with a CpG ratio of >0.75 were categorized as high-CpG genes, whereas those with a CpG ratio of <0.48 were categorized as low-CpG genes and those with a CpG ratio of 0.48 to 0.75 were classified as intermediate-CpG genes. There were 12,220 high-CpG genes (69%), 2,685 intermediate-CpG genes (15%), and 2,818 low- CpG genes (16%).
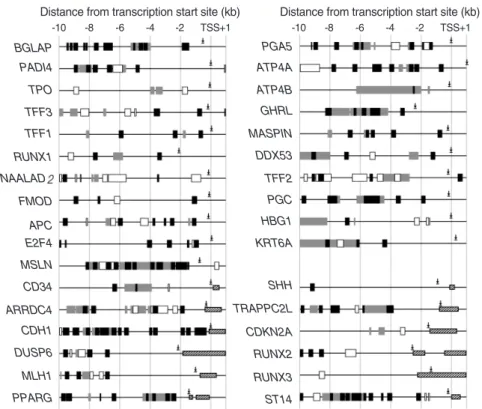
NAALAD FMOD
APC E2F4 MSLN CD34 ARRDC4 CDH1 DUSP6 MLH1 PPARG RUNX1 TFF1 TFF3 TPO PADI4 BGLAP
-10
Distance from transcription start site (kb)
-8 -6 -4 -2 TSS+1
TFF2 PGC HBG1 KRT6A
SHH TRAPPC2L CDKN2A RUNX2 RUNX3 ST14 DDX53 MASPIN GHRL ATP4B ATP4A PGA5
-10
Distance from transcription start site (kb)
-8 -6 -4 -2 TSS+1
Retroelements:
Alu L1 LTR CpG island MSP primer site transcription start siste TSS
Fig. 2. Schematic diagram of methylation- variable sites and retroelements in the 5’- end regions of the 33 genes examined.
Methylation-variable CpG sites were con- firmed to be related to the expressed tran- script tags in the case of alternative splic- ing variants.
To clarify the activity of tissue-specific transcription, we analyzed the SAGE data estimating the number of expressed sequence tags (i.e. transcript) as well as the microarray data estimating the intensity of transcript hybridization signal.
The SAGE database (http://www.ncbi.nlm.nih.gov/SAGE/) provided the absolute number of expressed tags for genes in embryonic stem cells, bone marrow cells with CD34+/CD38-, marrow bulk, thyroid, mammary gland, colon, and stomach
Level 3 Level 3 Level 5 Level 3 Level 3 Level 3 Level 3 Level 3 Level 3 Level 3 Level 2 Level 1
U M U M U M U M U M U M
BGLAP
U M U M U M U M U M U M
PADI4 TPO TFF3 TFF1 PGA5
BGLAP PADI4 TPO TFF3 TFF1 PGA5
ATP4A ATP4B GHRL MASPIN RUNX1 NAALAD2
ATP4A ATP4B GHRL MASPIN RUNX1 NAALAD2 Level 4 Level 3 Level 2 Level 3 Level 4 Level 2 Level 4 Level 5 Level 4 Level 1 Level 1 Level 3
U M U M U M U M U M U M
FMOD
U M U M U M U M U M U M
APC E2F4 MSLN DDX53 TFF2 PGC HBG1 KRT6A CD34 ARRDC4 CDH1
E2F4 MSLN DDX53 TFF2 PGC HBG1 KRT6A CD34 ARRDC4 CDH1 Level 3 Level 3 Level 2 Level 3 Level 3 Level 2 Level 2 Level 3 Level 3
U M U M U M U M U M U M
DUSP6
U M U M U M
MLH1 PPARG SHH TRAPPC2LCDKN2A RUNX2 RUNX3 ST14
DUSP6 MLH1 PPARG SHH TRAPPC2LCDKN2A RUNX2 RUNX3 ST14
U M U M U M U M U M U M U M U M U M U M U M U M m
FMOD APC
U M U M U M U M U M U M U M U M U M U M U M U M m
U M U M U M U M U M U M U M U M U M m
Radioisotope-labeling PCRNon-radioisotope PCR
200 bp 100 bp
200 bp 100 bp
200 bp 100 bp
Fig. 4. Autoradiograph and ethidium bromide staining of electrophoretic bands of 33 methy- lation-variable sites examined in stomach tis- sue. The level of methylation is indicated below each pair of unmethylation (U) and methylation (M) PCR bands.
Fig. 3. Standard curves (A) and common PCR DNA sequenc- ing (B) at methylation-variable sites nearest to the TFF1, CDK- N2A, and RUNX3 genes. (A) The cycle threshold (Ct) is cal- culated with relative fluorescen- ce unit (RFU). (B) The box indi- cates the MSP primer position.
Band intensity (×105) Radioisotope-labeling PCRReal-time PCRStomach
18 12 6
0 10-4 10-5 10-6 10-7 10-8 Serial dilution
R2=0.95 R2=0.92
TFF1 0 kb
Band intensity (×105) 18 12 6
0 10-4 10-5 10-6 10-7 10-8 Serial dilution
R2=0.97 R2=0.97
CDKN2A -1.5 kb
Band intensity (×105) 18 12 6
0 10-4 10-5 10-6 10-7 10-8 Serial dilution
R2=0.90 R2=0.99
Ct (RFU)
40 35 30 25 20 15
10-8 10-7 10-6 10-5 10-4 Serial dilution
R2=0.98 R2=0.99
Fluorescrence (RFU)
103 102 101 100
0 10 20 30 40
PCR cycles Fluorescrence (RFU) 103 102 101 100
0 10 20 30 40
PCR cycles Fluorescrence (RFU) 103 102 101 100
0 10 20 30 40
PCR cycles
Ct (RFU)
40 35 30 25 20 15
10-8 10-7 10-6 10-5 10-4 Serial dilution
R2=0.90 R2=0.99
Ct (RFU)
40 35 30 25 20 15
10-8 10-7 10-6 10-5 10-4 Serial dilution
R2=0.90 R2=0.99
RUNX3 -1.3 kb
A
B
-400-0.3 kb-400
TFF1
Unmethylation
CDKN2A RUNX3
-13 0 kb +132
-1,588-1.5 kb-1,451
-85 0 kb +43
-2,445-2.4 kb-2,309
-1,388-1.3 kb-1,282
Marrow stroma
Methylation
antrum and body. The sum of the expressed tags was direct- ly used as a quantitative measure for the corresponding gene activity. Microarray data (GEO, http://www.ncbi.nlm.nih.gov/
geo/ and MIAME, http://www.ebi.ac.uk/arrayexpress/) were used to analyze the gene expression profiles of fat and bone marrow stromal cells and breast, thyroid, colon and stomach tissues. For the microarray analysis, each dataset was median centered and the standard deviation was then normalized to one per array. Based on the highest number of transcripts in a given tissue as well as by reviewing available literature re- garding their roles in cell differentiation, the 33 genes for MSP study were classified into 27 tissue-specific genes and 5 house- keeping genes (Table 2, 3). The housekeeping genes were found to be similarly expressed or inactive in various tissue
types.
Statistical analysis
An independent t test was used to determine if there were any significant differences in the level of methylation between 1) the CpG sites associated and not associated with their near- by gene expression, 2) H. pylori-infected and non-infected gastric mucosa, and 3) stromal cells and lineage-committed tissues. Statistical analysis was conducted using the SPSS ver.
11.0 software. Two-sided P values <0.05 were considered to be statistically significant.
CpG island*
CpG content in 6-kb promoter
region� Gene
No. of expressed sequences tags
Embryonic stem cell
Marrow CD34+/
CD38-
Marrow CD34+/
CD38+
Marrow
bulk Thyroid Breast Colon Stomach antrum
Stomach body
BGLAP No Low 1 2
PADI4 No Low 2 1
TPO No Intermediate 108 1
TFF3 No Low 3 1 329 14 103 14 1
TFF1 No Intermediate 1 165 186 11 95
PGA5 No Low 2 1 2 734 4,145
ATP4A No Low 1 3 1 1 1 175 83
ATP4B No Intermediate 1 43 48
GHRL No Low 3 30
MASPIN No Intermediate 1
RUNX1 No Low 1 5 1 2 11 2 1
NAALAD2 No Intermediate 4 2 2 39 3 1 3 1
FMOD No Low 1 25 5 30 6
APC No Intermediate 3 1 6 2 2
E2F4 No Intermediate 6 9 9 4 8 2 3 13 5
MSLN No Intermediate 1 50
DDX53 No Intermediate 2 1
TFF2 No Low 1 1 632 116
PGC No Low 2 3 2 1 1 33 348
HBG1 No Low 1 2 2
KRT6A No Low 4 1 1 8 2 3 2 1
CD34 Yes High 4 1 1 8 2 3 2 1
ARRDC4 Yes High 4 1 1 1 1 5 7
CDH1 Yes High 31 9 1 41 19 43 19 15
DUSP6 Yes High 7 5 4 5 27 3 8 8 1
MLH1 Yes High 5 1 1 1
PPARG Yes High 1 5 3
SHH Yes High 2
TRAPPC2L Yes High 21 10 5 9 3 14 1
CDKN2A Yes Intermediate 2 1 2 1 1 1
RUNX2 Yes High 1
RUNX3 Yes Intermediate 3 1
ST14 Yes High 3 2 3 2 1 41 1
Table 2. Expression patterns of key tissue-specific genes in pluripotent cells (embryonic stem cell and hematopoietic progenitor cells) and lineage-committed tissues (marrow bulk, thyroid, breast, colon, and stomach)
*More than 50% GC percent, greater than 200 bps length, and over 0.6 ratio of observed to expected number of CpG dinucleotide to the expected G+C number (http://genome.ucsc.edu). The length and position of CpG island are different at each gene; �Classification of CpG content is described in Materials and Methods section.
RESULTS
Expression profiles of key tissue-specific genes
The number of transcripts of the 33 genes evaluated by ana- lyzing the SAGE data is listed in Table 2. The eight genes lacking CpG islands (TPO, PGA5, ATP4A, ATP4B, NAA- LAD2, MSLN, TFF2, and PGC) were strongly expressed in a single type of glandular tissues derived from the endoderm layer. Both the TFF1 and TFF3 genes without CpG islands tended to be commonly expressed in glandular tissues. Al- though the BGLAP, PADI4, MASPIN, RUNX1, and APC genes lacking CpG islands and the CD34, PPARG, SHH, RUNX2, and RUNX3 genes containing CpG islands are well-
known to be expressed in a tissue-specific manner, the SAGE data showed a low-number or no expressed tags correspond- ing to these genes in any of the tissues examined here. Con- sequently, the SAGE data counting the absolute number of transcripts demonstrated that the expression of stomach-spe- cific genes lacking CpG islands was remarkably strong when compared with other tissue-specific genes.
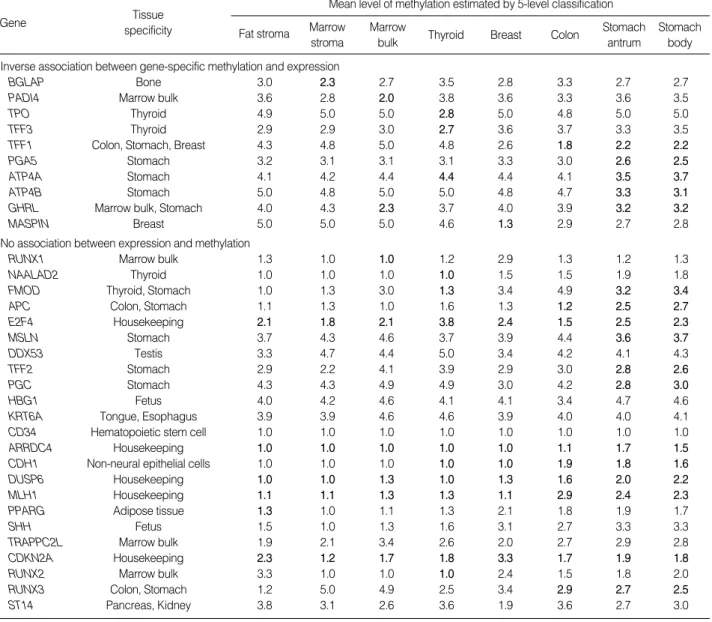
Tissue-specific methylation associated with tissue-specific gene expression
The methylation density of methylation-variable sites was calculated using the 5-level classification of CpG amplicon (Fig. 5). The 21 non-island-CpG sites close to the transcrip-
Tissue specificity Gene
Mean level of methylation estimated by 5-level classification
Fat stroma Stomach
body Stomach
antrum Colon
Breast Thyroid
Marrow bulk Marrow
stroma Inverse association between gene-specific methylation and expression
BGLAP Bone 3.0 2.3 2.7 3.5 2.8 3.3 2.7 2.7
PADI4 Marrow bulk 3.6 2.8 2.0 3.8 3.6 3.3 3.6 3.5
TPO Thyroid 4.9 5.0 5.0 2.8 5.0 4.8 5.0 5.0
TFF3 Thyroid 2.9 2.9 3.0 2.7 3.6 3.7 3.3 3.5
TFF1 Colon, Stomach, Breast 4.3 4.8 5.0 4.8 2.6 1.8 2.2 2.2
PGA5 Stomach 3.2 3.1 3.1 3.1 3.3 3.0 2.6 2.5
ATP4A Stomach 4.1 4.2 4.4 4.4 4.4 4.1 3.5 3.7
ATP4B Stomach 5.0 4.8 5.0 5.0 4.8 4.7 3.3 3.1
GHRL Marrow bulk, Stomach 4.0 4.3 2.3 3.7 4.0 3.9 3.2 3.2
MASPIN Breast 5.0 5.0 5.0 4.6 1.3 2.9 2.7 2.8
No association between expression and methylation
RUNX1 Marrow bulk 1.3 1.0 1.0 1.2 2.9 1.3 1.2 1.3
NAALAD2 Thyroid 1.0 1.0 1.0 1.0 1.5 1.5 1.9 1.8
FMOD Thyroid, Stomach 1.0 1.3 3.0 1.3 3.4 4.9 3.2 3.4
APC Colon, Stomach 1.1 1.3 1.0 1.6 1.3 1.2 2.5 2.7
E2F4 Housekeeping 2.1 1.8 2.1 3.8 2.4 1.5 2.5 2.3
MSLN Stomach 3.7 4.3 4.6 3.7 3.9 4.4 3.6 3.7
DDX53 Testis 3.3 4.7 4.4 5.0 3.4 4.2 4.1 4.3
TFF2 Stomach 2.9 2.2 4.1 3.9 2.9 3.0 2.8 2.6
PGC Stomach 4.3 4.3 4.9 4.9 3.0 4.2 2.8 3.0
HBG1 Fetus 4.0 4.2 4.6 4.1 4.1 3.4 4.7 4.6
KRT6A Tongue, Esophagus 3.9 3.9 4.6 4.6 3.9 4.0 4.0 4.1
CD34 Hematopoietic stem cell 1.0 1.0 1.0 1.0 1.0 1.0 1.0 1.0
ARRDC4 Housekeeping 1.0 1.0 1.0 1.0 1.0 1.1 1.7 1.5
CDH1 Non-neural epithelial cells 1.0 1.0 1.0 1.0 1.0 1.9 1.8 1.6
DUSP6 Housekeeping 1.0 1.0 1.3 1.0 1.3 1.6 2.0 2.2
MLH1 Housekeeping 1.1 1.1 1.3 1.3 1.1 2.9 2.4 2.3
PPARG Adipose tissue 1.3 1.0 1.1 1.3 2.1 1.8 1.9 1.7
SHH Fetus 1.5 1.0 1.3 1.6 3.1 2.7 3.3 3.3
TRAPPC2L Marrow bulk 1.9 2.1 3.4 2.6 2.0 2.7 2.9 2.8
CDKN2A Housekeeping 2.3 1.2 1.7 1.8 3.3 1.7 1.9 1.8
RUNX2 Marrow bulk 3.3 1.0 1.0 1.0 2.4 1.5 1.8 2.0
RUNX3 Colon, Stomach 1.2 5.0 4.9 2.5 3.4 2.9 2.7 2.5
ST14 Pancreas, Kidney 3.8 3.1 2.6 3.6 1.9 3.6 2.7 3.0
Table 3. Methylation patterns of 33 genes examined in fat and bone marrow stromal cells and lineage-committed tissues (marrow bulk, thyroid, breast, colon, and stomach)
Methylation level of tissue-specific gene in the corresponding tissue type is indicated by boldface.
tion start sites of the genes lacking CpG islands tended to be densely methylated at a level of ≥3, whereas the 12 genes containing CpG islands were weakly methylated at a level of
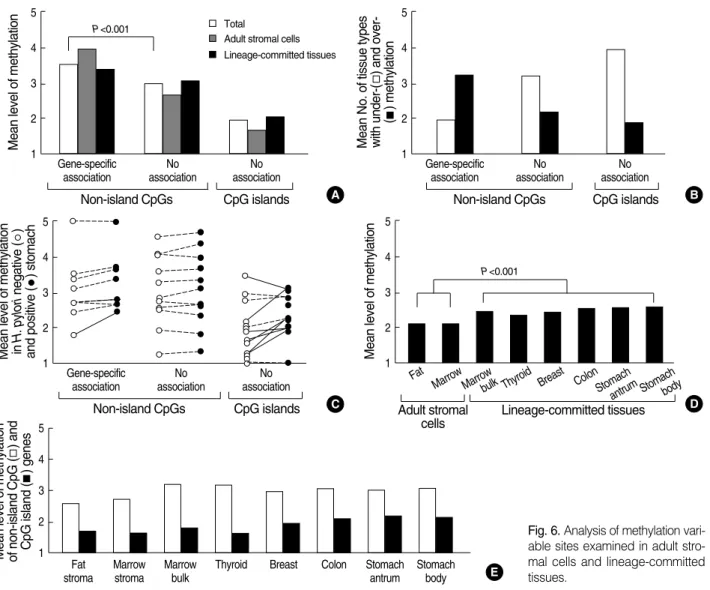
≤3 in all tissue types. The mean methylation level of the non- island-CpG genes was high when compared with that of the CpG-island genes (3.32 vs. 1.95) (Fig. 6A).
The methylation status of each gene in a given tissue type was then scored based on the mean level of methylation esti- mated in each tissue-type samples. If the mean methylation was lowest in the corresponding tissue type, DNA methyla- tion and transcription were considered to have an inverse asso-
ciation. An inverse association between DNA methylation and transcription was observed in 10 non-island-CpG genes, BGLAP, PAD14, TPO, TFF3, TFF1, PGA5, ATP4A, ATP- 4B, GHRL, and MASPIN. However, no inverse association between methylation and transcription was found in any of the CpG-island genes.
These 10 non-island-CpG sites in all of the tissues tended to be more densely methylated when compared with the 11 non-island-CpG sites that were not associated with the expres- sion of their nearby genes (mean level of methylation, 3.55 vs.
2.95, P<0.001) (Fig. 6A). Therefore, the 33 CpG sites were
Fig. 5. Methylation profiles of the 33 MSP sites in the fat and bone marrow stromal cells as well as bone marrow bulk, thyroid, breast, colon, and stomach antrum and body samples. Single and double asterisks indicate un- der- and over-methylation respectively.
BGLAP 10050 0
PADI4
100 50 0
TPO
100 50 0
TFF3 10050 0
TFF1
100 50 0
RUNX1 10050
0
NAALAD2
Frequency of methylation levels
100 50 0
FMOD 10050 0
APC
100 50 0
E2F4
100 50 0
MSLN
100 50 0
CD34 10050
0
ARRDC4 10050 0
CDH1 10050
0
DUSP6
100 50 0
MLH1
100 50 0
PPARG
Fat stroma Bone marrow
stroma Marrow buk
Breast Colon
StomachantumStomach body Thyroid
100 50 0 (%)
PGA5 10050 0
ATP4A
100 50 0
ATP4B
100 50 0
GHRL 10050 0
MASPIN
100 50 0
DDX53 10050
0
TFF2
Frequency of methylation levels
100 50 0
PGC 10050 0
HBG1
100 50 0
KRT6A
100 50 0
SHH 10050
0
TRAPPC2L 10050 0
CDKN2A 10050
0
RUNX2
100 50 0
RUNX3
100 50 0
ST14
Fat stroma Bone marrow
stroma Marrow buk
Breast Colon
StomachantumStomach body Thyroid
100 50 0 (%)
Methylation levels:
Level 1, 0-20%
Level 2, 21-40%
Level 3, 41-60%
Level 4, 61-80%
Level 5, 81-100%
divided into 10 dense-methylation sites inversely associated with the expression of their nearby genes and 23 weak-methy- lation sites, including 11 non-island-CpGs and 12 CpG isl- ands, not associated with the expression of their nearby genes.
When the methylation of each gene was categorized as under- methylated or overmethylated based on the median level of methylation observed in the seven tissue types (Fig. 5), both the weak-methylation genes with and without CpG islands were overmethylated in one or two tissue types (mean num- ber of over- vs. under-methylated tissue types; 1.1 vs. 3.7 and 1.5 vs. 2.7, respectively, Fig. 6B). One (TFF1) of the 21 non- island-CpG genes and six (ARRDC4, CDH1, MLH1, PPA- RG, CDKN2A, and RUNX3) of the 12 CpG-island genes were densely methylated in gastric mucosa infected with H.
pylori when compared with non-infected mucosa (Fig. 6C).
Methylation-transcription relations in stromal cells and lineage-committed tissues
The mean methylation level of the 23 weak-methylation
sites was significantly lower in the fat and marrow stromal cells than in lineage-committed tissues (P<0.001) (Fig. 6D).
In addition, the methylation level of these weak-methylation sites in various tissue samples was high in the following order:
body and antrum of the stomach>colon>bone marrow bulk>
breast>thyroid>stromal cells of fat and bone marrow. The histogenetically related cells such as marrow stroma vs. bulk showed a difference in the methylation level of both non-isl- and-CpG and CpG islands (Fig. 6E). A comparison of glan- dular tissues illustrated that the methylation of CpG islands was high in the following order: stomach>colon>breast>thy- roid.
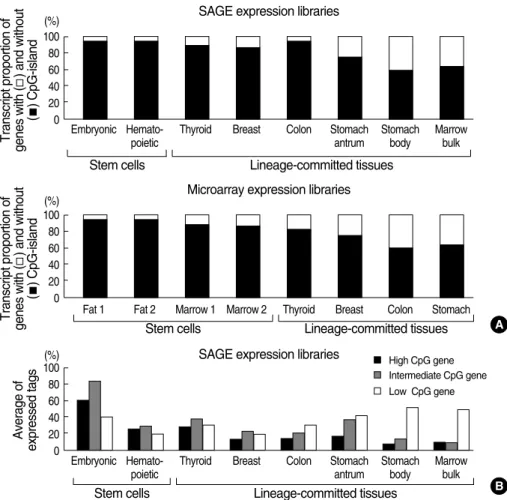
Due to differences in the method of transcription measure- ment between SAGE and microarray analyses, all active genes were sorted in descending order based on their transcription activities and top 2,000 active genes were selected from the SAGE and microarray database (Fig. 7A). The proportion of CpG-island gene transcripts in the total transcripts was high- er in embryonic and hematopoietic stem cells than in marrow bulk and four glandular tissues, stomach, colon, breast, and
A
Mean level of methylation
5
4
3
2
1 Gene-specific No No
association association association Non-island CpGs
P<0.001
CpG islands B
Mean No. of tissue types with under-( ) and over- ( ) methylation 5
4
3
2
1
Mean level of methylation of non-island CpG ( ) and CpG island ( ) genes 5
4
3
2
1
Gene-specific No No
association association association Non-island CpGs
Total
CpG islands
D
E
Mean level of methylation
5
4
3
2
1
Fat Marrow Marrowbulk Thyroid Breast Colon Stomach
antrumStomachbody Adult stromal
cells
Lineage-committed tissues C
Mean level of methylation in H. pylorinegative ( ) and positive ( ) stomach 5
4
3
2
1 Gene-specific No No
association association association
Fat Marrow Marrow Thyroid Breast Colon Stomach Stomach
stroma stroma bulk antrum body
Non-island CpGs CpG islands
P<0.001 Adult stromal cells
Lineage-committed tissues
Fig. 6. Analysis of methylation vari- able sites examined in adult stro- mal cells and lineage-committed tissues.
thyroid. In addition, the microarray data revealed that the expression of CpG-island genes was higher in marrow and fat stromal cells than in the four glandular tissues. The tran- scription of the non-island-CpG genes in the glandular tis- sues that were estimated using both the SAGE and microar- ray data was high in the following order: stomach>colon>
breast>thyroid. When the CpG content of the genes was di- vided into high-, intermediate-, and low-CpG genes (Fig.
7B), the average transcription of low-CpG genes was high- est in the stomach and marrow bulk. Consequently, analyses of tissue-specific gene methylation and transcription and glo- bal gene transcription demonstrated that the expression of non-island-CpG genes was relatively decreased with the net methylation of both non-island-CpGs and CpG islands in bone marrow tissues and was relatively increased with that of CpG islands in glandular tissues.
DISCUSSION
A series of studies have reported that there is an inverse cor- relation between tissue-specific expression and methylation in approximately 30% of genes, most of which have no CpG islands in the gene-control regions (6, 7). However, a large proportion of the high- and low-CpG promoters are unmethy-
lated and methylated, respectively, regardless of their tran- scriptional activities (7). In this study, the 10 key tissue-spe- cific genes that were less methylated and more strongly ex- pressed in a given tissue type were always found to have no CpG islands in the gene-control regions. The mean methy- lation of the key tissue-specific genes estimated in extrane- ous tissue types was denser than that of the remaining 11 non- island-CpG sites and 12 CpG-island margins. Interestingly, the weak methylated of non-island-CpG sites and CpG island margins that were not associated with their nearby gene ex- pression was the lowest in the pluripotent stromal cells and was linearly associated with the relative proportion of non- island-CpG gene expression to CpG-island gene expression in lineage-committed tissues.
It has been suggested that the methylation of retroelements associated with human genome evolution initiates the spread of DNA methylation into the adjacent gene control regions during embryogenesis (12). The tissue-specific genes with- out CpG islands that were close to the retroelements (14) sho- wed an inverse association between gene-specific methylation and expression, and were densely methylated when compared with the genes that were expressed irrespective of their near- by CpG methylation (Table 3 and Fig. 6A). The chromatin structure is closely related to DNA methylation and orga- nizes an intranuclear dynamic network by which the nucle-
A SAGE expression libraries
Stem cells Lineage-committed tissues
Stem cells Lineage-committed tissues
Transcript proportion of genes with ( ) and without ( ) CpG-island 100
80 60 40 20 0 (%)
Fig. 7. The proportion of CpG- island and non-island-CpG gene transcripts in stem cells and lin- eage-committed tissues.
Microarray expression libraries
Transcript proportion of genes with ( ) and without ( ) CpG-island 100
80 60 40 20 0 (%)
Fat 1 Fat 2 Marrow 1 Marrow 2 Thyroid Breast Colon Stomach
Stem cells Lineage-committed tissues B SAGE expression libraries
Average of expressed tags 100
80 60 40 20 0 (%)
Embryonic Hemato- Thyroid Breast Colon Stomach Stomach Marrow
poietic antrum body bulk
Embryonic Hemato- Thyroid Breast Colon Stomach Stomach Marrow
poietic antrum body bulk
High CpG gene Intermediate CpG gene Low CpG gene
ar processes for transcription and replication rapidly respond to cell-intrinsic and -extrinsic stimuli (18). The initial tran- scriptional activation of key tissue-specific genes results in chromatin being remodeled after which transcription factors are recruited to the key gene where a group of genes initiates the formation of a transcription hub (19). The relatively un- dermethylated tissue-specific genes with dense-methylation- CpG sites then likely nucleate the master transcription cen- ter to coordinate gene expression for the developmental tran- scription cascade and cell lineage specification.
The mean level of weak methylated non-island-CpG sites and CpG island margins was found to increase in differenti- ated cells in comparison of marrow stromal versus bulk cells (Fig. 6E) in consistent with a previous study (20). Addition- ally, each weak-methylation site was tissue-specifically over- methylated in one or two tissue types whereas the dense me- thylation site was tissue-specifically undermethylated (Fig.
6B). Therefore, the increased methylation of weak-methyla- tion sites indicated a late epigenetic process following initial activation of master genes with dense-methylation sites. When considering that Polycomb proteins in adult stem cells pro- mote DNA methylation to induce multilineage differentia- tion, which is also known as epigenetic memory module (21), the weak-methylation sites appeared to be further methylat- ed in adult tissues that were under the influence of the epi- genetic memory module.
In this study, the overmethylation of the CpG islands was common in gastric mucosa infected with H. pylori (Fig. 6C) in consistent with a previous report (22). An analysis of the surface-to-gland axis of the H. pylori-infected mucosa revealed that all major gastric genes lacking CpG islands were weak- ly expressed in middle stem-line cells and strongly expressed in surface differentiated cells (23). Given that pluripotent stem cells derived from the bone marrow often undergo gastric epithelial differentiation in gastric mucosa infected with H.
pylori (4), a linear association between weak-methylation sites and non-island-CpG genes observed in this study suggests that the increased methylation of the CpG-island margins up-regulates the inactive or weakly active gastric genes lack- ing CpG islands in the H. pylori-infected mucosa containing marrow cells.
The marrow and fat stromal cells up-regulated the house- keeping genes with CpG island and down-regulated the tis- sue-specific genes without CpG islands in consistent with the transcription-ready state of embryonic stem cells (Fig. 7A), which was also described in a previous study (24). Previous studies have suggested that random changes in the neutral CpG methylation that result from replication errors during DNA methylation are asymmetrically divided among two distinct progeny cells, stem-line and differentiated cells (5, 25). The error-prone changes in gene-regulatory methylation sites might result in an increase or decrease in DNA methy- lation and were selected and expanded depending on their effects on the expression profiles. It is possible that progeny
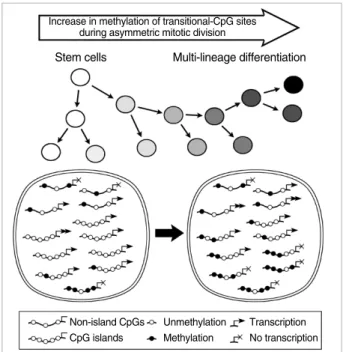
cells that attain a high level of methylation in weak methy- lated CpG sites up-regulate the gastric genes lacking CpG islands during marrow-derived cell differentiation in the gas- tric mucosa, whereas progeny cells with a low level of weak methylation remain in the stem-line lineage (Fig. 8).
The PGA5, PGC, TFF1, TFF2, TFF3, and GHRL genes were expressed more strongly in one of the antrum and body sites (Table 2). In addition, the MUC5AC, MUC5B, and M- UC6 genes lacking CpG islands were found to be weakly ex- pressed in the stem-line cells and strongly expressed in either the surface or bottom differentiated cells of the gastric mucosa (23). Consequently, all the gastric-specific genes had no CpG islands and were complementarily expressed in the two dis- tinctive subsites. This suggests that in the early developmen- tal stage as well as adult tissue environment, the asymmet- rically increased methylation of methylation-variable sites up- regulates the non-island CpG gastric genes in the distinctive subsites (Fig. 8). Although the Polycomb proteins promote histone modifications in adult stem cells, there is a little evi- dence of asynchronous histone modifications (26). Moreover, the newly synthesized DNA in adult tissues was methylat- ed largely independent of histone modifications (27). Taken together, the fine regulation of the non-CpG-island gastric genes for the bifurcation of the stem-line and differentiated cells appears to depend on a DNA methylation-based mech- anism.
Highly expressed genes can organize a master chromatin compartment in the nucleus, in which CpG-poor tissue-spe-
Fig. 8. A schematic diagram of variable methylation created dur- ing asymmetric stem cell division. A progeny cell that attains a low or high level of variable methylation via asymmetric cell division remains a stem-line cell or activates the CpG-poor tissue-specific genes, respectively.
Increase in methylation of transitional-CpG sites during asymmetric mitotic division Stem cells
Non-island CpGs CpG islands
Unmethylation Methylation
Transcription No transcription Multi-lineage differentiation
cific and CpG-rich housekeeping genes share the transcrip- tion machinery for their coordinate regulation (18). In a nucle- ar space that contains the limited amount of nuclear proteins, the low-CpG genes may have a higher probability of using the nuclear proteins in a manner complementary to the high- CpG genes. The increased methylation of weak-methylation sites is likely to decrease the accessibility of a chromatin com- partment to nuclear proteins, thereby allowing the CpG-poor genes to use more nuclear proteins than the high-CpG genes.
Only 16% of the total genes have a low CpG content (based on analysis of SAGE data), which indicates that a large num- ber of weak methylation segments has a strong concert effect on a small number of the tissue-specific genes without CpG islands. In fact, the CpG-poor genes on the active X chromo- some are hypertranscribed when compared with those on the autosomes (28). Therefore, the non-island-CpG gene linear- ly associated with the mean methylation of the 33 transition- al-CpG sites (Fig. 6E), which was less methylated and inac- tive in the marrow stem cells, might be strongly expressed in gastric mucosa and marrow bulk cells as a result of the con- certed effect of the weak-methylation sites.
We compared DNA methylation profiles of 33 selected genes examined in seven tissue types to SAGE data estimat- ing the entire gene transcripts in other samples of the same tissue types. This experimental design is perhaps a potential flaw in credible data showing a direct relationship between the methylation and expression of individual and global genes.
However, the relative proportion of non-island-CpG gene ex- pression to CpG-island gene expression was relatively increa- sed with the mean methylation of the 33 transitional CpG sites near key tissue-specific and housekeeping genes in lin- eage-committed tissues. Both self-organization and dosage- compensation models strongly suggest epigenetic chromo- some structure in which CpG-poor tissue-specific genes and CpG-rich housekeeping genes reciprocally interact with each other. Therefore, at least, it is likely that a set of the selected transitional CpG sites partially reflects tissue-type-dependent methylation levels in different tissue types (12, 13).
A low GC content and repetitive sequence in the methy- lation-variable site limited the template-primer and ampli- con-probe specificities due to the reduced sequence complex- ity of heterogeneously methylated DNA following bisulfite treatment (29). Accordingly, non-radioisotope PCR often sho- wed weak or smearing bands when amplifying the variable- methylation sites (Fig. 4). Additionally, the spotted and var- iegated methylation of transitional-CpG sites varied over a wide range and could not be estimated by high-resolution methods. The 5-level classification of transitional methylation was found to be reproducible using the radioisotope-labeling protocol that was conducted under a stringent PCR condition.
In conclusion, the methylation of tissue-specific genes with- out CpG islands is inversely associated with the expression of their nearby dense-methylation sites. The weak-methyla- tion sites are less methylated concurrent with the weak ex-
pression of the tissue-specific genes in the fat- and marrow- derived stromal cells, and are the most methylated in stom- ach tissues that strongly expressed the non-island-CpG genes.
These findings suggest that the methylation-variable sites can exert the individual and concert effects on the strong expres- sion of the stomach-specific genes without CpG islands.
ACKNOWLEDGMENTS
We wish to thank Tae-Min Kim of Department of Micro- biology of College of Medicine, The Catholic University of Korea, for help with mining and interpretation of microar- ray datasets and comments on the manuscript. The authors have no competing interests.
REFERENCES
1. Li E. Chromatin modification and epigenetic reprogramming in mam- malian development. Nat Rev Genet 2002; 3: 662-73.
2. Zuk PA, Zhu M, Mizuno H, Huang J, Futrell JW, Katz AJ, Benhaim P, Lorenz HP, Hedrick MH. Multilineage cells from human adipose tissue: implications for cell-based therapies. Tissue Eng 2001; 7: 211- 28.
3. Jiang Y, Jahagirdar BN, Reinhardt RL, Schwartz RE, Keene CD, Ortiz- Gonzalez XR, Reyes M, Lenvik T, Lund T, Blackstad M, Du J, Aldrich S, Lisberg A, Low WC, Largaespada DA, Verfaillie CM. Pluripo- tency of mesenchymal stem cells derived from adult marrow. Nature 2002; 418: 41-9.
4. Houghton J, Stoicov C, Nomura S, Rogers AB, Carlson J, Li H, Cai X, Fox JG, Goldenring JR, Wang TC. Gastric cancer originating from bone marrow-derived cells. Science 2004; 306: 1568-71.
5. Yatabe Y, Tavare S, Shibata D. Investigating stem cells in human col- on by using methylation patterns. Proc Natl Acad Sci U S A 2001; 98:
10839-44.
6. Eckhardt F, Lewin J, Cortese R, Rakyan VK, Attwood J, Burger M, Burton J, Cox TV, Davies R, Down TA, Haefliger C, Horton R, Howe K, Jackson DK, Kunde J, Koenig C, Liddle J, Niblett D, Otto T, Pet- tett R, Seemann S, Thompson C, West T, Rogers J, Olek A, Berlin K, Beck S. DNA methylation profiling of human chromosomes 6, 20 and 22. Nat Genet 2006; 38: 1378-85.
7. Weber M, Hellmann I, Stadler MB, Ramos L, Paabo S, Rebhan M, Schubeler D. Distribution, silencing potential and evolutionary impact of promoter DNA methylation in the human genome. Nat Genet 2007;
39: 457-66.
8. Larsen F, Gundersen G, Lopez R, Prydz H. CpG islands as gene mar- kers in the human genome. Genomics 1992; 13: 1095-107.
9. Noer A, Sorensen AL, Boquest AC, Collas P. Stable CpG hypomethy- lation of adipogenic promoters in freshly isolated, cultured, and dif- ferentiated mesenchymal stem cells from adipose tissue. Mol Biol Cell 2006; 17: 3543-56.
10. Kang MI, Kim HS, Jung YC, Kim YH, Hong SJ, Kim MK, Baek KH, Kim CC, Rhyu MG. Transitional CpG methylation between promot-