Organic Phosphorus Decomposition Rates in the Youngsan River and the Sumjin River, Korea
Jahidul Mohammad Islam⋅Bomchul Kim
†⋅Ji-sun Han⋅Jai-ku Kim⋅Yukyong Jung⋅
Sungmin Jung⋅Myoungsun Shin⋅Ju-hyun Park
*Department of Environmental Science, Kangwon National University
*
National Institute of Environmental Research
국내 영산강과 섬진강의 유기인 분해속도
자히둘 이슬람ㆍ김범철
†ㆍ한지선ㆍ김재구ㆍ정유경ㆍ정성민ㆍ신명선ㆍ박주현
*강원대학교 환경과학과
*국립환경과학원
(Received 21 March 2008, Accepted 15 May 2008)
Abstract
The variability in the phosphorus concentrations and the decomposition rates of organic phosphorus were measured in two rivers, the Youngsan River and the Sumjin River through four surveys in June, August and December of 2006 and February of 2007. Water samples were incubated for 20 days in a dark incubator and the change of forms of phosphorus (POP, DOP, DIP) were analyzed. By fitting the change to four types of models the decomposition rates of organic phosphorus were determined.
The mean total organic phosphorus (TOP) decomposition rate coefficients in the Youngsan River and the Sumjin River were 0.036 day
-1and 0.035 day
-1, respectively. In POP→DIP model, the average decomposition rate coefficients in the Youngsan River and the Sumjin River were 0.049 and 0.035 day
-1, respectively. The average POP decomposition rate coefficients of POP→DOP→DIP model were 0.042 day
-1and 0.038 day
-1in the Youngsan River and Sumjin River respectively while the mean DOP decomposition rate coefficients were 0.255 day
-1and 0.244 day
-1, respectively. In the Youngsan River, the mean POP→DOP decomposition rate coefficient and POP→DIP decomposition rate coefficient of POP→DOP→DIP, POP→DIP model were 0.039 day
-1and 0.007 day
-1, respectively. And in the Sumjin River, the above decomposition rate coefficients were 0.031 day
-1and 0.004 day
-1, respectively. The decomposition rate coefficients measured in this study might be applicable for modeling of river water quality.
keywords : Decomposition rate coefficients, Organic phosphorus, Sumjin River, Youngsan River
1. Introduction 1)
The decomposition of organic phosphorus in natural water is determined by a large number of physical driven trans- formation processes. Many of these processes are known in principle but often the decomposition rate can hardly be measured with a sufficient spatial and temporal resolution.
Phosphorus is introduced into the aquatic environment in a number of different forms, and has been described as being present in the dissolved phase as a small fraction of the total and in the particulate phase as a large fraction of the total.
Each fraction is made up of a large number of different components, most of which may change between their dissolved or particulate state. POP and DOP forms undergo bacterial decomposition (mineralization) and the P is
†To whom correspondence should be addressed.
transferred into the soluble orthophosphate pool. Depending on environmental conditions, stored nutrients could be released from organic matrix via mineralization and recycled through the ecosystems or exported from them.
Phosphorus attached to particles (i.e. PP) is not immedi- ately available for growth and a variety of physical, chemical and biological processes influence the bioavail- ability of this P fraction. In general, PP is much more variable than dissolved P. Storm events are extremely important for PP dynamics because large portions of annual stream PP loads can be transported attached to sediment and organic matter during only a few major events (Brett et al., 2005; Long and Cooke, 1978). Decomposition of plant detritus involves stepwise conversion of complex organic molecules to simpler organic and inorganic constituents by processes including abiotic leaching (Benner et al., 1985;
Harrison and Mann, 1975), fragmentation (Boulton and Boon,
1991), extracellular enzymatic hydrolysis (Cunningham and Wetzel, 1989; Linkins et al., 1990), and aerobic and anaerobic catabolic activities of microorganisms (Kerner, 1993; Oremland, 1988). As the disintegration of standing dead material proceeds, DOP and associated nutrients including dissolved organic C and dissolved organic N are released and transported into the water column. On the other hand, water temperature has both economic and ecological significance when considering issues such as water quality and biotic conditions in rivers. Water temperature is one of the parameters that determine the overall health of aquatic ecosystems (Coutant, 1999).
In model calculation of decomposition phenomena, expres- sions are desired that are realistic in terms of both mathe- matical and biological behavior. Mathematical models are valuable tools to investigate the biogeochemical mechanisms and their interactions. Models that are primarily used for quantitatively describing processes relevant to P cycling in the environment, it would be beneficial to include more mechanistic detail. Modeling the decrease in organic P concentrations during decomposition process would be of special interest. Interrelationships between different P frac- tions contain one or more decomposition rate coefficients that are universal in some senses. However, there is a little information available concerning the decomposition rate of organic P and its related constituents. A reasonable predic- tion of water quality for the river requires the decomposition rate of organic P present in the water bodies. The objectives of this study therefore were to assess the decomposition rates of organic P thereby influencing P availability for algal growth in the river water as well as the overall impacts of P in the river ecosystem.
2. Materials and Methods
2.1. Study site
The Youngsan River and the Sumjin River are located in the middle to the southern part of Korea between 35°20' and 35°15' north and between 126° and 127° east.
They have watershed area of 3,522 km
2and 4,897 km
2, respectively. Although the external nutrient loading de- creased in 2000s, the concentrations of P are still elevated.
This is mainly due to ongoing emissions from point and non-point sources. However, in the year of 2006, the total precipitation recorded at the Namwon city near to the Sumjin River was 1381 mm and at the Gwangju city near to the Youngsan River, it was 1520 mm. Half of the annual precipitation concentrated in the summer monsoon.
The ratios of the flow rates between rainy and dry days were very high. The river bank erosions were very low
due to rocky structure predominates near the shoreline in both the rivers. The land uses within the river basin largely consists of residential, industrial, commercial, live- stock, pasture, row crops and forestry and water.
2.2. Sample collection and analysis
Water samples were collected in 50 liters container at 8 sampling sites of each of the Youngsan River and the Sumjin River. The samples were collected in the month of June, August and December of 2006, and February of 2007. Water samples were filtered with 200 μm mesh-sized net and were placed in dark condition at a constant temperature of 20°C for decomposition. In water quality modeling, reaction rates are usually measured at 20°C.
Since decay reactions are temperature-dependent, we mea- sured the DIP, DTP and TP concentrations of the water samples after decomposition at this constant temperature.
All bottles and glasswares used were cleaned with P-free detergent (Extrans), rinsed three times with ultra-pure water (Milli-Q), soaked in 10% (v/v) HCl for at least 24 h, and finally rinsed three times with ultra-pure water. Aliquots of samples were taken from the containers for DIP, DTP and TP analyses. For the measurement of organic P decom- position rate coefficient, DIP, DTP and TP concentrations were measured at 0, 1, 2, 3, 5, 7, 10, 15 and 20 days after the beginning of incubation.
Dissolved and particulate fractions of phosphorus are usually distinguished by filtration through a 0.45 µm mem- brane filter, which separates most bacteria, algae and mineral particles from the dissolved phase but fails to separate colloidal particles. DIP was analyzed after GF/F filtration (0.45 μm) by applying the molybdenum blue method at 880 nm according to APHA (1998). DTP was estimated from filtered samples by measuring DIP after persulfate digestion (APHA, 1998). DOP was obtained by subtracting the DIP from DTP. TP was analyzed from the unfiltered sample as DIP after persulfate digestion and determined by ascorbic acid method according to APHA (1998). POP was calculated by subtracting the DTP from TP.
2.3. Model equations used for determining the decom- position rates of organic P
Various water quality models employ different algorithms
for phosphorus cycles and kinetic equations. In this study
following four different models were employed for simula-
ting phosphorus cycle in river water. Each decay model
was fitted to the data collected from incubation experiment
and rate coefficients were determined by optimization. The
determinations of coefficients were performed by iterative
Runge-Kutta method programmed on EXCEL spreadsheet.
The time step for iterative integration was set to 0.1 day.
Model 1; Total organic phosphorus → dissolved inorganic phosphorus (DIP)
(1)
Where, TOP = total organic phosphorus concentration k
TOP= TOP decomposition rate coefficient [day
-1] t = decomposition time [day]
In the Model 1 organic phosphorus is not divided into any forms, and particulate organic phosphorus and dis- solved organic phosphorus are assumed to be decomposed at the same rate. All the models employed in this study describe first-order reaction kinetics or exponential dec- reases. The assumption underlying the first order reaction kinetics can be expressed in two ways: either the absolute decomposition rate decreases as the amount of remaining substrate declines, or the relative decomposition rate re- mains constant. Intuitively, this assumption corresponds well with our experiences of many biological decay reactions including organic phosphorus decomposition.
Model 2; Particulate organic phosphorus (POP) → dissolved inorganic phosphorus (DIP)
(2)
(3)
Some water quality models employ only particulate or- ganic matter and dissolved organic matter is not simulated as a state variable. In the Model 2 only particulate organic phosphorus is modeled and dissolved organic phosphorus is neglected. Particulate organic material such as plankton is assumed to be decomposed directly into DIP.
Model 3; POP → DOP → DIP
(4)
(5)
(6)
In the Model 3 organic phosphorus was divided into POP and DOP. The basic concept of the model is that during decomposition process POP is first converted into DOP and then DOP is transformed into DIP or SRP (soluble reactive phosphorus).
Model 4; Particulate Organic P → dissolved Organic P → dissolved Inorganic P
k
POP3*
(7)
(8)
(9)
In the Model 4 the pathway from POP to DIP was added to the Model 3. Therefore, POP is decomposed through two pathways; through DOP and directly to DIP.
3. Results and Discussion
3.1. Distribution of organic P and its decomposition The concentration of organic P showed high temporal and spatial variations at any station in both the Youngsan and the Sumjin River. During summer POP was relatively higher than in winter, indicating the storm water effect during summer. The relative fractionations was variable, however, the ratio was influenced strongly by such factors as rainfall and antecedent soil moisture, in addition to soil type and vegetation cover. A number of studies have de- monstrated that riverine P flux is largely attributable to the import of particulate P. In wet seasons nonpoint sources are believed to be the major source of P enrichment in river water, accounting approximately 70% of total sus- pended solids (Choi et al., 1994) and 80% of total P inputs (Kim and Choi, 1996). Changes of agricultural prac- tices may be a remarkable cause of the recent increase of phosphorus in many freshwater ecosystems.
The decomposition of the TOP, POP and DOP behaved
nonlinearly as far as their stabilities in aquatic environ-
ment. Differences in overall decomposition rate of organic
P were attributed to differences in the relative proportions
of the labile and recalcitrant fractions initially present in
each water sample. However, the modeled concentrations
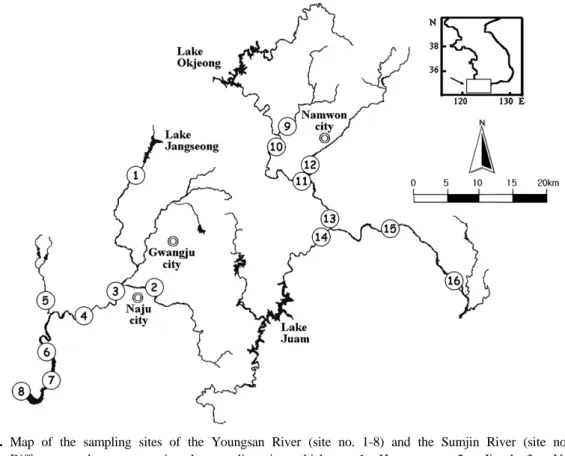
Fig. 1. Map of the sampling sites of the Youngsan River (site no. 1-8) and the Sumjin River (site no. 9-16).
Different numbers representing the sampling sites which are: 1= Hwangryong, 2 = Jiseok, 3 = Naju, 4 = Youngsanpo, 5 = Hampyeong, 6 = Muan, 7 = Lake Youngsan 2, 8 = Lake Youngsan 1, 9 = Osu, 10 = Jeokseong, 11 = Namwon, 12 = Yo, 13 = Gokseong, 14 = Boseong, 15 = Gurye and 16 = Hadong.
of DIP, DTP and TP were consistent with the experi- mental results, although a little bit variation was observed in case of highly polluted water samples.
3.2. Decomposition rate coefficients of POP
In the Model 2, decomposition rate coefficient of POP (k
POP1) was fastest at St. 3 (k= 0.068 day
-1) followed by St. 2 (0.062 day
-1) in the Youngsan River, while the lowest decomposition rate coefficient was at St. 1 and St.
5 (0.033 day
-1) (Table 1). Despite the high organic and inorganic load at St. 6 of the Youngsan River, the lower POP decomposition rate (k
POP1=0.044 day
-1) was observed in this site. During the course of decomposition the decrease of POP coincided well with the increase of DIP even though DOP fraction was not incorporated in this model. It implies that POP decomposition into DOP might have been compensated by the decopmposition of DOP into DIP. And also it implies that the amount of POP decrease and DIP increase were correctly determined. In the Sumjin River, the highest decomposition rate coeffi- cient was at St. 14 (0.057 day
-1) and the lowest value was at St. 12 (0.017 day
-1).
In the Model 3, highest decomposition rate coefficient of POP (k
POP2) was at St. 8 (0.056 day
-1) while the lowest decomposition rate coefficient was at St. 5 (0.032 day
-1) in
the Youngsan River. In the Sumjin River, the highest decomposition rate coefficient of POP was 0.061 day
-1at St. 14 while the lowest was 0.007 day
-1at St. 9 (Table 2).
However, there was no definite trend of the distribution of decomposition rate coefficients observed in this study.
In the Model 4, the decomposition rate coefficient of POP (k
POP3) varied from 0.027 to 0.059 day
-1(Table 4) where the highest value was at St. 2 and the lowest was at St. 5 of the Youngsan River. In case of the Sumjin River, the lowest value of k
POP3was 0.023 day
-1at St. 9 while the highest was 0.043 day
-1at St. 14. In this model, the POP
→DOP decomposition rate coefficient [k
POP3] was much higher than POP→DIP decomposition rate coefficient [k
POP3*]. It explains that the direct mineralization of POP does not occur or may occur at a very slower rate. It may also imply that the common stepwise decomposition model of organic matter is plausible; the hydrolysis of particulate polymers to low molecule DOM, and then to DIC.
However, kinetic data suggest that P is regenerated quite
rapidly during the initial stages of the decomposition pro-
cess (De Pinto and Verhoff, 1977; Golterman, 1972). Phos-
phorus often appears to be released at a more rapid rate
than C is mineralized, as shown by changes in the C: P
ratio of particulate material during the decomposition pro-
cess (Motohashi and Matsudaira, 1968). Some of the P
Table 1. POP decomposition rate coefficient (k
POP1) of POP→DIP model
(Unit: day-1)Sampling Sampling date Mean
site No. June,06 Aug.,06 Dec.,06 Feb.,07
Youngsan River
Main stream
3 0.07 0.078 0.065 0.057 0.068
4 0.021 0.082 0.065 0.04 0.052
6 0.029 0.045 0.048 0.053 0.044
7 0.028 0.063 0.039 0.09 0.055
8 0.031 0.042 0.066 0.055 0.049
Tributaries
1 0.023 0.046 0.042 0.022 0.033
2 0.091 0.047 0.064 0.045 0.062
5 0.021 0.025 0.044 0.04 0.033
Mean 0.028 0.054 0.054 0.050 0.049
Sumjin River
Main stream
10 0.018 0.03 0.016 0.015 0.020
11 0.025 0.029 0.025 0.024 0.026
13 0.055 0.064 0.017 0.045 0.045
15 0.067 0.049 0.039 0.028 0.046
16 0.014 0.043 0.072 0.045 0.044
Tributaries
9 0.009 0.023 0.055 0.026 0.028
12 0.013 0.019 0.021 0.016 0.017
14 0.066 0.075 0.021 0.065 0.057
Mean 0.033 0.042 0.033 0.033 0.035
Table 2. POP decomposition rate coefficient (k
POP2) of POP →DOP→DIP model
(Unit: day-1)Sampling Sampling date Mean
site No. June,06 Aug.,06 Dec.,06 Feb.,07
Youngsan River
Main stream
3 0.069 0.064 0.039 0.041 0.053
4 0.014 0.066 0.059 0.037 0.044
6 0.025 0.034 0.038 0.048 0.036
7 0.025 0.026 0.023 0.061 0.034
8 0.029 0.031 0.085 0.077 0.056
Tributaries
1 0.025 0.048 0.039 0.027 0.035
2 0.062 0.065 0.026 0.032 0.046
5 0.028 0.025 0.035 0.039 0.032
Mean 0.035 0.045 0.043 0.045 0.042
Sumjin River
Main stream
10 0.031 0.048 0.021 0.015 0.029
11 0.062 0.052 0.035 0.029 0.045
13 0.022 0.045 0.035 0.048 0.038
15 0.049 0.042 0.028 0.023 0.036
16 0.023 0.061 0.067 0.045 0.049
Tributaries
9 0.006 0.009 0.005 0.009 0.007
12 0.035 0.043 0.055 0.037 0.043
14 0.081 0.09 0.029 0.043 0.061
Mean 0.039 0.049 0.034 0.031 0.038
released during decomposition appears as free orthophos- phate in the water and probably arises as a result of the release of stored P products during the autolysis process or bacterial lysis (Stewart and Daft, 1976). Although the decomposition rate coefficients of k
POP3* of all the ana- lyzed samples were within the range 0.001 day
-1to 0.017 day
-1, the majority samples showed the lowest decompo- sition rate coefficient (0.001 day
-1). The similar decompo- sition pattern was also observed in the River Sumjin in this decomposition model.
Several studies on the decomposition of organic matter in sediments reported that aerobic decomposition could be faster (Benner et al., 1985; Lee, 1992) or slower (Sun et al., 1993) than anaerobic decomposition. The hydrolysis and fermentation of POP (complex organic P compounds) to DOP and DIP occurs during initial stages of anaerobic decomposition. Many of these compounds can be directly mineralized to inorganic P by microorganisms using nitrate (NO
3-) and sulfate (SO
4-2) as electron acceptors. Aerobic
decomposition of organic matter involves numerous enzy-
Table 3. DOP decomposition rate coefficient (k
DOP2) of POP→DOP→DIP model
(Unit: day-1)Sampling Sampling date Mean
site No. June,06 Aug.,06 Dec.,06 Feb.,07
Youngsan River
Main stream
3 0.5 0.291 0.415 0.1 0.327
4 0.225 0.3 0.192 0.1 0.204
6 0.175 0.43 0.248 0.4 0.313
7 0.101 0.152 0.181 0.146 0.145
8 0.118 0.18 0.3 0.223 0.205
Tributaries
1 0.399 0.245 0.211 0.2 0.264
2 0.298 0.193 0.416 0.342 0.312
5 0.133 0.281 0.268 0.387 0.267
Mean 0.244 0.259 0.279 0.237 0.255
Sumjin River
Main stream
10 0.254 0.223 0.186 0.216 0.220
11 0.1 0.216 0.182 0.3 0.200
13 0.239 0.3 0.252 0.291 0.271
15 0.244 0.224 0.135 0.151 0.189
16 0.183 0.295 0.144 0.213 0.209
Tributaries
9 0.104 0.151 0.152 0.15 0.139
12 0.558 0.146 0.4 0.3 0.351
14 0.295 0.525 0.291 0.4 0.378
Mean 0.247 0.260 0.218 0.253 0.244
Table 4. POP decomposition rate coefficient (k
POP3) of POP →DOP→DIP, POP→DIP model
(Unit: day-1)Sampling Sampling date Mean
site No. June,06 Aug.,06 Dec.,06 Feb.,07
Youngsan River
Main stream
3 0.029 0.048 0.035 0.038 0.038
4 0.038 0.054 0.055 0.035 0.046
6 0.025 0.044 0.048 0.041 0.040
7 0.021 0.048 0.031 0.031 0.033
8 0.028 0.039 0.052 0.043 0.041
Tributaries
1 0.025 0.026 0.032 0.029 0.028
2 0.08 0.045 0.04 0.071 0.059
5 0.021 0.028 0.03 0.03 0.027
Mean 0.033 0.042 0.040 0.040 0.039
Sumjin River
Main stream
10 0.024 0.029 0.031 0.035 0.030
11 0.028 0.036 0.029 0.014 0.027
13 0.019 0.025 0.025 0.034 0.026
15 0.031 0.021 0.028 0.024 0.026
16 0.032 0.031 0.048 0.047 0.040
Tributaries
9 0.01 0.005 0.03 0.048 0.023
12 0.025 0.027 0.031 0.038 0.030
14 0.039 0.069 0.035 0.029 0.043
Mean 0.026 0.030 0.032 0.034 0.031
mes most of which are specific to individual groups of compounds (Furlan and Pant, 2005) and each compound could be rapidly and completely metabolized by a single microorganism (Canfield et al., 1994). Anaerobic microor- ganisms, which are unable to degrade most high molecular weight organic compounds (Jorgensen and Bak, 1991), on the other hand, they may depend on fermentative micro- organisms for the supply of metabolizable low molecular weight compounds (Kristensen et al., 1995). In this study only aerobic decomposition was measured and the rates
might be different in anaerobic conditions. However, anae-
robic condition was not observed in this study and it
seems that production of oxygen by photosynthesis may
overwhelm oxygen depletion. Light can be another factor
affecting decomposition rates of organic matter through
photolysis. Enzymes suppressed with humic substances
(Burns, 1986; Pant and Warman, 2000) can be regenerated
within the ecosystems upon exposure to UV irradiation in
photic zone, and that can be an important factor for the
decomposition of recalcitrant organic matter.
Table 5. DOP decomposition rate coefficient (k
DOP3) of POP→DOP→DIP, POP→DIP model
(Unit: day-1)Sampling Sampling date Mean
site No. June,06 Aug.,06 Dec.,06 Feb.,07
Youngsan River
Main stream
3 0.322 0.294 0.3 0.1 0.254
4 0.317 0.251 0.2 0.31 0.270
6 0.21 0.452 0.4 0.367 0.357
7 0.1 0.145 0.191 0.268 0.176
8 0.1 0.178 0.245 0.187 0.178
Tributaries
1 0.24 0.226 0.195 0.12 0.195
2 0.5 0.188 0.452 0.359 0.375
5 0.198 0.243 0.214 0.3 0.239
Mean 0.248 0.247 0.275 0.251 0.255
Sumjin River
Main stream
10 0.211 0.121 0.285 0.12 0.184
11 0.1 0.264 0.167 0.384 0.229
13 0.241 0.211 0.18 0.171 0.201
15 0.141 0.156 0.156 0.24 0.173
16 0.312 0.229 0.154 0.187 0.221
Tributaries
9 0.291 0.1 0.154 0.2 0.186
12 0.452 0.321 0.275 0.3 0.337
14 0.4 0.442 0.411 0.422 0.419
Mean 0.269 0.231 0.223 0.253 0.244
Table 6. POP decomposition rate coefficient (k
POP3*) of POP→DOP→DIP, POP→DIP model
(Unit: day-1)Sampling Sampling date Mean
site No. June,06 Aug.,06 Dec.,06 Feb.,07
Youngsan River
Main stream
3 0.001 0.001 0.009 0.001 0.003
4 0.001 0.01 0.007 0.001 0.005
6 0.001 0.002 0.017 0.005 0.006
7 0.001 0.001 0.002 0.014 0.005
8 0.001 0.001 0.001 0.09 0.023
Tributaries
1 0.003 0.02 0.001 0.008 0.008
2 0.004 0.008 0.001 0.001 0.004
5 0.001 0.001 0.003 0.008 0.003
Mean 0.002 0.006 0.005 0.016 0.007
Sumjin River
Main stream
10 0.007 0.001 0.001 0.001 0.003
11 0.001 0.009 0.002 0.001 0.003
13 0.001 0.012 0.001 0.007 0.005
15 0.008 0.014 0.002 0.002 0.007
16 0.001 0.015 0.001 0.004 0.005
Tributaries
9 0.003 0.009 0.001 0.001 0.004
12 0.005 0.006 0.001 0.003 0.004
14 0.006 0.009 0.001 0.004 0.005
Mean 0.004 0.009 0.001 0.003 0.004
3.3. Decomposition rate coefficients of DOP
Table 3 indicates the DOP decomposition rate coefficient (k
DOP2) in Model 2. In this model, decomposition rate coefficient of DOP was the highest at St. 3 (k= 0.327 day
-1) in the Youngsan River while the lowest value was at St. 7 (0.145 day
-1). Whereas in the Sumjin River the highest decomposition rate coefficient was 0.378 day
-1at St. 14 which was followed by St. 12 (0.351 day
-1) and the lowest value was 0.139 day
-1at St. 9. DOP decomposition rate coefficient was much higher than that of POP re-
flecting the simpler biochemical composition of DOP the- reby resulting rapid conversion of DOP into DIP. Data from Table 5 shows that in the Model 4, the DOP de- composition rate coefficient (k
DOP3) in the Youngsan River was within the range of 0.176 to 0.375 day
-1and in the Sumjin River, the lowest decomposition rate coefficient of DOP was 0.173 day
-1at St. 15 and the highest value (0.419 day
-1) was at St. 14.
Although orthophosphate-P (PO
4-P) is generally consi-
dered to be the most important source of P for microbial
Table 7. TOP decomposition rate coefficient (k
TOP) in the Youngsan River and the Sumjin River
(Unit: day-1)Sampling Sampling period Mean
site No. June,06 Aug.,06 Dec.,06 Feb.,07
Youngsan River
Main stream
3 0.077 0.038 0.038 0.021 0.044
4 0.014 0.029 0.047 0.025 0.029
6 0.033 0.024 0.04 0.052 0.037
7 0.017 0.019 0.035 0.047 0.030
8 0.031 0.029 0.028 0.069 0.039
Tributaries
1 0.061 0.048 0.034 0.02 0.041
2 0.047 0.033 0.048 0.029 0.039
5 0.034 0.012 0.028 0.037 0.028
Mean 0.039 0.029 0.037 0.038 0.036
Sumjin River
Main stream
10 0.021 0.041 0.049 0.016 0.032
11 0.017 0.025 0.031 0.027 0.025
13 0.034 0.038 0.013 0.048 0.033
15 0.044 0.014 0.032 0.027 0.029
16 0.025 0.036 0.032 0.035 0.032
Tributaries
9 0.011 0.037 0.054 0.02 0.031
12 0.028 0.04 0.069 0.031 0.042
14 0.076 0.053 0.045 0.037 0.053
Mean 0.032 0.036 0.041 0.030 0.035
metabolism, the pool of DOP, which can equal or exceed PO
4-P in certain oligotrophic environments, has been implicated as an important source of P for phytoplankton growth (Berman, 1988; Jackson and Williams, 1985). Through several pathways, DOP can be derived largely from nucleic acids or nucleotides, sugar phosphates, phospholipids and other-P compounds, most of which are well known as essential intracellular intermediates and metabolites having functions as activators and precursors of macromolecular biosynthesis and as regulators of metabolism (Berman, 1988; Orrett and Karl, 1987). DOP consisting of mainly phosphate esters can be biochemically labile to allow active assimilation by bacteria and algae (Berman, 1988;
Orrett and Karl, 1987). Our results shows the highest de- composition rate coefficients of DOP attributing its simpler biochemical composition and labile nature compared to more complex compounds present in POP. Although the dynamics of DOP formation, supply and degradation is very complex because of its heterogeneity coming from their various origins (river supplies, algal excretion, cell lysis), the largely unknown degradation processes (chemical and enzymatic) of the refractory DOP to easily hydro- lysable compounds, and the fast recycling of these com- pounds.
Alkaline phosphatase has been the subject of several studies on organic P degradation and there is general agree- ment that only a small proportion of this material (< 10%) can be mineralized by this enzyme (Hino, 1988). DOP is predominantly phosphatase resistant (Peters, 1981) and that high indigenous levels of alkaline phosphatase activity do
not correlate with DOP mineralization rates in fresh water lakes (Berman and Moses, 1972; Hino, 1988). This con- trasts markedly with the situation in sea water where it has been reported that up to 30% of organic P is phos- phatase degradable (Venkateswaran and Natarajan, 1984).
Hydrolysis of phosphate monoester to organic moiety and orthophosphate in seawater largely depended on the activity of alkaline phosphatase (Suzumura et al., 1998). Although we did not measure the enzyme activities, the basis of the organic P decomposition processes is almost entirely the enzymatic which was excreted by different microorganisms in aquatic environment. Organic P compounds must first be converted to DIP for utilization by bacteria and phyto- plankton (Ammerman and Azam, 1985), thus the structural character of DOP influences its bioavailability. Although the phytoplankton is also capable of assimilating P from the POP (Cembella et al., 1984) and DOP (Cotner and Wetzel, 1992), however, the bioavailability of DOP may be reduced if it is associated with humic acids (Reynolds and Davies, 2001).
3.4. Decomposition rate coefficients of TOP
Decomposition of total organic P in general is essential
for recycling organic and inorganic components in aquatic
ecosystems. The TOP decomposition rate coefficient indi-
cates combined overall decomposition rate coefficients of
POP and DOP. Within the models, it is assumed that
conversion of POP and DOP to phosphate proceeds
through hydrolysis and mineralization. In the Model 1, the
mean TOP decomposition rate coefficient was 0.036 day
-1in the Youngsan River while it was 0.035 day
-1in the Sumjin River, despite the greater variability of TOP decom- position rate coefficients of different sampling sites of both the rivers.
As decomposition proceeds, soluble components and rela- tively easily degraded compounds such as sugar, starches and proteins will be rapidly utilized by decomposers, while more recalcitrant materials such as cellulose, fats, tannins and lignins will be decomposed at relatively slower rates.
Thus, with time the relative proportion of these recalcitrant materials will progressively increase and the decomposition rate might decrease in the later stage of decomposition.
However, because in this study labile OP and recalcitrant OP were not discriminated, it might have increased errors with exponential decrease model.
3.5. Comparison of models used in this study
Among the four models employed in this study, it is apparently clear that Model 3 might be more applicable to the aquatic environment because more complex compounds containing POP will be converted first to relatively simpler compounds containing DOP, and the DOP will then be converted to soluble reactive P or DIP. This model also supports the physical changes of most of natural sub- stances, although there are some exceptions. Model 1 ex- plains a general decomposition rates including both the POP and DOP decomposition phenomena. Model 2 usually represents the special circumstances of organic P conver- sion. Obviously, special circumstances can consider as limitation step of application of this model. Finally, Model 4 is relatively complex compared to other models used in this study. Thus, the decomposition rate coefficients ob- tained by Model 3 can be more applicable in modeling the river water quality.
3.6. Model representations in this study
During chemical analyses, total inorganic and organic P are separated in various ways; these fractions often relate poorly to the way in which P is decomposed (Wetzel, 2001). Obviously errors produced in estimations of para- meters can contribute to the uncertainty of predictions. It should be noted that the difference between modeled and measured values may be produced by various factors inclu- ding sampling and measurements (such as methods, skills, etc.) which will affect the P concentration. These factors are not reflected in the model simulation and a slightly greater variability is expected. For example, the release of inorganic PO
4by particulate seston was reported to be much greater than excretion of soluble organic P by living organisms expressing direct decomposition of POP into
DIP (Wetzel, 2001).
There was a difference in the decomposition rates under constant temperature perhaps due to aerobic and anaerobic conditions. Although a more complex model equation including microorganisms, pH, and redox potential may be able to improve the reproduction of real systems, it has been argued that increasing the number of parameters and complexity of the model will lead to an increase in model uncertainty as well as less accurate decomposition coeffi- cient. Our results indicate that the calibration results are quite acceptable. Conducting decomposition experiments at constant temperature and pH for a prolonged period would be very helpful to determine the extent of potential mine- ralization that can be induced by changes in stressors’
levels due to hydro-climatic changes. The data obtained from such task should further aid to estimate P stability in rivers that in turn, assist to devise appropriate strategies to reduce the P mobility in the ecosystem.
4. Conclusions
Organic P decomposition rate coefficients can provide valuable information for the development of river mana- gement strategies. Analyzing only DIP underestimates, and analyzing only TP overestimates, the potential bioavail- ability of P in the water body. Therefore, it is necessary to know the decomposition rate of organic P and how it varies with time and space to better understanding the P dynamics in any aquatic system. The model equations employed here lend themselves well to determining the rate of decomposition of organic P because it makes no assumptions what microorganisms are involved in the de- composition process. Our study suggests that the respective decomposition rate coefficients which are fairly constant.
Thus, given a uniform environment, the process by which decomposition proceeds may be very similar over a wide range organic P compounds, despite considerable differ- ences in overall decomposition rates. The decomposition coefficients measured in this study would obviously give a guideline to the selection of parameters in modeling the river water quality. The models consisting of nine inter- related differential equations employed here are useful to predict the decomposition rates of organic P in aquatic environment.
요 약
국내 영산강과 섬진강의 인 농도변동과 유기인 분해속도
를 조사하였다. 2006년 6월, 8월, 12월 그리고 2007년 2월
까지 총 4회 조사가 이루어졌다. 채수된 시료는 암 조건에
서 20일 동안 보관하여 인의 존재 형태변화를 분석하였다 (POP, DOP, DIP). 유기인의 분해속도는 일차반응식을 가 정하여 4개 모델에 의해 결정되었다. 평균 TOP 분해속도 계수는 영산강과 섬진강에서 각각 0.036 day
-1, 0.035 day
-1였다. POP-DIP로 모델의 경우 영산강과 섬진강의 평균 분해 속도 계수는 각각 0.049 day
-1, 0.035 day
-1였다. POP-DOP-DIP 모델에서 영산강과 섬진강의 평균 POP분해속도 계수는 각 각 0.042 day
-1, 0.038 day
-1였으며, 평균 DOP 분해속도계수 는 영산강 0.255 day
-1그리고 섬진강에서 0.244 day
-1로서 DOP분해속도가 더 빠른 것으로 나타났다. 영산강에서 평 균 POP-DOP분해속도 계수와 POP-DIP 분해속도 계수를 비교한 결과 각각 0.039 day
-1와 0.007 day
-1였다. 섬진강의 경우 위 모델에서 분해속도 계수는 각각 0.031 day
-1과 0.004 day
-1였다. 본 연구에서 측정된 분해속도계수는 하천 수질의 모델링에 적용될 수 있다.
References
Ammerman, J. W. and Azam, F. (1985). Bacterial 5-nucleoti- dase in aquatic ecosystems: A novel mechanism of phos- phorus regeneration. Science, 227, pp. 1338-1340.
APHA (1998). Standard Methods for the Examination of
Water and Wastewater, 20
th ed. American Public Health Association, Washington, DC.Benner, R. M., Moran, M. A. and Hodson, R. E. (1985).
Effects of pH and plant source on lignocellulose biode- gradation rate in two wetland ecosystems, the Okeefenokee Swamp and a Georgia salt marsh. Limnology and Ocean-
ography, 30, pp. 489-499.
Berman, T. (1988). Differential uptake of orthophosphate and organic phosphorus substrates by bacteria and algae in lake Kinneret. Journal of Plankton Research, 10, pp. 1239-1249.
Berman, T. and Moses, G. (1972). Phosphorus availability and alkaline phosphatase activities in two Israeli fish ponds.
Hydrobiologia, 40, pp. 487-498.
Boulton, A. J. and Boon, P. I. (1991). A review of metho- dology used to measure leaf litter decomposition in lotic environments: Time to turn over an old leaf. Australian
Journal of Marine and Freshwater Research, 42, pp. 1-43.
Brett, M. T., Arhonditsis, G. B., Mueller, S. E., Hartley, D.
M., Frodge, J. D. and Funke, D. E. (2005). Non-point source nutrient impacts on stream nutrient and sediment concentrations along a forest to urban gradient. Environ-
mental Management, 35, pp. 330-342.
Burns, R. G. (1986). Interactions of enzymes with soil mineral and organic colloids. In P. M. Huang and M. Schnitzer (eds.), Interactions of Soil Minerals with Natural Organics
and Microbes, Special Publications, Soil Science Society of
America Inc. 17, Madison, WI, pp. 423-427.Canfield, T. J., Kemble, N. E., Brumbaugh, W. G., Dwyer, F.
J., Ingersoll, C. G. and Fairchild, J. F. (1994). Use of benthic invertebrate community structure and the sediment quality triad to evaluate metal-contaminated sediment in the upper Clark-Fork River, Montana. Environmental Toxicology
and Chemistry, 13, pp. 1999-2012.
Cembella, A. D., Anita, N. J. and Harrison, P. J. (1984). The utilization of inorganic and organic phosphorus compounds nutrients by eukaryotic microalgae - a multidisciplinary perspective. Part 1, Critical Reviews in Microbiology, 10, pp. 317-391.
Choi, E., Kim, G. and Yoon, J. (1994). An approach for the estimation of NPS pollutant discharge. Journal of Korean
Society on Water Quality, 10, pp. 189-194.
Cotner, J. B. and Wetzel, R. (1992). Uptake of dissolved inorganic and organic phosphorus compounds by phyto- plankton and bacterioplankton. Limnology and Oceano-
graphy, 37, pp. 232-243.
Coutant, C. C. (1999). Perspective on Temperature in the Pacific Northwest’s Fresh Water. Environmental Sciences Division, Publication No. 4849, Oak Ridge National Labo- ratory, ORNL/TM-1999/44, Oak Ridge National Laboratory, Oak Ridge, Tennessee, pp. 109.
Cunningham, H. W. and Wetzel, R. G. (1989). Kinetic ana- lysis of protein degradation by a freshwater wetland sedi- ment community. Applied and Environmental Microbiology,
56, pp. 1963-1976.
De Pinto, J. V. and Verhoff, F. H. (1977). Nutrient regener- ation from aerobic decomposition of green algae. Environ-
mental Science and Technology, 11, pp. 371-377.
Furlan, S. A. and Pant, H. K. (2005). General properties of enzymes. In A. Pandey, C. Webb and C. Larroche (eds.),
Enzyme Technology, Asiatech Publishers, Inc., pp. 11-35.
Golterman, H. L. (1972). The role of phytoplankton in detritus formation. Mem. Ist. Ital. Idrobiol. Dott Marco de Marchi
Pallanza Italy 29 (Suppl.), pp. 89-104.
Harrison, P. G. and Mann, K. H. (1975). Detritus formation from eelgrass (Zostera marina L.): The relative effects of fragmentation, leaching, and decay. Limnology and Oceano-
graphy, 20, pp. 924-934.
Hino, S. (1988). Fluctuation of algal alkaline phosphatase activity and the possible mechanisms of hydrolysis of dis- solved organic phosphorus in Lake Barato. Hydrobiologia,
157, pp. 77-84.
Jackson, G. A. and Williams, P. U. (1985). Importance of dissolved organic nitrogen and phosphorus to biological nutrient cycling. Deep-Sea Research, 32, pp. 223-235.
Jorgensen, B. B. and Bak, F. (1991). Pathways and micro- biology of thiosulfate transformations and sulfate reduction in marine sediments (Kattegat, Denmark). Applied and
Environmental Microbiology, 57, pp. 847-856.
Kerner, M. (1993). Coupling of microbial fermentation and respiration processes in an intertidal mudflat of the Elbe estuary. Limnology and Oceanography, 38, pp. 314-330.
Kim, L. H. and Choi, E. (1996). Phosphorus release from sediment with environmental changes in Han river’ in Proceedings of the 4th Conference of Korean Association of Water Quality, Pusan, Korea.
Kristensen, E., Ahmed, S. I. and Devol, A. H. (1995). Aerobic and anaerobic decomposition of organic matter in marine sediment: which is fast? Limnology and Oceanography, 40, pp. 1430-1437.
Lee, C. (1992). Controls on organic-carbon preservation- The use of stratified water bodies to compare intrinsic rates of
decomposition in oxic and anoxic systems. Geochim. Cos-
mochim. Acta, 56, pp. 3323-3335.
Linkins, A. E., Sinsabaugh, R. L., McClaugherty, C. A. and Melills, J. M. (1990). Cellulase activity on decomposing leaf litter in microcosms. Plant and Soil, 123, pp. 17-25.
Long, E. T. and Cooke, G. D. (1978). Phosphorus variability in three streams during storm events: chemical analysis vs.
algal assay. Int. Ver. Theor. Angew, 21, pp. 441-452.
Motohashi, K. and Matsudaira, C. (1968). On the relation between the oxygen consumption and the phosphate regen- eration from phytoplankton decomposing in stored seawater.
Journal of the Oceanographical Society of Japan, 25, pp.
249-254.
Oremland, R. S. (1988). Biogeochemistry of methanogenic bacteria. In A. J. B. Zender (ed.), Biology of Anaerobic
Microorganisms, John Wiley & Sons, NY, pp. 641-707.
Orrett, K. and Karl, D. M. (1987). Dissolved organic phos- phorus production in surface seawaters. Limnology and
Oceanography, 32, pp. 383-395.
Pant, H. K. and Warman, P. R. (2000). Enzymatic hydrolysis of soil organic phosphorus by immobilized phosphatases.
Biology and Fertility of Soils, 30, pp. 306-311.
Peters, R. H. (1981). Phosphorus availability in Lake Memph-
remagog and its tributaries. Limnology and Oceanography, 26, pp. 1150-1161.
Reynolds, C. S. and Davies, P. S. (2001). Sources and bio- availability of phosphorus fractions in freshwaters: a British perspective. Biol. Rev. Camb. Philos. Soc., 76, pp. 27-64.
Stewart, W. D. P. and Daft, M. J. (1976). Algal lysing agents of freshwater habitats. Soc. Appl. Bacteriol. Symp. Ser., 4, pp. 63-90.
Sun, M. Y., Lee, C. and Aller, R. C. (1993). Anoxic and oxic degradation of C-14-labeled chloropigments and a C-14- labeled diatom in Long-Island Sound sediments. Limnology
and Oceanography, 57, pp. 147-157.
Suzumura, M., Ishikawa, K. and Ogawa, H. (1998). Charac- terization of dissolved organic phosphorus in coastal sea- water using ultrafiltration and phosphohydrolytic enzymes.
Limnology and Oceanography, 47, pp. 1553-1564.
Venkateswaran, K. and Natarajan, R. (1984). Role of phos- phatase in mineralization of organic phosphorus in Port Novo coastal waters. Indian Journal of Marine Science, 13, pp. 85-87.
Wetzel, R. G. (2001). Limnology-Lake and River Ecosystems, Third Edition, Academic Press, 525 B Street Suite 1900, San Diego, California 92101-4495, USA, pp. 240-288.