• 검색 결과가 없습니다.

Application of EFDC and WASP7 in Series for Water Quality Modeling of the Yongdam Lake, Korea

N/A
N/A
Protected

Academic year: 2021

Share "Application of EFDC and WASP7 in Series for Water Quality Modeling of the Yongdam Lake, Korea"

Copied!
9
0
0

로드 중.... (전체 텍스트 보기)

전체 글

(1)

韓 國 水 資 源 學 會 論 文 集 第44卷 第6號 2011年 6月

pp. 439~ 447

< ISE 수자원학회 특별호 논문 >

Application of EFDC and WASP7 in Series for Water Quality Modeling of the Yongdam Lake, Korea

Seo, Dongil * / Kim, Minae **

...

Abstract

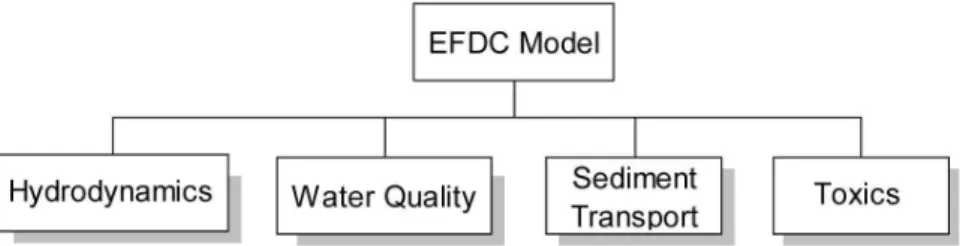
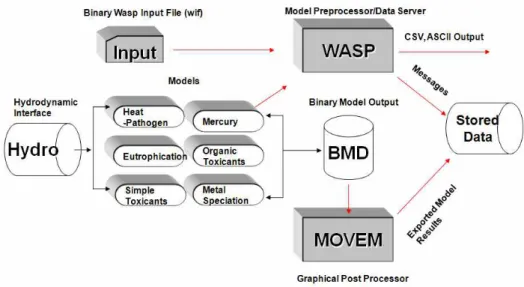
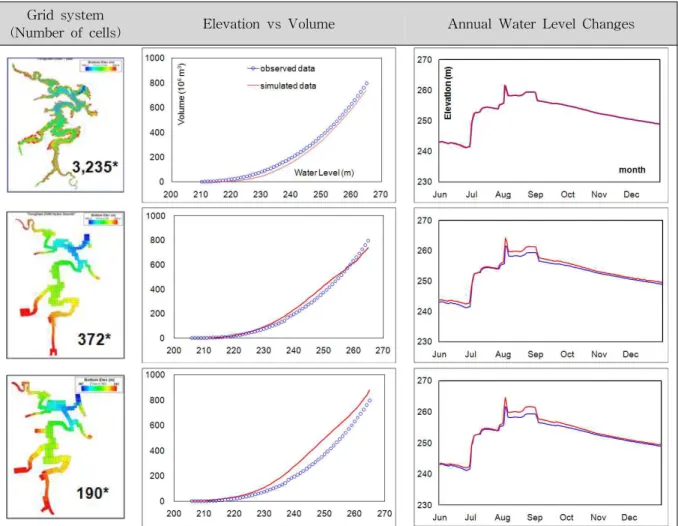
This study aims to test the feasibility of combined use of EFDC (Environmental Fluid Dynamics Code) hydrodynamic model and WASP7.3 (Water Quality Analysis Program) model to improve accuracy of water quality predictions of the Yongdam Lake, Korea. The orthogonal curvilinear grid system was used for EFDC model to represent riverine shape of the study area. Relationship between volume, surface and elevation results were checked to verify if the grid system represents morphology of the lake properly. Monthly average boundary water quality conditions were estimated using the monthly monitored water quality data from Korean Ministry of Environment DB system. Monthly tributary flow rates were back-routed using dam discharge data and allocated in proportion to each basin area as direct measurements were not available.

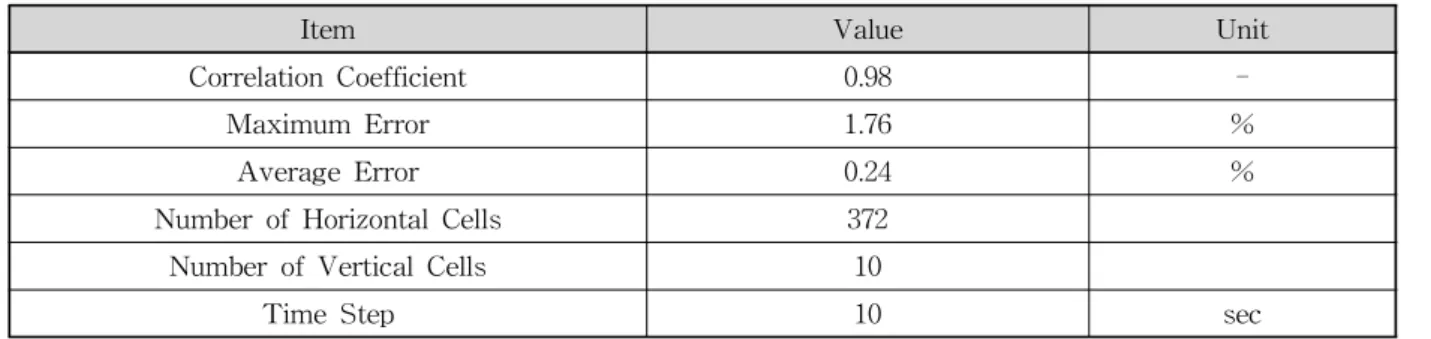
The optimum number of grid system was determined to be 372 horizontal cells and 10 vertical layers of the site for 1 year simulation of hydrodynamics and water quality out of iterative trials. Monthly observed BOD, TN, TP and Chl-a concentrations inside the lake were used for calibration of WASP7.3 model. This study shows that EFDC and WASP can be used in series successfully to improve accuracy in water quality modeling. However, it was observed that the amount of data to develop inflow water quality and flow rate boundary conditions and water quality data inside lake for calibration were not enough for accurate modeling.

It is suggested that object-oriented data collection systems would be necessary to ensure accuracy of EFDC-WASP model application and thus for efficient lake water quality management strategy development.

Keywords: EFDC, WASP, hydrodynamic model, water quality model, yongdam lake

...

*Corresponding Author, Professor, Dept. of Environmental Eng., Chungnam National University, 220 Gung-dong Yuseong-gu Daejeon 305-764, Korea (e-mail: [email protected])

** Dept. of Environmental Eng., Chungnam National University, 220 Gung-dong Yuseong-gu Daejeon 305-764, Korea (e-mail: [email protected]) DOI: 10.3741/JKWRA.2011.44.6.439

1. INTRODUCTION

Many major water resources reservoirs in Korea are located in the upper stream areas. Recent rapid increase of organic farming practices in high sloped mountainous areas that requires addition of top soil and climate change toward more frequent intensive rainfall in Korea have lead tremendous increase in soil

erosion, especially in the upper stream areas. As a

result, many of reservoirs have shown year long

turbidity problem. Turbidity in reservoirs caused by

clay or colloidal particles of eroded soil may have

negative effect on water quality. Adsorbed pollutant

in clay particle can be released to water phase and this

effect can last extended period of time. While soil

erosion protection in the basin is the most important

(2)

Fig. 1. Primary Modules of the EFDC Model factor, it is also important to understand behavior of

turbidity dynamics inside reservoirs. Movement of sediment particles and variations in turbidity are complex functions of water movement and density changes. Therefore, it is necessary to consider hydrodynamics to predict turbidity and water quality dynamics of a water body properly.

Dependent on the purpose of modeling, steady state model such as QUAL2E (Brown and Barnwell, 1987) or dynamic model such as WASP (Ambrose et al., 1993) can be chosen. Ambrose et al. (2009) reported the history of water quality model development in US from 1960s to the present. It has been common that water quality models do not consider hydrodynamic characteristic of water in a great depth. The presence of effective tool to link water movement and water quality processes was the major cause of this problem, especially for unsteady modeling cases. Buchak (1995) developed CE-QUAL-W2 model that includes 2-D hydrodynamic and water quality kinetics. This can be considered as the first successful case to link water movement and water quality model in the same model. Park et al. (1995) developed HEM3D water quality model to predict 3-D water quality dynamics along with 3-D hydrodynamics model, EFDC (Hamrick, 1992). EFDC can be regarded as an another successful case to consider movement water and kinetics of water quality in the same model. USEPA uses EFDC to provide hydrodynamic information to WASP. In this study, authors aimed to test the feasibility of combined use of hydrodynamic model of EFDC with water quality model, WASP in the prediction of water quality of a reservoir in Korea.

2. MATERIALS AND METHODS 2.1 Environmental Fluid Dynamics Code (EFDC) The EFDC is a public domain surface water modeling

system incorporating fully integrated hydrodynamics, water quality, sediment transport and toxic chemical transport and fate submodels in a single source code frame work as shown in Fig. 1. EFDC has the capa- bilities to analyze three-dimensional hydrodynamics coupled with salinity, temperature, sediment and con- taminant transport modules in surface water systems including: rivers, lakes, estuaries, reservoirs, wetlands, and near-shore to shelf-scale coastal regions. The physics of the EFDC model and many parts of the com- putational scheme are similar to the Blumberg-Mellor model (Blumberg & Mellor, 1987) and the U.S. Army Corps of Engineers' Chesapeake Bay model (Johnson et al., 1993). The EFDC model solves the three-dimensio- nal, vertically hydrostatic, free surface, turbulent averaged equations of motion for a variable density fluid. The model uses a stretched or sigma vertical coordinate and Cartesian or curvilinear, orthogonal horizontal coordi- nates. Dynamically coupled transport equations for turbulent kinetic energy, turbulent length scale, salinity and temperature are also solved. The model was originally developed by Hamrick (1992) at Virginia Institute of Marine Science (VIMS). The EFDC model has been listed and supported as a tool for the develop- ment of Total Maximum Daily Load (TMDL) by US Environmental Protection Agency. USEPA has supported to link EFDC 3-D hydrodynamic module with WASP, one of the USEPA's most representative water quality simulation.

2.2 Water Quality Analysis Simulation Program (WASP)

The WASP is a USEPA's generalized modeling frame-

work that simulates contaminant fate and transport in

surface waters (Ambrose et al., 1993; Ambrose et al.,

2009). Based on the flexible compartment modeling

approach, WASP can be applied in one to three dimen-

(3)

Fig. 2. Structure of WASP7 Model

Fig. 3. Interactions of Water Quality Variables in WASP7 Model

sions. WASP water quality model has 6 modules in- cluding "Eutrophication" as shown in Fig. 2. In this study, Eutrophication was selected and tested for water quality simulation using EFDC hydrodynamic information.

Interactions among major constituents in Eutrophica- tion module are shown in Fig. 3. Phytoplankton plays a central role in Eutrophication module, affecting all other components. Phytoplankton uses NH

3

, NO

3

and PO

4

for their growth and decreased due to death, settling and endogenous respiration. Detritus represents pool of organic particulate matter including dead phytoplankton. Detritus will be decomposed to dissolved particulate matter and inorganic nutrients. Some portion of carbon settles to the bottom and the other remaining portion becomes CBOD

1

,

CBOD

2

and CBOD

3

. Dissolved organic phosphorus becomes PO

4

by mineralization and similarly dissolved organic nitrogen changes to NH

3

, which is further changed to NO

3

by nitrification. When there is no enough oxygen in the water NO

3

becomes N

2

by denitrification. DO reacts with atmosphere, CBOD, NBOD, Phytoplankton and Periphyton.

Inorganic materials settle as solids. The WASP program includes six mechanisms for describing transport in- cluding advection, dispersion settling and resuspension.

To describe advection within WASP, each inflow or cir-

culation pattern requires specification of the fraction

routed through relevant water column segments and the

time history of the corresponding flow. Dispersion

requires specification of cross-sectional areas between

(4)

Fig. 5. Rainfall, Flow Rate and Water Levels of Yongdam Lake (2001~2007) Fig. 4. The Study Site, The Yongdam Lake, Korea

model segments, characteristic mixing lengths, and the time history of the corresponding dispersion coefficient.

This can be very complicated and difficult process if number of water segments is large. EFDC can dramati- cally eliminate the effort to describe advection and dispersion among grid networks.

2.3 The Yongdam Lake, Korea

The Geum River is the third greatest river in South Korea. This river provides water for over five million

people in the vicinity areas. Two major dams are

located on this river, Daechung Dam and Yongdam

Dam, the 3rd and 5th largest reservoir in South Korea,

respectively. The location of Yongdam Lake, the study

site is as shown in Fig. 4. This lake supplies water to

people in areas around lower western central part of

South Korean peninsula through withdrawal facilities

while natural flow is discharged through spillways and

hydropower generation discharges to the Geum River

as shown in the figure.

(5)

Grid system

(Number of cells) Elevation vs Volume Annual Water Level Changes

Fig. 6. Physical Modeling Accuracies of Selected Grid Systems for Yongdam Lake Flow rate and water quality concentrations of five

major tributaries are considered as boundary conditions.

The year of 2005 was selected as an annual testing period and hydrologic and hydraulic information of the dam between 2001 and 2007 are as shown in Fig. 5. All the input data and forcing function data for water quality used in this study were obtained from Korean public governmental sites including www. wamis.co.kr (Ministry of Land and Ocean), and www.nier. go.kr (National Institute of Environmental Research).

3. Results and Discussion

3.1 Design of Grid Network and EFDC Hydro- dynamic Modeling Results

The design of a grid network is an essential part of hydrodynamic and water quality modeling. The proper resolution of modeling grid must be selected in order to account for spatial variation of the parameters to be considered. On the other hand, a 3-D model requires

heavy computation time and extensive data for calibra- tion, therefore, selection of the optimum layout of com- putational grid is the most important factor for applica- tion. In this study, the orthogonal curvilinear grid tech- nique was used to generate grid of the study area. The use of an orthogonal curvilinear grid systems provides great advantages in computational and storage resources.

Considered number of horizontal grids ranged from 10 to 40,000 horizontal cells and 5 to 10 vertical layers.

Volume-elevation curve of the dam and annual surface elevation data were used to compare prediction accuracies.

Fig. 6 shows accuracies in the prediction of volume and water level relationships and annual water level simulation for few selected grid systems.

Table 1 shows calibration results of water level and accuracies of the final grid system selected for this study.

A case of 372 horizontal cells and 10 vertical cells seems to show good calibration results for annual water level fluctuations and vertical temperature profile changes.

Details of grid size selection processes and hydrody-

(6)

Item Value Unit

Correlation Coefficient 0.98 -

Maximum Error 1.76 %

Average Error 0.24 %

Number of Horizontal Cells 372

Number of Vertical Cells 10

Time Step 10 sec

Table 1. Error Analysis of Water Level Modeling of the Selected Grid System (372x10)

Description Value

NH

3-

N

Nitrification Rate Constant at 20℃(per day) 0.1

Nitrification Temperature Coefficient 1.04

Half Saturation Constant for Nitrification Oxygen Limit (mg O/L) 0.5 NO

3-

N

Denitrification Rate Constant at 20℃(per day) 0.2

Denitrification Temperature Coefficient 1.04

Half Saturation Constant for Denitrification Oxygen Limit (mg O/L) 0.5

Phyto- plank- ton

Phytoplankton Maximum Growth Rate Constant at 20℃(per day) 2.5

Phytoplankton Growth Temperature Coefficient 1.04

Phytoplankton Carbon to Chlorophyll Ratio 50

Phytoplankton Half-Saturation Constant for Nitrogen Uptake (mg N/L) 0.05 Phytoplankton Half-Saturation Constant for Phosphorus Uptake (mg P/L) 0.005 Phytoplankton Death Rate Const. (Non-Zooplankton Predation) (per day) 0.1

Phytoplankton Phosphorus to Carbon Ratio 0.025

Phytoplankton Nitrogen to Carbon Ratio 0.18

CBOD BOD (1) Decay Rate Constant at20℃(per day) 0.01

BOD (1) Decay Rate Temperature Correction Coefficient 1.04 O

2

Oxygen to Carbon Stoichiometric Ratio 2.67

Global Reaeration Rate Constant at 20℃(per day) 2.0

Theta-Reaeration Temperature Correction 1.04

Org-N

Dissolved Organic Nitrogen Mineralization Rate Const. at 20℃(per day) 0.4 Dissolved Organic Nitrogen Mineralization Temperature Coefficient 1.04 Organic Nitrogen Decay Rate Constant in Sediments at 20℃(per day) 0.0004 Organic Nitrogen Decay in Sediment Temperature Coefficient 1.08 Org-P Mineralization Rate Constant for Dissolved Organic P at 20℃(per day) 0.2

Dissolved Organic Phosphorus Mineralization Temperature Coefficient 1.04 Table 2. Calibrated Constants for WASP Modeling

namic calibrations are shown in Seo et al. (2010).

3.2 Resxults of WASP Water Quality Modeling Only monthly observed water quality data available for tributaries and inside lake. Also, inflow rate of the lake can only be estimated using discharge and water

level information of the lake. Therefore, boundary flow

and water quality conditions were estimated using

weighted averages to consider nonpoint sources effect

(Seo and Lee, 2003). Calibrated constants for WASP

water quality modeling in this study are as listed in

Table 2.

(7)

Fig. 7. Water Quality Calibration Results of Site1

Fig. 8. Water Quality Calibration Results of Site2 Fig. 7 through Fig. 9 show calibrated results of

BOD5, TN, TP and Chl-a in the top layers of site1, site2 and site3 of the Yongdam lake, respectively as shown in Fig. 4. Water quality modeling results of all variables seem to follow general trends of observed data though there are some deviations. This is partly due to limited amount of boundary conditions and in- lake data available. This results suggest that water

quality monitoring system of boundary conditions and inside lake should be improved for more accurate modeling and thus for effective management.

4. CONCLUSION

EFDC model and WASP model were successfully

applied in series for hydrodynamic modeling and water

(8)

Fig. 9. Water Quality Calibration Results of Site3

quality modeling of the Yongdam Lake, Korea. Through multiple trial and errors, the optimum grid network of 370 horizontal and 10 vertical cells was chosen for 1 year hydrodynamic and water quality modeling of the Yongdam Lake, Korea. Temporal and spatial changes in vertical temperature profiles were checked while relationships among volume, surface area and surface level were maintained accurate hydrodynamic modeling.

The observed BOD5, TN, TP and Chl-a concentration inside lake were used for calibration of WASP water quality model. Monthly weighted average water quality concentrations, considering raining event mean con- centration, for main flow and tributary flows were developed using Korea Ministry of Environment DB system. Monthly average flow rate of each tributary flow was back calculated by allocating lake discharge data in proportion to each respective watershed area.

This study shows that combined use of EFDC-hydro for 3-D hydrodynamics and WASP for water quality kinetics can be applied to improve accuracy of hydro- dynamics and water quality predictions. However, this study also suggests that the current data collection system is not enough to support accurate calibration of hydrodynamic and water quality characteristics. It is strongly recommended to implement object-oriented intensive data collection for the study site to improve

accuracy of modeling and thus improve efficiency of water quality management plan development.

ACKNOWLEDGEMENT

This research was a part of the project entitled

"Development of Integrated Estuarine Management System (No-41873-01)", funded by the Ministry of Land, Transport, and Maritime Affairs, Korea.

REFERENCES

Ambrose, R.B., Wool, T.A., and Martin, J.L. (1993).

“The Water Quality Analysis Simulation Program.”

WASP5 User's Manual, USEPA.

Ambrose, R.B., Wool, T.A., and Barnwell, T.O. (2009).

“Development of Water Quality Model in the United States”, Environmental Engineering Research, Vol.

14, No. 4, pp. 200-210.

Blumberg, A.F., and Mellor, G.L. (1987). A description of a three-dimensional coastal ocean circulation model.

In N.S. Heaps (Ed.), Three dimensional coastal ocean models (pp. 1-16). Washington D.C.: American Geophysical Union.

Bowie, G.L., Mills, W.B., Porcella, D.B., Campbell, C.L.,

Pagenkopf, J.R., Rupp, G.L., Johnson, K.M,. Chan,

(9)

P.W.H., Gherini, S.A., and Chamberlin, C.E. (1985).

“Rates, Constants, and Kinetics Formulations in Surface Water Quality Modeling”, 2nd Ed. USEPA, EPA/600/3-85/040.

Brown, L.C., and Barnwell, T.O. (1987). “The Enhanced Stream Water Quality Models QUAL2E and QUAL2E- UNCAS”: Documentation and User Manual. EPA/

600/3-87/007.

Chapra, S.C., Pelletier, G.J., and Tao, H. (2007). QUAL 2K: A Modeling Framework for Simulating River and Stream Water Quality (Version 2.07): Documen- tation and Users Manual.

Cole, T.M., and Buchak, E.M. (1995). CE-QUAL-W2:

A Two-Dimensional, Laterally Averaged, Hydro- dynamic and Water Quality Model, Version 2.0:

Users Manual, Instruction Report EL-95-1, US Army Engineer Waterways Experiment Station, Vicksburg, MS.

Hamrick, J.M. (1992). A Three-Dimensional Environ- mental Fluid Dynamics Computer Code; Theoretical and Computational Aspects, The College of William and Mary, Virginia Institute of Marine Science.

Special Report 317, 63p.

Hamrick, J.M. (1994). “Linking Hydrodynamic and Biogeochemical Transport Models for Eatuarine and Coastal Waters.” Estuarine and Coastal modeling, Proceeding of the 3rd International Conference, Spaulding, M.L. et al, Eds., American Society of Civil Engineers, New York, pp. 591-608.

Johnson, B.H., Kim, K.W., Heath, R.E., Hsieh, B.B., and Butler, H.L. (1993). “Validation of Three Dimensional Hydrodynamic Model of Chesapeake Bay”, J of Hydraulic Engineering, Vol. 119, pp. 2-20.

Korean Ministry of Land and Ocean website, www.

wamis.co.kr.

National Institute of Environmental Research, Korean Ministry of Environment Website, www.nier.go.kr.

Park, K., Kuo, A.Y., Shen, J., and Hamrick, J.M. (1995).

“A Three-Dimensional Hydrodynamic-Eutrophication Model (HEM-3D): Description of Water Quality and Sediment Process Submodels”, Special Report, Virginia Institute of Marine Science, College of William and Mary.

Park, S.S., and Lee, Y.S. (2002). A water quality modeling study of the Nakdong River, Korea. Ecological Modeling, Vol. 152, No. 1, pp. 65-75.

Rossman, L.A. (2009). Storm water management model (SWMM) user's manual version 5.0, EAP/600/R-05/

040.

Seo, D., and Lee, E.H. (2003). “Estimation of Pollutant Load to Yongdam Reservoir Considering Rainfall Effect”, J. of Korean Water Resources Association, Vol. 36, No. 4, pp. 521-531.

Seo, D., Sigdel, R., Kwon, K.H., Lee, Y.S. (2010). 3-D hydrodynamic modeling of Yongdam Lake, Korea using EFDC, Desalination and Water Treatment, Vol. 19, No. 1, pp. 1-7.

Tetra Tech, Inc. (2002). Hydrodynamic and transport extension to the EFDC model. A report to the U. S.

Environmental Protection Agency, Fairfax, VA.

USEPA. (2010). WASP homepage. http://www.epa.gov/

athens/wwqtsc/html/wasp.html

USEPA. (2007). The Environmental Fluid Dynamics Code User Manual US EPA Version 1.01.

Wool, T.A., Ambrose, R.B., Martin, J.L., and Comer, E.A. (2001). The Water Quality Analysis Simulation Program, WASP6 User's Manual, USEPA.

논문번호: 특별호 접수: 2011.02.28

수정일자: 2011.04.23 심사완료: 2011.04.23

수치

Fig. 1. Primary Modules of the EFDC Modelfactor, it is also important to understand behavior of
Fig. 3. Interactions of Water Quality Variables in WASP7 Model
Fig. 5. Rainfall, Flow Rate and Water Levels of Yongdam Lake (2001~2007)Fig. 4. The Study Site, The Yongdam Lake, Korea
Fig. 6. Physical Modeling Accuracies of Selected Grid Systems for Yongdam LakeFlow rate and water quality concentrations of five
+4

참조

관련 문서

After first field tests, we expect electric passenger drones or eVTOL aircraft (short for electric vertical take-off and landing) to start providing commercial mobility

1 John Owen, Justification by Faith Alone, in The Works of John Owen, ed. John Bolt, trans. Scott Clark, &#34;Do This and Live: Christ's Active Obedience as the

The goal of this research is worked one reasonable function analysis of the cost reduction and quality enhancement to spread out by using QFD (Quality

The purpose of this research was to suggest the water quality improvement in streams by evaluating the distribution characteristics of organics and ammonia nitrogen

This study aims to explore the concepts of wayfinding and choice architecture in the information book and to find a connection for the proper provision

– Treat wastewater before it is discharged to maintain the water quality of the natural waters for the benefit of humans and aquatic ecosystem. • Wastewater management goal

Further, in this course, students will learn all the capabilities necessary for the modeling of the practical fluid phenomena in the river and for the analysis

• To multiply the environmental quality of the city center, building new green areas and parks, unifying the city and the Ria and making the water edge be accesible