노인의 구강위생행태와 주관적 구강건강 형태에 대한 분석
김 욱 태 신흥대학교 치기공과
Oral hygiene form and the subjective health analysis of the elderly
Wook-Tae Kim
Department of Dental Technology, Shin Heung College University
Purpose: This study was conducted to prepare the fundamental data on oral hygiene of the elderly and to assess the behavior of oral hygiene, subjective oral health, oral health problem among the elderly, and to contribute to successful enhancement of life in their declining years.
Methods: The author surveyed the behavior of oral hygiene, subjective oral health, oral health problem to 192 elderly at a health center of Busan using structured self- administered questionnaire from Nov. 2nd 2009 to Feb.
10th 2010. Collected data were analysed by SPSS WIN 18.0 statistical program for frequency, percentage production,
2(Chi-square) verification, t-test, One-way ANOVA, Logistic Regression.
Results: The distribution of total subjects by oral health behaviors were 56.8% for “have ever trained how to tooth brushing”, 76.6% for “correctly performed tooth brushing by himself ”, 71.8% for “tooth brushing a day is two times and less”, 87.5% for “it doesn’t tooth brushing in meals and after” and 53.6% for “it doesn’t use the facility for oral health”, respectively. The distribution of total subjects by the state of perceived oral health were 51.0% for
“feel the oral discomfort”, 51.6% for “feel the comfortable chewing on starchy food”, respectively. The mean point of perceived oral health by general characteristics of total subjects were statistically significant difference in sex, type of medical insurance, smoke, exercise, and chronic disease. The mean point of perceived oral health by oral health behaviors of total subjects were statistically significant difference in educational experience on tooth brushing, recognition for tooth brushing by himself, tooth brushing a day, and tongue cleaning. The risk factors of perceived oral health were type of medical insurance and chronic disease in general characteristics, tooth brushing in meals and after and tooth brushing a day, and tongue cleaning in oral health behaviors.
Conclusion: The author recommend to the prevention of chronic disease, carry out the tooth brushing in meals and after, three times and over tooth brushing a day and tongue cleaning for oral health. and the author consider that it need to prepare the active countermeasure to oral health such as reeducation for oral health and supply to the tongue cleaner.
[Abstract]
성 명 김 욱 태 전 화 011-831-1664 E-mail [email protected] 교신저자
Key words :
elderly, oral health, subjective health
Ⅰ. 서 론
1. 연구의 배경 및 필요성
우리나라는 최근 급속한 경제 성장과 의료기술의 발달 로 인하여 평균수명이 늘어나고 저 출산 경향이 지속되면 서 노인인구의 비율이 급증하고 있으며, 2000년 이후 고 령화 사회에 진입하게 됨에 따라 노인문제에 대하여 많은 사회적 관심이 대두되고 있다. 여러 노인문제 가운데에서 특히 노인의 건강과 관련된 보건 의료적 측면의 문제는 삶을 유지하는데 있어서 노인에게는 무엇보다 중요하다.
그 중에서도 구강건강은 전체 건강의 일부로서 영양섭취 및 소화와 깊은 관련성을 가지고 있다(원영순, 2003). 구 강은 신체 활동에 필요한 영양소를 섭취하는 소화기관의 첫 번째로 구강의 건강이 확보되지 않는다면 불균형적인 영양분의 섭취로 인해 신체의 건강을 기대할 수 없게 된 다(성진효 등, 1992). 노인의 구강건강 수준은 대다수의 치아상실로 저작기능이 저하되어 섭취할 수 있는 음식물 의 선택 범위가 좁아지고 식사의 양과 질 역시 저하됨으 로써 건강과 체력을 잘 유지하기 어려워 질 수 있다(박주 희 등, 2002).
또한 발음과 외모에 영향을 줌으로써 대인관계 및 원활 한 사회생활에 제한을 주게 되어 사회적 소외감과 고립을 촉진시킬 수 있는 장애를 유발하므로 치아 상실은 개개인 의 삶의 질에 영향을 미치고 있다(Locker 1988).
전신질환과는 달리 노인에서 발생되는 치아상실과 구강 질환은 고령화로 인한 결과라기보다는 장년기에 이르기 까지 잘못된 식습관 및 연령의 증가에 따른 부적절한 구 강환경관리에 예방 지향적이고 포괄적인 구강보건 진료 를 주기적으로 전달받지 못한 결과로 나타날 수 있으며 (박영애, 2006), 전신질환에 의해 구강관리에 더욱 소홀 해지고 이에 따라 건강관련 삶의 질이 떨어지는 악순환이 반복될 것으로 보여 앞으로 이들에 대한 적극적인 전신 및 구강관리 서비스가 요구된다(조경숙 등, 2010).
이에 정부는 공공의료 서비스 제공을 위해 방문보건사 업을 시행하고 있으며 ,방문보건사업은 노인들이 가지는 건강상의 욕구와 복지 욕구를 지역사회 내에서 해결하기 위한 대표적인 프로그램으로 자리 잡아가고 있으며, 보건 소 방문구강보건사업에 대한 실태 및 현황 조사연구가 일
부 이루어지고 있는 실정이다(강부월 등 2008).
이에 본 연구에서는 방문보건사업에 등록된 65세 이상 노인을 대상으로 노인의 건강상태 평가기준이 객관적인 건강상태보다 노인 개개인이 느끼는 주관적 구강건강상 태와 연관성이 있는 주관적 구강증상을 우선적으로 고려 하여 노인들의 구강건강을 증진, 유지하기 위한 적절한 구강위생행태 및 주관적 구강건강현황을 조사하여 노인 의 구강건강 향상을 위한 노인구강보건사업개발의 기초 자료와 보다 폭 넓은 노인구강보건문제 해결에 도움을 주 고자 본 연구를 시행하였다.
Ⅱ. 연구 방법
1. 연구의 대상
본 연구는 부산지역의 방문 관리 노인 중 구강 건강관리 대상자 192명을 2009년 11월 02일부터 2010년 02년 10 일 까지 맞춤형 방문 조사 설문지를 이용하였고 개별 면 접으로 이루어 졌다.
2. 조사도구 및 내용
본 연구에 사용한 조사 도구는 구강 위생 행태, 주관적 구강 건강, 등에 관한 선행연구와 맞춤형 방문 조사의 설 문을 사용하였다.
조사항목은 사회 인구학적 특성 6문항, 건강 관련 특성 5문항, 구강 위생 행태 7문항, 주관적 구강 건강 5문항 등 총 23문항으로 구성하였다.
1) 사회 인구학적 특성
구강 위생 행태와 주관적 구강 건강에 영향을 미칠 것으 로 사료되는 성별, 연령, 배우자 유무, 교육수준, 건강보 험형태, 동거형태 등으로 분석하였다.
2) 건강, 건강형태 관련 특성
건강과 관련된 요인으로 흡연 유무, 음주 유무, 운동 유
무, 만성질환 유무, 장기적 약물 복용 유무를 분류하여 분
석하였다.
3) 구강위생행태
본 연구에서의 구강 위생 행태 관련 요인으로는 최근 치 과 검진 시기, 1일 잇솔질 횟수, 잠자기 전 잇솔질 여부, 식/후 잇솔질 여부, 본인 자각 올바른 잇솔질 여부, 혀 닦 기 여부, 구강 교육 경험 여부, 구강 위생 용품 사용 유무 였으며, 최근 치과 검진 시기는 1~2년, 2~3년, 5년 이상, 받은 적이 없음 으로 하였고, 잇솔질 횟수는 한번 , 두 번, 세 번 이상으로 분류 하였으며, 그 외 구강 위생 행태 관 련 요인은 각각을 점수화 하여 긍정적 문항에 1점, 부정적 문항에 0점으로 처리하여 분류하였다.
4) 주관적 구강 건강
본 연구의 주관적 구강 건강 관련 요인은 현재 본인 입안 의 문제로 음식을 씹는데 불편감을 느끼는지 여부, 본인 구강의 잇몸 통증 및 출혈의 경험이 있었는지의 여부, 6개 월 전 보다 딱딱한 음식을 씹기 어려워 졌는지의 여부, 입 이 자주 말라서 신경이 쓰인 적이 있는지의 여부(구강 건 조), 음식을 드실 때 목이 멘 적이 있었는지의 여부(연하 곤란)를 조사하였으며, 각각 불편감을 느낀다에 1점, 그렇 지 않다에 0점으로 5점 척도화 하여 재분류 하였다.
3. 자료처리 및 분석
본 연구의 수집된 자료는 SPSS(Statistical Package for the Social Science) WIN 18.0 프로그램을 이용하여 분석하였다.
구체적인 분석 방법으로는 조사 대상자의 일반적인 특
성을 파악하기 위해 빈도분석을 실시하였고, 일반적인 특 성과 구강위생행태, 주관적 구강건강에 어떠한 영향을 미 치는가를 알아보기 위해 카이제곱 분석(chi-square test) 으로 산출하였다. 또한 일반적 특성과 구강위생행태 및 주관적 구강 건강의 모집단의 유의성을 파악하기 위해 T-test 와 ANOVA 분석을 하였으며, 주관적 구강 건강에 독립적으로 영향을 주는 요인들을 알아보기 위해 정상군 을 기준으로 선형 회귀분석을 실시하였다.
Ⅲ. 결 과
1. 조사대상자의 일반적 특성
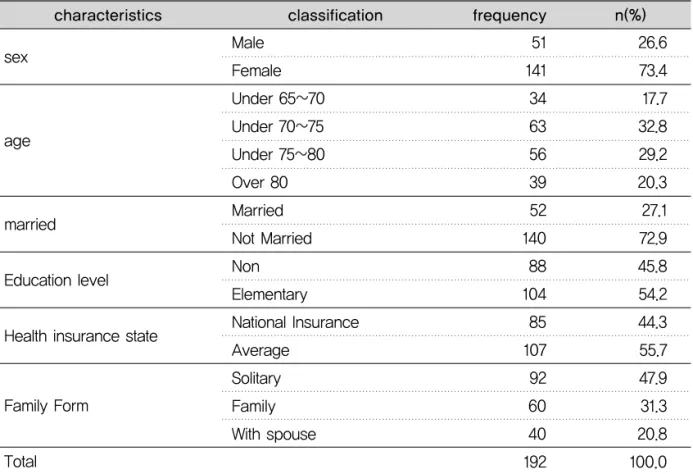
조사대상자들의 사회 인구학적 특성은 <Table 1>과 같다.
전체 192명 중 성별로 여자가 141명(73.4%), 70세~75 세 미만 군의 대상자가 63명(32.8%)로 나타났다. 무 배우 자가 140명(72.9%), 초등학교 졸업 이상자가 104명 (54.2%), 건강 보험 가입자가 107명(55.7%), 독거노인이 92명(47.9%)로 나타났다.
조사대상자들의 건강, 건강형태 관련 특성은 <Table 2>
와 같다.
흡연자가 161명(83.9), 음주자가 168명(87.5%). 운동을
하는 대상자가 100명(52.1%), 만성질환이 없는 대상자가
138(71.9%), 장기적 약물복용을 하지 않는 대상자가 133
명(69.3%)으로 나타났다.
2. 조사대상자의 구강위생행태
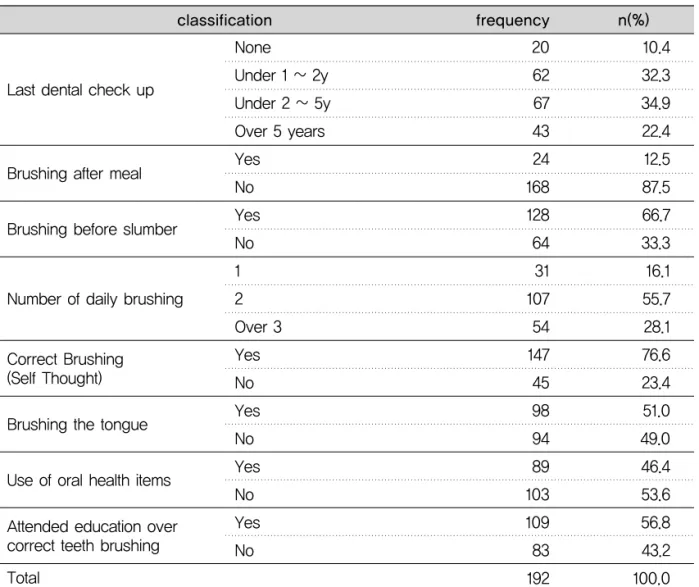
조사대상자의 구강위생행태의 분포는 <Table 3>과 같다.
최근 치과 검진 시기는 2년~5년 미만이 67명(34.9%),
“식/후 잇솔질을 하지 않는다” 가 168명(87.5%), “잠자기 전 잇솔질을 한다” 가 128명(66.7%)로 높았고. 1일 잇솔질 횟수는 2회가 107명(55.7%), “본인이 올바른 잇솔질 방법 을 알고 있다” 가 147명(76.6%), “혀를 닦는다” 가 98명
(51.0%), 치실/치간치솔과 같은 “구강위생용품을 사용하 지 않는다” 가 103명(53.6%), “잇솔질 방법 교육 경험이 있다” 가 109명(56.8%) 각각 나타났다.
3. 조사대상자의 주관적 구강건강
조사대상자의 주관적 구강 건강은 <Table 4>와 같다.
구강 불편이 있는 대상자가 98명(51.0%), 구강통증 및 Table 1. The social status of the surveyed participants
characteristics classification frequency n(%)
26.6 73.4 17.7 32.8 29.2 20.3 27.1 72.9 45.8 54.2 44.3 55.7 47.9 31.3 20.8 100.0 51
141 34 63 56 39 52 140 88 104 85 107 92 60 40 192 Male
Female Under 65~70 Under 70~75 Under 75~80 Over 80 Married Not Married Non Elementary National Insurance Average
Solitary Family With spouse sex
age
married
Education level
Health insurance state
Family Form
Total
Table 2. Physical health status and forms of participants
characteristics classification frequency n(%)
83.9 16.1 87.5 12.5 52.1 47.9 28.1 71.9 30.7 69.3 100.0 161
31 168 24 100 92 54 138 59 133 192 Yes
No Yes No Yes No Yes No Yes No Smoking
Drinking
Exercising
Chronic Disease
Long term medication
Total
Table 3. Oral hygiene status of the participants
classification frequency n(%)
10.4 32.3 34.9 22.4 12.5 87.5 66.7 33.3 16.1 55.7 28.1 76.6 23.4 51.0 49.0 46.4 53.6 56.8 43.2 100.0 20
62 67 43 24 168 128 64 31 107 54 147 45 98 94 89 103 109 83 192 None
Under 1 ~ 2y Under 2 ~ 5y Over 5 years Yes
No Yes No 1 2 Over 3 Yes No Yes No Yes No Yes No Last dental check up
Brushing after meal
Brushing before slumber
Number of daily brushing
Correct Brushing (Self Thought)
Brushing the tongue
Use of oral health items
Attended education over correct teeth brushing Total
Table 4. Subjective health status of the participants
classification frequency n(%)
51.0 49.0 39.1 60.9 51.6 48.4 34.9 65.1 21.9 78.1 100.0 98
94 75 117 99 93 67 125 42 150 192 Yes
No Yes No Yes No Yes No Yes No Oral discomfort
Oral pain and bleeding
Difficulty eating hard food
Oral dryness
Difficulty swallowing food
Total
출혈의 경험이 없는 대상자가 117명(60.9%), 딱딱한 음식 섭취 시 불편감이 있는 대상자가 99명(51.6%), 입안이 마 르는 증상을 느끼지 않는 대상자(구강 건조)가125명
(65.1%), 음식 삼키기 힘든 경험이 없는 대상자(연하곤란)
가 150명(78.1%)으로 각각 나타났다.
4. 조사대상자의 일반적 특성과 주관적 구강건강 1) 일반적 특성과 구강 불편
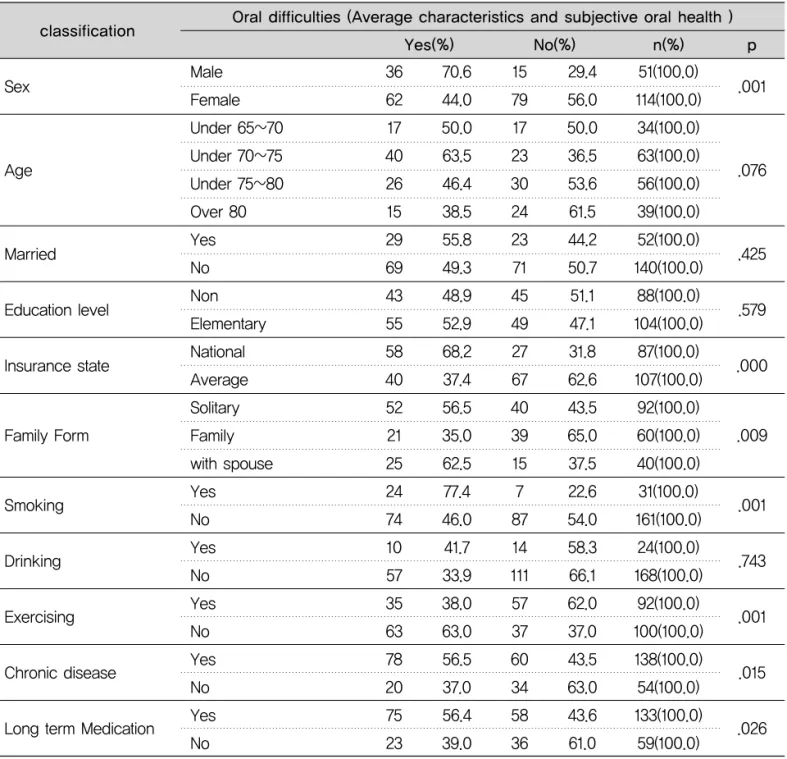
일반적 특성과 구강 불편의 분포는 <Table 5>와 같다.
남자가 의료 급여 수급자가 58명(68.2%), 배우자와 동 거하는 대상자가 25명(62.5%), 흡연자가 24명(77.4%),
운동을 하지 않는 대상자가 63명(63%), 만성질환자가 78 명(56.5%), 장기적 약물 복용 대상자가 75명(51.0%)으로 각각 높게 나타났고, 이는 통계적으로 유의한 차이가 있 었다.(P<0.05)
Table 5. Average charateristics and subjective oral health status of the participants
Unit : n(%)
Oral difficulties (Average characteristics and subjective oral health )
Yes(%) No(%) n(%) p
classification
Sex
Married
Education level
Insurance state
Family Form
Smoking
Drinking
Exercising
Chronic disease
Long term Medication Age
Male Female Under 65~70 Under 70~75 Under 75~80 Over 80 Yes No Non Elementary National Average Solitary Family with spouse Yes
No Yes No Yes No Yes No Yes No
36 62 17 40 26 15 29 69 43 55 58 40 52 21 25 24 74 10 57 35 63 78 20 75 23
70.6 44.0 50.0 63.5 46.4 38.5 55.8 49.3 48.9 52.9 68.2 37.4 56.5 35.0 62.5 77.4 46.0 41.7 33.9 38.0 63.0 56.5 37.0 56.4 39.0
15 79 17 23 30 24 23 71 45 49 27 67 40 39 15 7 87 14 111 57 37 60 34 58 36
29.4 56.0 50.0 36.5 53.6 61.5 44.2 50.7 51.1 47.1 31.8 62.6 43.5 65.0 37.5 22.6 54.0 58.3 66.1 62.0 37.0 43.5 63.0 43.6 61.0
51(100.0) 114(100.0) 34(100.0) 63(100.0) 56(100.0) 39(100.0) 52(100.0) 140(100.0)
88(100.0) 104(100.0)
87(100.0) 107(100.0)
92(100.0) 60(100.0) 40(100.0) 31(100.0) 161(100.0) 24(100.0) 168(100.0)
92(100.0) 100(100.0) 138(100.0) 54(100.0) 133(100.0) 59(100.0)
.001
.076
.425
.579
.000
.009
.001
.743
.001
.015
.026
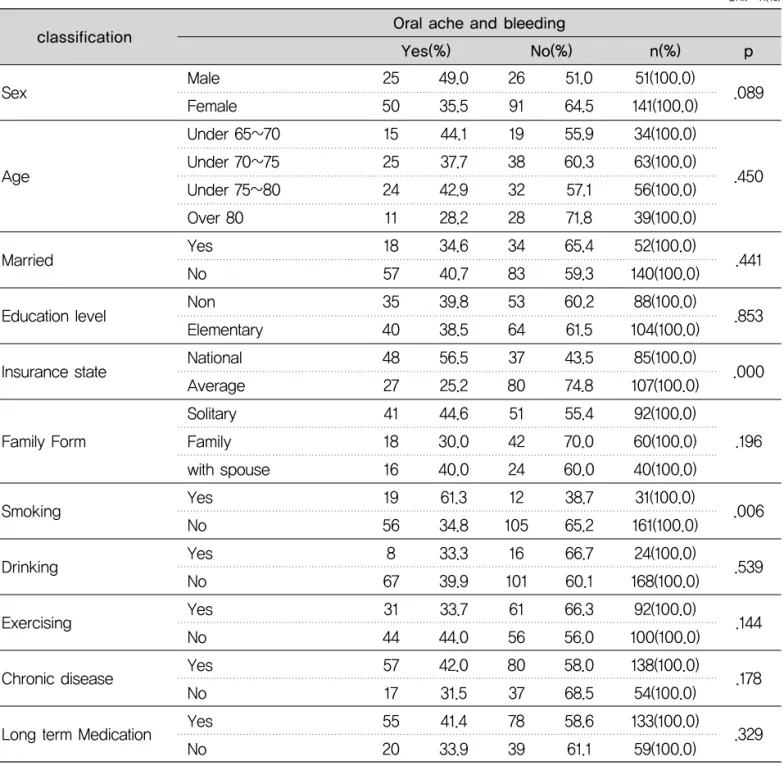
2) 조사대상자의 일반적 특성과 구강통증 및 출혈 조사대상자의 일반적 특성과 구강통증 및 출혈의 본포 는 <Table 6>과 같다.
의료 급여 수급자가 48명(56.5%), 흡연자가 19명
(61.3%)가 높았고, 이는 통계적으로 유의한 차이가 있었
다.(P<0.05)
Table 6. Average characteristics and the oral ache and bleeding of the participants
Unit : n(%)
Oral ache and bleeding
Yes(%) No(%) n(%) p
classification
Sex
Married
Education level
Insurance state
Family Form
Smoking
Drinking
Exercising
Chronic disease
Long term Medication Age
Male Female Under 65~70 Under 70~75 Under 75~80 Over 80 Yes No Non Elementary National Average Solitary Family with spouse Yes
No Yes No Yes No Yes No Yes No
25 50 15 25 24 11 18 57 35 40 48 27 41 18 16 19 56 8 67 31 44 57 17 55 20
49.0 35.5 44.1 37.7 42.9 28.2 34.6 40.7 39.8 38.5 56.5 25.2 44.6 30.0 40.0 61.3 34.8 33.3 39.9 33.7 44.0 42.0 31.5 41.4 33.9
26 91 19 38 32 28 34 83 53 64 37 80 51 42 24 12 105
16 101
61 56 80 37 78 39
51.0 64.5 55.9 60.3 57.1 71.8 65.4 59.3 60.2 61.5 43.5 74.8 55.4 70.0 60.0 38.7 65.2 66.7 60.1 66.3 56.0 58.0 68.5 58.6 61.1
51(100.0) 141(100.0) 34(100.0) 63(100.0) 56(100.0) 39(100.0) 52(100.0) 140(100.0)
88(100.0) 104(100.0)
85(100.0) 107(100.0)
92(100.0) 60(100.0) 40(100.0) 31(100.0) 161(100.0) 24(100.0) 168(100.0)
92(100.0) 100(100.0) 138(100.0) 54(100.0) 133(100.0) 59(100.0)
.089
.450
.441
.853
.000
.196
.006
.539
.144
.178
.329
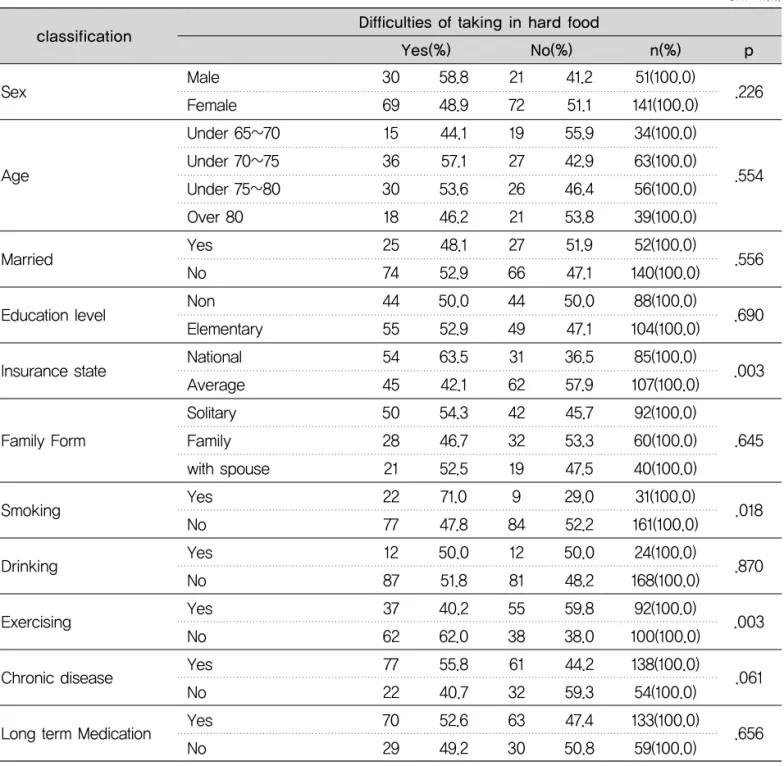
3) 조사대상자의 일반적 특성과 딱딱한 음식 섭취 불편 조사대상자의 일반적 특성과 딱딱한 음식 섭취 불편의 분포는 <Table 7>과 같다.
의료급여수급자가 54명(63.5%), 운동을 하지 않는 대상
자가62명(62.0%)으로 높았고, 통계적으로 유의한 차이가
있었다(P<0.05).
Table 7. The average characteristics and difficulties of taking in hard foods of the participants
Unit : n(%)
Difficulties of taking in hard food
Yes(%) No(%) n(%) p
classification
Sex
Married
Education level
Insurance state
Family Form
Smoking
Drinking
Exercising
Chronic disease
Long term Medication Age
Male Female Under 65~70 Under 70~75 Under 75~80 Over 80 Yes No Non Elementary National Average Solitary Family with spouse Yes
No Yes No Yes No Yes No Yes No
30 69 15 36 30 18 25 74 44 55 54 45 50 28 21 22 77 12 87 37 62 77 22 70 29
58.8 48.9 44.1 57.1 53.6 46.2 48.1 52.9 50.0 52.9 63.5 42.1 54.3 46.7 52.5 71.0 47.8 50.0 51.8 40.2 62.0 55.8 40.7 52.6 49.2
21 72 19 27 26 21 27 66 44 49 31 62 42 32 19 9 84 12 81 55 38 61 32 63 30
41.2 51.1 55.9 42.9 46.4 53.8 51.9 47.1 50.0 47.1 36.5 57.9 45.7 53.3 47.5 29.0 52.2 50.0 48.2 59.8 38.0 44.2 59.3 47.4 50.8
51(100.0) 141(100.0) 34(100.0) 63(100.0) 56(100.0) 39(100.0) 52(100.0) 140(100.0)
88(100.0) 104(100.0)
85(100.0) 107(100.0) 92(100.0) 60(100.0) 40(100.0) 31(100.0) 161(100.0) 24(100.0) 168(100.0)
92(100.0) 100(100.0) 138(100.0) 54(100.0) 133(100.0) 59(100.0)
.226
.554
.556
.690
.003
.645
.018
.870
.003
.061
.656
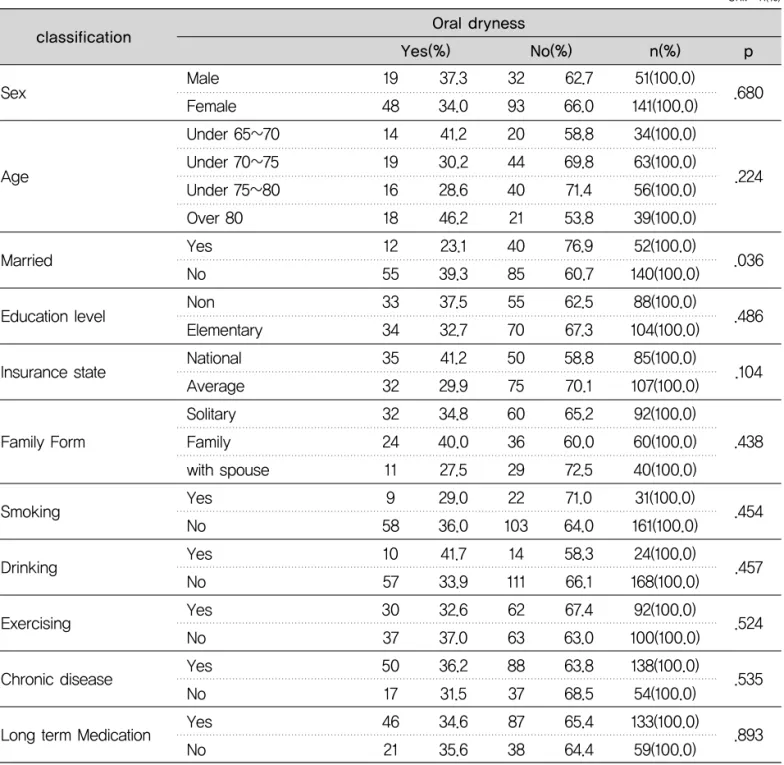
4) 조사대상자의 일반적 특성과 구강건조
전체조사대상자의 일반적 특성과 구강 건조 여부 분포 는 <Table 8>과 같이 배우자가 없는 대상자가 55명
(39.3%)으로 나타났고, 이는 통계적으로 유의한 차이가
있었다.
Table 8. The average characteristics of and the oral dryness of the participants
Unit : n(%)
Oral dryness
Yes(%) No(%) n(%) p
classification
Sex
Married
Education level
Insurance state
Family Form
Smoking
Drinking
Exercising
Chronic disease
Long term Medication Age
Male Female Under 65~70 Under 70~75 Under 75~80 Over 80 Yes No Non Elementary National Average Solitary Family with spouse Yes
No Yes No Yes No Yes No Yes No
19 48 14 19 16 18 12 55 33 34 35 32 32 24 11 9 58 10 57 30 37 50 17 46 21
37.3 34.0 41.2 30.2 28.6 46.2 23.1 39.3 37.5 32.7 41.2 29.9 34.8 40.0 27.5 29.0 36.0 41.7 33.9 32.6 37.0 36.2 31.5 34.6 35.6
32 93 20 44 40 21 40 85 55 70 50 75 60 36 29 22 103
14 111 62 63 88 37 87 38
62.7 66.0 58.8 69.8 71.4 53.8 76.9 60.7 62.5 67.3 58.8 70.1 65.2 60.0 72.5 71.0 64.0 58.3 66.1 67.4 63.0 63.8 68.5 65.4 64.4
51(100.0) 141(100.0) 34(100.0) 63(100.0) 56(100.0) 39(100.0) 52(100.0) 140(100.0)
88(100.0) 104(100.0)
85(100.0) 107(100.0)
92(100.0) 60(100.0) 40(100.0) 31(100.0) 161(100.0) 24(100.0) 168(100.0)
92(100.0) 100(100.0) 138(100.0) 54(100.0) 133(100.0) 59(100.0)
.680
.224
.036
.486
.104
.438
.454
.457
.524
.535
.893
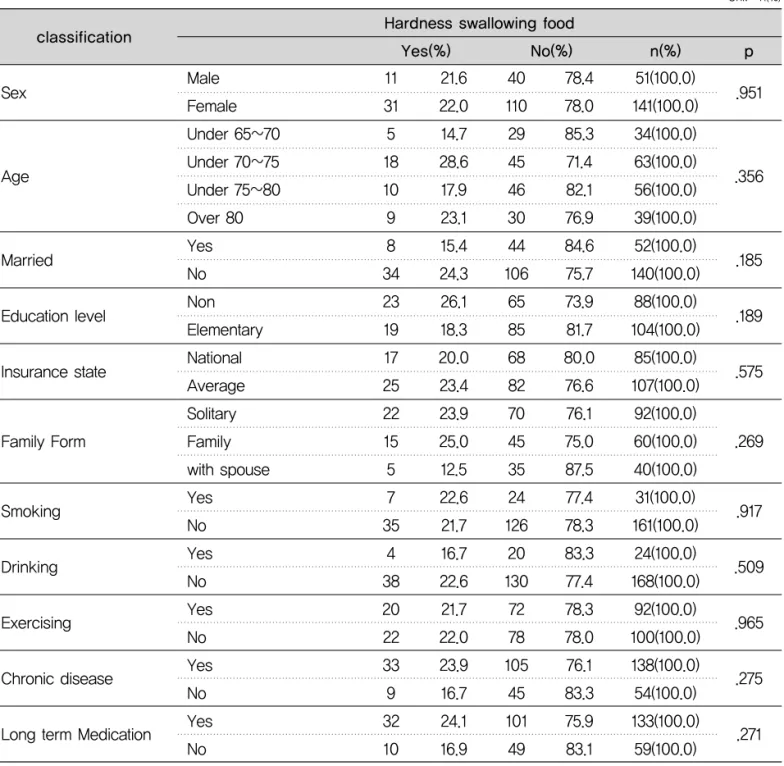
5) 조사대상자의 일반적 특성과 음식 삼킴 어려움(연하 곤란)
조사대상자의 일반적 특성과 음식 삼킴 어려움(연하곤
란) 여부의 분포는 <Table 9>와 같이 어떠한 특성에서도
유의한 차이가 없었다.
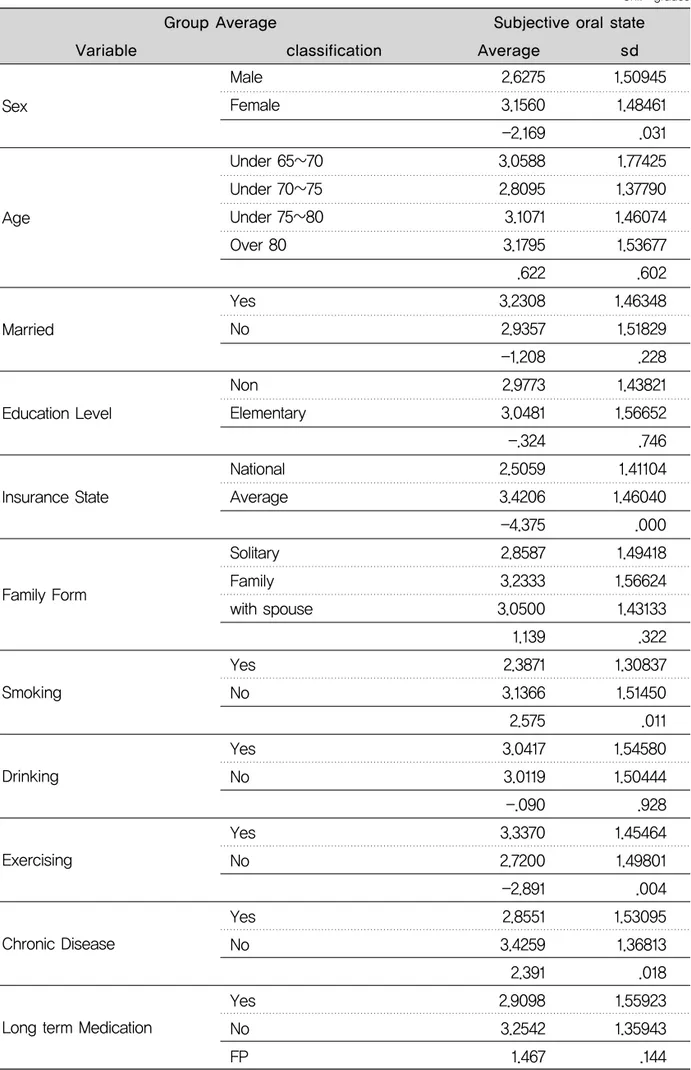
6) 조사대상자의 일반적 특성과 주관적 구강건강에 대 한 평균점수
조사대상자의 일반적 특성과 주관적 구강 건강을 분포 는 <Table 10>과 같다.
주관적 구강 건강 각 문항을 5점 척도화 하여 부정적 답
변에 가까울수록 1점, 긍정적 답변에 가까울수록 5점을 주어 채점 하여 나온 각 변수별 평균점수와 표준편차는 표1과 같다. 분석한 결과는 남자와 의료급여수급자, 흡연 자, 운동을 하지 않는 대상자, 만성질환자의 경우에 통계 적으로 유의한 차이가 있었다(P<0.05).
Table 9. The hardness of swallowing and average characteristic of the participants
Unit : n(%)
Hardness swallowing food
Yes(%) No(%) n(%) p
classification
Sex
Married
Education level
Insurance state
Family Form
Smoking
Drinking
Exercising
Chronic disease
Long term Medication Age
Male Female Under 65~70 Under 70~75 Under 75~80 Over 80 Yes No Non Elementary National Average Solitary Family with spouse Yes
No Yes No Yes No Yes No Yes No
11 31 5 18 10 9 8 34 23 19 17 25 22 15 5 7 35
4 38 20 22 33 9 32 10
21.6 22.0 14.7 28.6 17.9 23.1 15.4 24.3 26.1 18.3 20.0 23.4 23.9 25.0 12.5 22.6 21.7 16.7 22.6 21.7 22.0 23.9 16.7 24.1 16.9
40 110 29 45 46 30 44 106
65 85 68 82 70 45 35 24 126
20 130
72 78 105
45 101 49
78.4 78.0 85.3 71.4 82.1 76.9 84.6 75.7 73.9 81.7 80.0 76.6 76.1 75.0 87.5 77.4 78.3 83.3 77.4 78.3 78.0 76.1 83.3 75.9 83.1
51(100.0) 141(100.0) 34(100.0) 63(100.0) 56(100.0) 39(100.0) 52(100.0) 140(100.0)
88(100.0) 104(100.0)
85(100.0) 107(100.0) 92(100.0) 60(100.0) 40(100.0) 31(100.0) 161(100.0) 24(100.0) 168(100.0)
92(100.0) 100(100.0) 138(100.0) 54(100.0) 133(100.0) 59(100.0)
.951
.356
.185
.189
.575
.269
.917
.509
.965
.275
.271
Table 10. The subjective oral health points according to participant’ s average characteristics
Unit : grades
Variable classification
Group Average Subjective oral state
sd Average
1.50945 1.48461 .031 1.77425 1.37790 1.46074 1.53677 .602 1.46348 1.51829 .228 1.43821 1.56652 .746 1.41104 1.46040 .000 1.49418 1.56624 1.43133 .322 1.30837 1.51450 .011 1.54580 1.50444 .928 1.45464 1.49801 .004 1.53095 1.36813 .018 1.55923 1.35943 .144 2.6275
3.1560 -2.169 3.0588 2.8095 3.1071 3.1795 .622 3.2308 2.9357 -1.208 2.9773 3.0481 -.324 2.5059 3.4206 -4.375 2.8587 3.2333 3.0500 1.139 2.3871 3.1366 2.575 3.0417 3.0119 -.090 3.3370 2.7200 -2.891 2.8551 3.4259 2.391 2.9098 3.2542 1.467 Male
Female
Under 65~70 Under 70~75 Under 75~80 Over 80
Yes No
Non Elementary
National Average
Solitary Family with spouse
Yes No
Yes No
Yes No
Yes No
Yes No FP Sex
Married
Education Level
Insurance State
Smoking
Drinking
Exercising
Chronic Disease
Long term Medication Family Form
Age
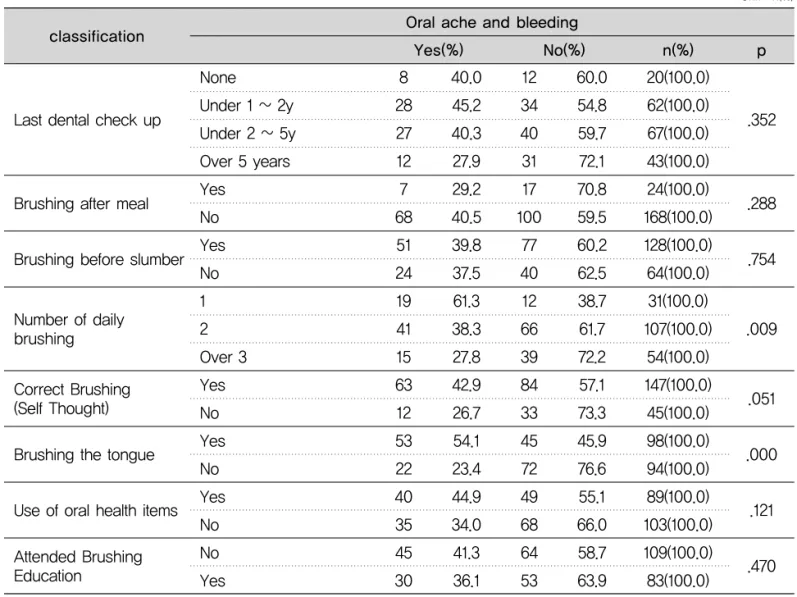
2) 구강위생행태와 구강 통증 및 출혈
조사대상자의 구강위생행태와 구강 통증 및 출혈 분포 는 <Table 12>와 같다.
1일 잇솔질 횟수가 1회인 대상자 중 구강통증 및 출혈을
느끼는 집단이 19명(61.3%), 혀 닦기를 하지 않는 집단에 서는 53명(54.1%)으로 높았으며, 통계적으로 유의한 차 이가 있었다(P<0.05).
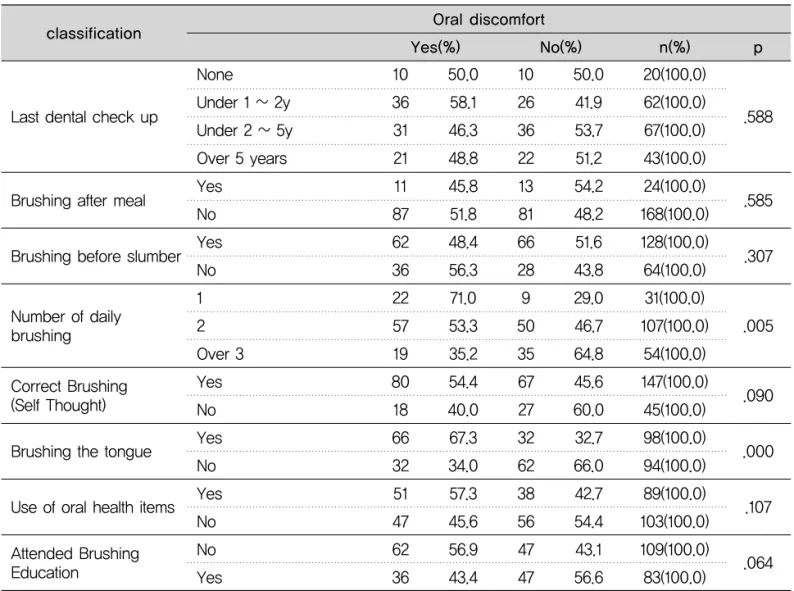
5. 구강위생행태와 주관적 구강건강 1) 구강위생행태와 구강 불편
조사대상자의 구강 위생 행태와 구강불편 분포는
<Table 11>과 같다.
하루 1회 잇솔질을 하는 대상자 중 구강 불편감을 느끼 는 집단이 22명(71.0%), 혀를 닦지 않는 집단에서는 66명 (67.3%)로 나타났으며, 통계학적으로 유의한 차이가 있었 다(P<0.05).
Table 11. Oral hygiene form and casualties
Unit : n(%)
Oral discomfort
Yes(%) No(%) n(%) p
classification
Last dental check up
Brushing after meal
Brushing before slumber
Correct Brushing (Self Thought)
Brushing the tongue
Use of oral health items
Attended Brushing Education
Number of daily brushing
None
Under 1 ~ 2y Under 2 ~ 5y Over 5 years Yes
No Yes No 1 2 Over 3 Yes No Yes No Yes No No Yes
10 36 31 21 11 87 62 36 22 57 19 80 18 66 32 51 47 62 36
50.0 58.1 46.3 48.8 45.8 51.8 48.4 56.3 71.0 53.3 35.2 54.4 40.0 67.3 34.0 57.3 45.6 56.9 43.4
10 26 36 22 13 81 66 28 9 50 35 67 27 32 62 38 56 47 47
50.0 41.9 53.7 51.2 54.2 48.2 51.6 43.8 29.0 46.7 64.8 45.6 60.0 32.7 66.0 42.7 54.4 43.1 56.6
20(100.0) 62(100.0) 67(100.0) 43(100.0) 24(100.0) 168(100.0) 128(100.0) 64(100.0) 31(100.0) 107(100.0)
54(100.0) 147(100.0) 45(100.0) 98(100.0) 94(100.0) 89(100.0) 103(100.0) 109(100.0) 83(100.0)
.588
.585
.307
.005
.090
.000
.107
.064
Table 12. Oral hygiene form, oral ache and bleeding
Unit : n(%)
Oral ache and bleeding
Yes(%) No(%) n(%) p
classification
Last dental check up
Brushing after meal
Brushing before slumber
Correct Brushing (Self Thought)
Brushing the tongue
Use of oral health items
Attended Brushing Education
Number of daily brushing
None
Under 1 ~ 2y Under 2 ~ 5y Over 5 years Yes
No Yes No 1 2 Over 3 Yes No Yes No Yes No No Yes
8 28 27 12 7 68 51 24 19 41 15 63 12 53 22 40 35 45 30
40.0 45.2 40.3 27.9 29.2 40.5 39.8 37.5 61.3 38.3 27.8 42.9 26.7 54.1 23.4 44.9 34.0 41.3 36.1
12 34 40 31 17 100
77 40 12 66 39 84 33 45 72 49 68 64 53
60.0 54.8 59.7 72.1 70.8 59.5 60.2 62.5 38.7 61.7 72.2 57.1 73.3 45.9 76.6 55.1 66.0 58.7 63.9
20(100.0) 62(100.0) 67(100.0) 43(100.0) 24(100.0) 168(100.0) 128(100.0) 64(100.0) 31(100.0) 107(100.0)
54(100.0) 147(100.0) 45(100.0) 98(100.0) 94(100.0) 89(100.0) 103(100.0) 109(100.0) 83(100.0)
.352
.288
.754
.009
.051
.000
.121
.470
3) 구강위생행태와 딱딱한 음식 섭취 불편
조사대상자의 구강위생행태와 딱딱한 음식 저작 불편에 따른 분포는 <Table 13>과 같이 1일 잇솔질 횟수가 1회인
대상자 중 딱딱한 음식 섭취 불편을 느끼는 집단이 21명
(67.7%), 혀 닦기를 하지 않는 집단에서는 61명(62.2%)
높았으며, 통계적으로 유의한 차이가 있었다(P<0.05).
4) 구강위생행태와 구강건조
조사대상자의 구강위생행태와 구강건조의 분포는
<Table 14>와 같다. 1일 잇솔질 횟수가 1회인 대상자중 구 강건조를 느끼는 집단이 15명(48.4%), 올바른 잇솔질 방
법을 모르는 대상자 집단은 57명(38.8%), 혀 닦기를 하지 않는 대상자 집단에서는 46명(46.9%)으로 나타났으며, 통계적으로도 유의한 차이가 있었다(P<0.05).
Table 13. Oral hygiene form and difficulties of chewing hard food
Unit : n(%)
difficulties of chewing hard food
Yes(%) No(%) n(%) p
classification
Last dental check up
Brushing after meal
Brushing before slumber
Correct Brushing (Self Thought)
Brushing the tongue
Use of oral health items
Attended Brushing Education
Number of daily brushing
None
Under 1 ~ 2y Under 2 ~ 5y Over 5 years Yes
No Yes No 1 2 Over 3 Yes No Yes No Yes No No Yes
9 33 30 27 11 88 67 32 21 57 21 81 18 61 38 50 49 61 38
45.0 43.2 44.8 62.8 45.8 52.4 52.3 50.0 67.7 53.3 39.9 55.1 40.0 62.2 40.4 56.2 47.6 56.0 45.8
11 29 37 16 13 80 61 32 10 50 33 66 27 37 56 39 54 48 45
55.0 46.8 55.2 37.2 54.2 47.6 47.7 50.0 32.3 46.7 61.1 44.9 60.0 37.8 59.6 43.8 52.4 44.0 54.2
20(100.0) 62(100.0) 67(100.0) 43(100.0) 24(100.0) 168(100.0) 128(100.0) 64(100.0) 31(100.0) 107(100.0)
54(100.0) 147(100.0) 45(100.0) 98(100.0) 94(100.0) 89(100.0) 103(100.0) 109(100.0) 83(100.0)
.282
.548
.759
.033
.076
.002
.234
.162
5) 구강위생행태와 음식 삼킴 어려움(연하곤란) 조사대상자의 구강위생행태와 음식 삼킴 어려움(연하곤 란) 분포는 <Table 15>와 같이 혀 닦기를 하지 않는 대상 자중 음식 삼킴 어려움을 느끼는 집단이 32명(32.7%), 잇
솔질 방법 교육 경험이 없는 대상자 집단은 30명(27.5%) 으로 나타났으며, 통계적으로 유의한 차이가 있었다 (P<0.05).
Table 14. Oral hygiene form and the dryness of oral
Unit : n(%)
oral dryness
Yes(%) No(%) n(%) p
classification
Last dental check up
Brushing after meal
Brushing before slumber
Correct Brushing (Self Thought)
Brushing the tongue
Use of oral health items
Attended Brushing Education
Number of daily brushing
None
Under 1 ~ 2y Under 2 ~ 5y Over 5 years Yes
No Yes No 1 2 Over 3 Yes No Yes No Yes No No Yes
11 20 23 13 5 62 44 23 15 42 10 57 10 46 21 33 34 44 23
55.0 32.3 34.3 30.2 20.8 36.9 34.4 35.9 48.4 39.3 18.5 38.8 22.2 46.9 22.3 37.1 33.0 40.4 27.7
9 42 44 30 19 106
84 41 16 65 44 90 35 52 73 56 69 65 60
45.0 67.7 65.7 69.8 79.2 63.1 65.6 64.1 51.6 60.7 81.5 61.2 77.8 53.1 77.7 62.9 67.0 59.6 72.3
20(100.0) 62(100.0) 67(100.0) 43(100.0) 24(100.0) 168(100.0) 128(100.0) 64(100.0) 31(100.0) 107(100.0)
54(100.0) 147(100.0) 45(100.0) 98(100.0) 94(100.0) 89(100.0) 103(100.0) 109(100.0) 83(100.0)
.244
.122
.830
.008
.042
.000
.555
.068
6) 조사대상자의 구강위생행태와 주관적 구강 건강상 태의 평균점수
조사대상자의 구강위생행태와 주관적 구강 건강상태의 평균점수는 <Table 16>과 같다.
주관적 구강건강 상태의 평균 점수는 주관적 구강건강 각 문항을 5점 척도화 하여 부정적 답변에 가까울수록 1
점, 긍정적 답변에 가까울수록 5점을 주어 채점 하여 나온 각 변수별 평균점수와 표준편차는 <Table 16>과 같다. 분 석한 결과는 하루 잇솔질 1회, 올바른 잇솔질을 하지 않는 다고 자각하는 대상자, 구강교육 무경험자, 혀를 닦지 않 는 대상자에서 통계학적으로 유의한 차이가 있었다.
Table 15. Oral hygiene form and difficulty swallowing food
Unit : n(%)
Difficulties swallowing food
Yes(%) No(%) n(%) p
classification
Last dental check up
Brushing after meal
Brushing before slumber
Correct Brushing (Self Thought)
Brushing the tongue
Use of oral health items
Attended Brushing Education
Number of daily brushing
None
Under 1 ~ 2y Under 2 ~ 5y Over 5 years Yes
No Yes No 1 2 Over 3 Yes No Yes No Yes No No Yes
6 12 13 11 2 40 29 13 11 22 9 35
7 32 10 14 28 30 12
30.0 19.4 19.4 25.6 8.3 23.8 22.7 20.3 35.5 20.6 16.7 23.8 15.6 32.7 10.6 15.7 27.2 27.5 14.5
14 50 54 32 22 128
99 51 20 85 45 112 38 66 84 75 75 79 71
70.0 80.6 80.6 74.4 91.7 76.2 77.3 79.7 64.5 79.4 83.3 76.2 84.4 67.3 89.4 84.3 72.8 72.5 85.5
20(100.0) 62(100.0) 67(100.0) 43(100.0) 24(100.0) 168(100.0) 128(100.0) 64(100.0) 31(100.0) 107(100.0)
54(100.0) 147(100.0) 45(100.0) 98(100.0) 94(100.0) 89(100.0) 103(100.0) 109(100.0) 83(100.0)
.662
.086
.711
.115
.241
.000
.056
.030
Table 16. Oral health average points according to participants’ oral hygiene form
Unit : grades