https://doi.org/10.5468/ogs.2019.62.6.420 pISSN 2287-8572 · eISSN 2287-8580
Introduction
Polycystic ovary syndrome (PCOS) is a common gynecological endocrine disorder that occurs during a woman’s reproduc- tive years. It is characterized by a wide spectrum of endocrine and metabolic disorders, including obesity, hyperandrogen- ism, insulin resistance, and loss of the intraovarian autoregu- latory mechanism, resulting in anovulation, dyslipidemia, and
Association of serum levels of vascular endothelial growth factor and thrombospondin-1 to body mass
index in polycystic ovary syndrome: a case-control study
Zoya Tahergorabi
1, Fatemeh Salmani
2, Samira Hooshmand Jonaidabad
3, Bahere Behdani
3, Parisa Yazdi
3, Mahmoud Zardast
4, Mitra Moodi
51
Medical Toxicology and Drug Abuse Research Center (MTDRC), Department of Physiology, School of Medicine,
2Social Determinants of Health Research Center, School of Health,
3Member of Student Research Committee, School of Medicine,
4Cellular and Molecular Research Center, Department of Pathology, School of Medicine,
5Social Determinants of Health Research Center, Department of Health Education, School of Health, Birjand University of Medical Sciences, Birjand, Iran
Purpose
Polycystic ovary syndrome (PCOS) is a gynecological endocrine disorder that is characterized by disturbances in ovarian blood flow and angiogenesis. The aim of this study was to determine the association of vascular endothelial growth factor (VEGF) and thrombospondin-1 (TSP-1) serum levels with the body mass index (BMI) in patients with PCOS compared with healthy subjects.
Methods
The study was conducted with 80 subjects in 3 PCOS groups, including normal weight, overweight, and obese PCOS groups, and a control group of healthy subjects (n=20). The participants in all groups completed a questionnaire comprising sociodemographic and obstetric questions. The PCOS diagnosis in the study subjects was confirmed based on the Rotterdam criteria, BMI was determined according to the World Health Organization guidelines, and the lipid accumulation product index was calculated for all groups. Venous blood samples were collected from all participants after fasting to measure the serum levels of fasting blood glucose (FBG), lipids, insulin, VEGF, TSP-1, and leptin.
Results
Our findings showed that the serum VEGF level was significantly higher in the normal BMI PCOS group than that in the control group (P=0.03), and the TSP-1 level was significantly lower in the obese PCOS group than that in the control group (P=0.04).
Conclusions
Our study demonstrated that alterations in VEGF and TSP-1 concentrations are dependent on BMI. Because abnormal ovarian angiogenesis is considered to be the main feature of PCOS, the study of ovarian angiogenic imbalance is proposed as a new tool for PCOS diagnosis and management.
Keywords: Body mass index; Polycystic ovarian syndrome; Thrombospondin-1; Vascular endothelial growth factor
Received: 2019.02.22. Revised: 2019.04.15. Accepted: 2019.06.16.
Corresponding author: Mitra Moodi
Social Determinants of Health Research Center, Department of Health Education, School of Health, Birjand University of Medical Sciences, Birjand, Iran
E-mail: [email protected] https://orcid.org/0000-0002-8877-6609
Articles published in Obstet Gynecol Sci are open-access, distributed under the terms of the Creative Commons Attribution Non-Commercial License (http://creativecommons.
org/licenses/by-nc/3.0/) which permits unrestricted non-commercial use, distribution, and reproduction in any medium, provided the original work is properly cited.
Copyright © 2019 Korean Society of Obstetrics and Gynecology
hyperglycemia [1,2]. Although a high percentage of women with PCOS are obese, 40–50% of women with PCOS are not obese. Thus, obesity per se is not necessarily intrinsic to PCOS, as insulin resistance is present in lean patients with PCOS as well as in obese ones [3,4].
PCOS, as many other complex syndromes, does not have a single diagnostic marker to provide a gold standard for reference. Consequently, several sets of criteria have been proposed for its diagnosis. However, the disparity between the diagnosis guidelines, although minor, has been associ- ated with a variation in the diagnosis and treatment of PCOS. For example, the Rotterdam criteria were developed based on expert opinions and are valuable both clinically and scientifically. In 2012, the PCOS Consensus Workshop Group at its third meeting reported that the diagnosis of PCOS in adolescents is similar to that in adults and should thus meet the Rotterdam criteria [5,6]. PCOS can be diagnosed by the presence of 2 of the following 3 features: 1) oligo- or anovu- lation, 2) clinical and/or biochemical signs of hyperandrogen- ism, and 3) polycystic ovaries on ultrasonography [7].
The coordinated interaction between pro- and anti- angiogenic factors within the ovary creates a complex pro- cess of angiogenesis that regulates important physiological processes, such as ovarian folliculogenesis, ovulation, and formation of the corpus luteum, which require angiogenesis.
Angiogenesis is defined as the formation of new blood ves- sels from preexisting vasculature and as such, it is activated in the wound healing process and is also involved in the female reproductive system during non-pregnant menstrual cycles and during the implantation of embryos in pregnancy [8].
The pathogenesis of PCOS is not well understood; how- ever, accumulating evidence suggests that a disturbance in the ovarian blood flow and angiogenesis leads to disorders of ovulation and subfertility in women with PCOS [9].
Angiogenic and angiostatic factors, such as the vascular endothelial growth factor (VEGF) family, angiopoietin, basic fibroblast growth factor (bFGF), transforming growth factor β (TGFβ), matrix metalloproteinase, platelet-derived growth factor (PDGF), and thrombospondin (TSP-1) are coordinately expressed during the ovarian cycle [10].
Human VEGF, the most prominent and potent angiogenic factor in cyclic angiogenesis and vascular permeability, stimu- lates endothelial proliferation, migration, and survival [10].
Several studies have demonstrated that increased ovarian vascularity correlates with increased serum VEGF levels in
women with PCOS [11,12]. In a study by Loebig et al. [13]
in 2010, the authors demonstrated a positive correlation between the plasma VEGF concentration and a large body mass index (BMI) range between 17.6 kg/m
2and 43.6 kg/m
2in healthy male subjects.
TSP-1, originally isolated from platelets and megakaryo- cytes, can inhibit follicular angiogenesis and induce apopto- sis in granulosa cells [13]. It has been shown that a reduced expression of TSP-1 can lead to aggressive angiogenesis [14].
In a 2008 study by Varma et al. [15] on TSP-1 gene expres- sion in the subcutaneous adipose tissue, TSP-1 had a positive association with the BMI in 86 nondiabetic subjects across a wide range of BMI. This result is in contrast to that of a 2009 investigation by Tan et al. [16] where 19 women with PCOS and 54 women in a control group were recruited from an in- fertility clinic. In that study, 5 subjects with PCOS and 7 sub- jects in the control group withdrew before the study could be completed, but there were no significant associations between the circulating TSP-1 and the TSP-1 levels in the adipose tissue with the BMI [15,16]. It can thus be concluded that TSP-1 might have bidirectional effects.
To the best of our knowledge, there are few studies on the relationship between angiogenic and angiostatic factors and BMI in PCOS. Therefore, the current study aimed to deter- mine the association of VEGF and TSP-1 serum levels with the BMI in patients with PCOS compared with healthy sub- jects.
Materials and methods
The present case-control study was conducted in the Depart- ment of Physiology in collaboration with the Department of Biochemistry and Obstetrics and Gynecology at Birjand University of Medical Sciences. The research protocol was approved by the Institutional Review Board of the research committee of Birjand University of Medical Sciences, and the study was performed in accordance with the approved guidelines.
The subjects in the study were 80 women, aged 15–45
years, from the South Khorasan province of Birjand. The
sample size was estimated to be 19.3 persons based on the
formula for comparing 2 means, and the results of the Max-
well study and the homeostasis model assessment (HOMA)
index with S1=0.6, S2=1.8, d=1.4, α=0.05 and β=0.1, in
which 20 women in each group were considered [17].
Among the 80 subjects, there were 60 women with PCOS, including 20 women of normal weight based on the BMI (18.5<BMI<24.9), 20 overweight women (25>BMI>29.9), and 20 obese women (BMI≥30), and 20 healthy women (control group). The control group was selected randomly from healthy females who were referred to the Birjand Health Lab Center for premarital tests, environmental, and occupational healthcare. Case and control groups were matched for age. None of the patients with PCOS were tak- ing drugs for at least 6 months prior to the study.
A history of other causes of hyperandrogenism, such as congenital adrenal hyperplasia, androgen secreting tumor, Cushing’s syndrome, and other insulin resistance conditions (acromegaly), hypothyroidism, hyperprolactinemia, preg- nancy, menopause, and use of medications resulted in with- drawal of individuals from the study.
Participants in all groups completed the study question- naire after consent was provided according to the criteria of the Ethics Committee of the Faculty of Medicine of the Birjand University of Medical Sciences. The sociodemographic section of the 2-part questionnaire included questions about age, education level, spouse’s education level, marriage age, first gestational age, number of children, and smoking status. The obstetric questions pertained to gravidity, parity, abortion(s), number of live births, first menstrual age, regu- larity of menstrual bleeding, contraception method, usage of assisted reproductive treatment, and duration of PCOS.
PCOS diagnosis was confirmed in the case groups accord- ing to the Rotterdam criteria, including oligo- or anovulatory menstrual cycle, defined as a menstrual period lasting more than 40 days or fewer than 9 cycles per year. Clinical or laboratory hyperandrogenism would include hirsutism, the growth of terminal hair above the upper lip and on the chin/
face, chest, back, abdomen, arms, and thighs based on the Ferriman-Gallwey scoring system, where hirsutism is defined as a score above 8 or increased levels of testosterone and/or dehydroepiandrosterone [18]. Abdominal sonography was performed during the first 5 days of the normal menstrual cycle. A sonogram result for polycystic ovaries according to the Rotterdam criteria is considered to be 12 or more follicles in each ovary with a diameter of 2 to 9 mm [19].
1. Anthropometric measurements
The weight and height of all case and control group partici-
pants were measured. The participants were weighed on a calibrated scale while wearing light clothes and no shoes (Seca, Hamburg, Germany) and height without shoes was measured using a stadiometer with a fixed vertical backboard and an adjustable headpiece. BMI was calculated by tak- ing the weight in kg divided by the square of the height in meters and then graded according to the World Health Or- ganization (WHO) classification [20]. The lipid accumulation product (LAP) index was calculated based on the following formula: (waist circumference [cm]) - 58)×fasting concentra- tion of circulation triglycerides [21]. Insulin resistance in the patients with PCOS was based on a cutoff point of 34.5 [22].
2. Sample collection
Following an overnight fast (12 hours), participants’ blood samples were taken from the left brachial vein under aseptic conditions for measurement of the serum levels of FBS, low- density lipoprotein cholesterol (LDL-C), high-density lipopro- tein cholesterol (HDL-C), triglycerides, insulin (type 6000, Cobas, Hitachi, Tokyo, Japan), VEGF (human VEGF ELISA Kit, Hangzhou EastbiopharmCo., Ltd, USA), TSP-1 (human TSP-1 ELISA Kit, Hangzhou EastbiopharmCo., Ltd), and leptin (hu- man leptin ELISA Kit, Hangzhou EastbiopharmCo., Ltd).
3. Statistical analysis
Data were reported as mean±standard deviation. The normal
distribution of the data was assessed using the Kolmogorov-
Smirnov test. One-way analysis of variance (ANOVA), Krus-
kal-Wallis, Pearson, and Spearman correlation tests were
conducted for comparison of the variables among the PCOS
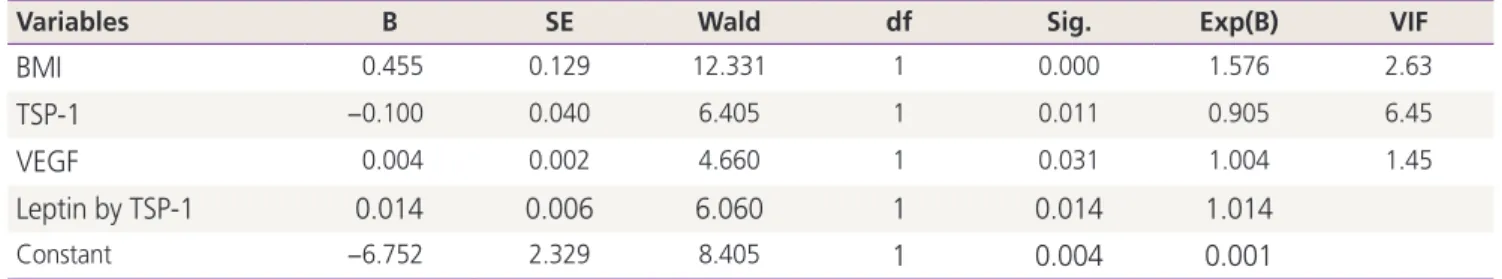
groups and the control group. Secondary analyses were lo-
gistic regression models. A model was applied to compute
the probability for PCOS by controlling for potential con-
founders and estimating the odds ratio. We used principal
component analysis and the forward method for selection of
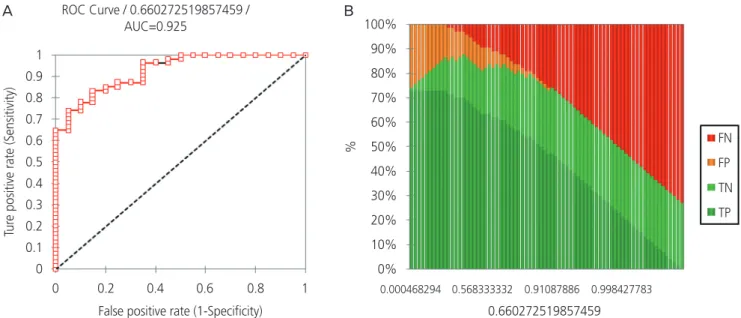
the best regression analysis. In addition, the receiver operat-
ing characteristic (ROC) curve was applied for determining
the power of prediction of the proposed model. SPSS Version
16 Statistical Package (IBM Corporation, Armonk, NY, USA)
and Excel 2010 (Microsoft Co. Redmond, WA, USA) were
used for the statistical analysis. A P-value <0.05 was consid-
ered statistically significant for all statistical tests.
Results
Our results consisted of three sections: Section 1 includes de- scriptive statistics and one-way ANOVA results for comparing the means among the 4 groups. In section 2, logistic regres- sion results are presented, and section 3 includes the final model for making predictions about PCOS.
1. Descriptive statistics and one-way analysis of variance
The study included 80 women participants in 4 groups:
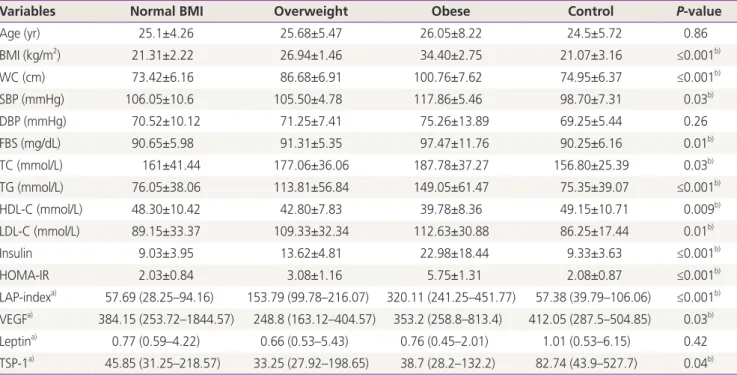
normal, overweight, and obese BMI patients with PCOS and a control group. The groups were matched in terms of age (P=0.68), occupation (P=0.05), residence (P=0.06), and income status (P=0.4). Table 1 shows a demographic, anthropometric, biochemical, and hormonal profiles of the cases and the control group. The Bonferroni post hoc test showed that serum levels of FBS and triglycerides were sig- nificantly higher in the obese PCOS group than in the normal BMI PCOS group (P=0.04, P≤0.001) and the control group
(P=0.03, P≤0.001). The total cholesterol (P=0.04) and LDL- C (P=0.03) levels in the obese PCOS group were significantly higher than those of the control group, and HDL-C was sig- nificantly lower in the obese PCOS group than in the normal BMI PCOS (P=0.04) and control groups (P=0.01).
Homeostatic model assessment for insulin resistance (HOMA-IR) was significantly higher in the obese PCOS group than in the normal BMI PCOS (P=0.001) and the control group (P=0.002). Thirty-one percent of the overweight pa- tients with PCOS and 53% of the obese patients with PCOS had insulin resistance, whereas this trait was only present in 5% of the patients of the normal BMI and control groups (HOMA-IR≥3.8).
The plasma VEGF level was significantly higher in the nor- mal BMI PCOS group than in the control group (Fig. 1), and TSP-1 was significantly lower in the obese PCOS group than in the control group (Fig. 2). The correlation between HOMA- IR and the LAP-index is shown in Figure A in the Supplemen- tary Data 1. The LAP-index was positively correlated with HOMA-IR (r=0.73, P≤0.001).
Table 1. Comparison of the demographic, biochemical, and hormonal profile of the study participants in the four groups
Variables Normal BMI Overweight Obese Control P-value
Age (yr) 25.1±4.26 25.68±5.47 26.05±8.22 24.5±5.72 0.86
BMI (kg/m
2) 21.31±2.22 26.94±1.46 34.40±2.75 21.07±3.16 ≤0.001
b)WC (cm) 73.42±6.16 86.68±6.91 100.76±7.62 74.95±6.37 ≤0.001
b)SBP (mmHg) 106.05±10.6 105.50±4.78 117.86±5.46 98.70±7.31 0.03
b)DBP (mmHg) 70.52±10.12 71.25±7.41 75.26±13.89 69.25±5.44 0.26
FBS (mg/dL) 90.65±5.98 91.31±5.35 97.47±11.76 90.25±6.16 0.01
b)TC (mmol/L) 161±41.44 177.06±36.06 187.78±37.27 156.80±25.39 0.03
b)TG (mmol/L) 76.05±38.06 113.81±56.84 149.05±61.47 75.35±39.07 ≤0.001
b)HDL-C (mmol/L) 48.30±10.42 42.80±7.83 39.78±8.36 49.15±10.71 0.009
b)LDL-C (mmol/L) 89.15±33.37 109.33±32.34 112.63±30.88 86.25±17.44 0.01
b)Insulin 9.03±3.95 13.62±4.81 22.98±18.44 9.33±3.63 ≤0.001
b)HOMA-IR 2.03±0.84 3.08±1.16 5.75±1.31 2.08±0.87 ≤0.001
b)LAP-index
a)57.69 (28.25–94.16) 153.79 (99.78–216.07) 320.11 (241.25–451.77) 57.38 (39.79–106.06) ≤0.001
b)VEGF
a)384.15 (253.72–1844.57) 248.8 (163.12–404.57) 353.2 (258.8–813.4) 412.05 (287.5–504.85) 0.03
b)Leptin
a)0.77 (0.59–4.22) 0.66 (0.53–5.43) 0.76 (0.45–2.01) 1.01 (0.53–6.15) 0.42 TSP-1
a)45.85 (31.25–218.57) 33.25 (27.92–198.65) 38.7 (28.2–132.2) 82.74 (43.9–527.7) 0.04
b)Values are presented as mean±standard deviation (ANOVA test).
BMI, body mass index; WC, waist circumference; SBP, systolic blood pressure; DBP, diastolic blood pressure; FBS, fasting blood sugar; TC, total cholesterol; TG, triglyceride; HDL-C, high-density lipoprotein cholesterol; LDL-C, low density lipoprotein cholesterol; HOMA, homeostasis model assessment; LAP, lipid accumulation product; VEGF, vascular endothelial growth factor; TSP-1, thrombospondin-1.
a)