Differences in mandibular condyle and glenoid fossa morphology in relation to vertical and sagittal skeletal patterns: A cone-beam computed tomography study
Objective: This study aimed to evaluate the following null hypothesis: there are no differences in the morphology of the temporomandibular joint (TMJ) structures in relation to vertical and sagittal cephalometric patterns. Methods:
This retrospective study was performed with 131 participants showing no TMJ symptoms. The participants were divided into Class I, II, and III groups on the basis of their sagittal cephalometric relationships and into hyperdivergent, normodivergent, and hypodivergent groups on the basis of their vertical cephalometric relationships. The following measurements were performed using cone-beam computed tomography images and compared among the groups: condylar volume, condylar size (width, length, and height), fossa size (length and height), and condyle-to-fossa joint spaces at the anterior, superior, and posterior condylar poles. Results: The null hypothesis was rejected. The Class III group showed larger values for condylar width, condylar height, and fossa height than the Class II group (p < 0.05). Condylar volume and superior joint space in the hyperdivergent group were significantly smaller than those in the other two vertical groups (p < 0.001), whereas fossa length and height were significantly larger in the hyperdivergent group than in the other groups (p < 0.01). The hypodivergent group showed a greater condylar width than the hyperdivergent group (p < 0.01). The sagittal and vertical cephalometric patterns showed statistically significant interactions for fossa length and height.
Conclusions: TMJ morphology differed across diverse skeletal cephalometric patterns. The fossa length and height were affected by the interactions of the vertical and sagittal skeletal patterns.
[Korean J Orthod 2021;51(2):126-134]
Key words: Temporomandibular joint, Cone-beam computed tomography, Cephalometrics
Kyoung Jin Noh
aHyoung-Seon Baik
bSang-Sun Han
cWoowon Jang
aYoon Jeong Choi
ba
Private Practice, Seoul, Korea
b
Department of Orthodontics, The Institute of Craniofacial Deformity, Yonsei University College of Dentistry, Seoul, Korea
c
Department of Oral and Maxillofacial Radiology, Yonsei University College of Dentistry, Seoul, Korea
Received March 12, 2020; Revised September 21, 2020; Accepted November 16, 2020.
Corresponding author: Yoon Jeong Choi.
Associate Professor, Department of Orthodontics, The Institute of Craniofacial Deformity, Yonsei University College of Dentistry, 50-1 Yonsei-ro, Seodaemun-gu, Seoul 03722, Korea.
Tel +82-2-2228-3101 e-mail [email protected]
How to cite this article: Noh KJ, Baik HS, Han SS, Jang W, Choi YJ. Differences in mandibular condyle and glenoid fossa morphology in relation to vertical and sagittal skeletal patterns: A cone-beam computed tomography study. Korean J Orthod 2021;51:126-134.
© 2021 The Korean Association of Orthodontists.
This is an Open Access article distributed under the terms of the Creative Commons Attribution Non-Commercial License (http://creativecommons.org/licenses/by-nc/4.0) which permits unrestricted non-commercial use, distribution, and reproduction in any medium, provided the original work is properly cited.
pISSN 2234-7518 • eISSN 2005-372X
https://doi.org/10.4041/kjod.2021.51.2.126
INTRODUCTION
The temporomandibular joint (TMJ) is an anatomical structure with significant implications in dental practice.
The mandibular condyle is a part of the TMJ structure, and its shape and volume play important roles in the long-term stability of treatment outcomes in prosth- odontic, orthodontic, and orthognathic patients.
1,2Therefore, dental practitioners should consider the mor- phology and positioning of the condyle throughout the treatment process.
The position and size of the mandibular condyle can be determined on the basis of the craniofacial mor- phology
3-9and may be changed by temporomandibular disorder (TMD).
10-14The condyle and fossa are loaded differently in each individual because of individual dif- ferences in craniofacial morphology.
4,5These differences in loading result in different TMJ morphologies,
15indi- cating that the craniofacial morphology can influence the position and size of the condyle and glenoid fossa.
Internal derangement of the TMJ can also affect the condyle. An anteriorly displaced disc may reduce the size of the mandibular condyle, which may not be recovered even after the TMD issues are resolved.
10,13The role of TMJ morphology as a diagnostic and prognostic indicator of orthodontic treatment has been investigated in relation to craniofacial features.
8,16,17The condyle exhibited a larger volume in patients with skel- etal Class III malocclusion than in those with a Class II malocclusion.
5,7Moreover, patients with a hyperdivergent facial profile showed a smaller volume and more supe- rior position of the condyle than those with a hypodi- vergent profile.
6,18Nevertheless, the influences of the craniofacial skeletal patterns on TMJ morphology based on the interactive effects of the sagittal and vertical cephalometric relationships have not been comprehen- sively understood, although these interrelationships are responsible for various facial types.
18,19Several methods, such as conventional radiogra- phy, magnetic resonance imaging, and computed to- mography (CT), have been used to examine the TMJ structure.
3,5,12Cone-beam CT (CBCT) has been recently introduced for measurements of bony structure since it produces high-resolution images with minimal distor- tion and less radiation dosage than conventional CT.
11,20Three-dimensional (3D) CBCT images allow measure- ments of volumes and lengths in multiple planes, which can contribute to accurate diagnoses and predictable treatment outcomes.
2The differences of TMJ morphol- ogy based on the interactive effects of the sagittal and vertical cephalometric relationships were barely investi- gated using 3D images. Therefore, this study aimed to evaluate the following null hypothesis: there are no dif- ferences in morphology of the TMJ structures in relation
to vertical and sagittal cephalometric patterns.
MATERIALS AND METHODS
Participants
This retrospective study included 131 participants with no TMJ symptoms (48 men and 83 women; mean age, 23.5 years; range, 18.0–39.6 years) selected from 449 patients who had visited Yonsei University Dental Hospital between January 2012 and June 2016 and had undergone both lateral cephalography and CBCT includ- ing the TMJ structure. The participants had undergone CBCT for the following reasons: orthodontic diagnosis for orthognathic surgery; presence of impacted teeth;
and evaluation of the available amount of alveolar bone for orthodontic tooth movement. The inclusion criteria were absence of signs and symptoms of TMD based on research diagnostic criteria for TMD; availability of lateral cephalography and CBCT images; and age over 18 years. The exclusion criteria were a history of orth- odontic or orthognathic treatment; craniofacial skeletal deformity; and facial asymmetry with more than 4 mm of menton deviation.
21Using cephalometric analysis, the participants were classified on the basis of their vertical and sagittal skel- etal relationships. The sella-nasion to mandibular plane (SN-MP) angle was used to divide the participants into hypodivergent (SN-MP < 30 °), normodivergent (30°
< SN-MP < 38 °), and hyperdivergent (SN-MP > 38°) groups,
22while the A point-nasion-B point (ANB) angle was used to divide them into Class I (1 ° < ANB < 4°), Class II (ANB > 4 °), and Class III (ANB < 1°) groups.
19,23Thus, the participants were eventually divided into nine subgroups (Table 1). On the basis of a previous study,
12we estimated that 12 participants per group were suf- ficient to detect differences in TMJ morphology among the three different groups. This study was approved by Yonsei University Dental Hospital Institutional Review Board (No. 2-2016-0001). Because of the retrospec- tive nature of this study, the institutional review board waived the requirement for written informed patient consent.
Measurements
Three-dimensional images were acquired with a CBCT device (Alphard VEGA; ASAHI Roentgen IND, Kyoto, Japan) set at 5.0–8.0 mA and 80 kV, and images were captured for 17 seconds with a 0.30-mm voxel size.
The field of view was 154 × 154 mm
2. The images were
transformed to the Digital Imaging and Communications
in Medicine format, reconstructed, and analyzed with
OnDemand software (Cybermed Inc., Seoul, Korea). The
CBCT images were reoriented with the Frankfort hori-
zontal (FH) plane parallel to the ground. Subsequently,
the midsagittal reference plane, which was perpendicular to the FH plane and passed through the nasion, was au- tomatically set.
This study was designed to analyze condylar volume, condylar size (width, length, and height), fossa size (length and height), and condyle-to-fossa joint spaces
at the anterior, superior, and posterior condylar poles (Figure 1). For measurements, we identified 10 anatomi- cal landmarks (Cd-med, Cd-lat, Cd-sup, Cd-ant, Cd- post, Sig-inf, Sig-post, Fs-sup, At-inf, and Am-inf), as defined in Table 2. The condylar volume was defined as the mandibular condyle bound inferiorly by a plane that Table 1. Demographic features of the participants
Group Hypodivergent
(n = 37) Normodivergent
(n = 47) Hyperdivergent
(n = 47) p-value
†Age (yr) Class I (n = 43) 25.6 ± 5.2
(n = 11; M9, F2)
21.0 ± 3.3 (n = 16; M5, F11)
23.9 ± 4.7 (n = 16; M3, F13)
0.93
Class II (n = 42) 27.6 ± 8.3 (n = 11; M4, F7)
23.4 ± 5.9 (n = 15; M5, F10)
23.0 ± 6.0 (n = 16; M4, F12)
0.08
Class III (n = 46) 20.9 ± 3.9 (n = 15; M8, F7)
24.3 ± 5.1 (n = 16; M4, F12)
20.8 ± 2.7 (n = 15; M6, F9)
0.08
p-value* 0.17 0.68 0.40
ANB (°) Class I 2.5 ± 0.8 2.9 ± 1.0 2.4 ± 0.9 0.44
Class II 5.7 ± 1.2 5.6 ± 1.0 6.8 ± 1.6 0.08
Class III −1.8 ± 3.3 −2.5 ± 2.8 −2.0 ± 1.4 0.79
p-value* 0.00* 0.00* 0.00*
SN-MP (°) Class I 26.1 ± 7.1 34.2 ± 2.2 43.7 ± 3.7 0.00
†Class II 25.4 ± 2.4 35.3 ± 2.0 44.5 ± 3.4 0.00
†Class III 26.7 ± 2.2 34.3 ± 2.2 42.1 ± 2.6 0.00
†p-value* 0.87 0.33 0.16
Values are presented as mean ± standard deviation.
ANB, A point-nasion-B point angle; SN-MP, sella-nasion to mandibular plane angle; M, male; F, female.
*p-value indicates the analysis of variance (ANOVA) results for comparisons among the three sagittal (Class I, Class II, and Class III) groups, while
†p-value indicates the ANOVA results for comparisons among three vertical (hypodivergent, normodivergent, and hyperdivergent) groups.
*p < 0.05;
†p < 0.05.
Figure 1. Measurements for the temporomandibular joint structure. Condylar volume was measured from a three-di-
mensional reconstructed image; condylar width was measured on the coronal section; and other measurements, includ-
ing condylar length and height, fossa length and height, and superior, anterior, and posterior joint spaces, were measured
on the same sagittal section. Please refer to Tables 2 and 3 for definitions of the abbreviations and measurements.
passes through the Sig-inf point and is parallel to the FH plane
24(Table 3). From serial coronal sections, we selected one section that included the most medial and lateral points (Cd-med and Cd-lat, respectively) and con- sequently showed the widest distance of the condyle. On this coronal section, condylar width, which was the dis- tance between Cd-med and Cd-lat, was measured. For selection of the sagittal section, we identified the most superior point of the condyle (Cd-sup) from serial axial images, and then confirmed the landmark on the sagit- tal section as the most superior point of the condyle.
8The sagittal section that contained Cd-sup was finally selected and used for measurement of condylar length and height,
24,25fossa length and height,
5and three (su- perior, anterior, and posterior) joint spaces
6(Figure 1 and Table 3). The measurements were performed on both sides, and the mean values were used.
Statistical analysis
One examiner performed all measurements. To evalu- ate intra-examiner reliability, the same examiner re-ana- lyzed 20 randomly selected participants within a 2-week Table 2. Definitions of the landmarks used in this study
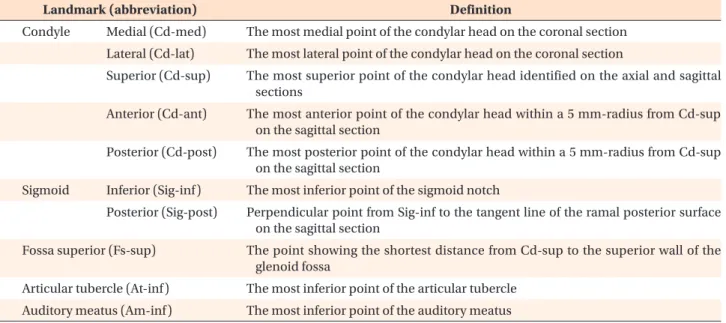
Landmark (abbreviation) Definition
Condyle Medial (Cd-med) The most medial point of the condylar head on the coronal section Lateral (Cd-lat) The most lateral point of the condylar head on the coronal section
Superior (Cd-sup) The most superior point of the condylar head identified on the axial and sagittal sections
Anterior (Cd-ant) The most anterior point of the condylar head within a 5 mm-radius from Cd-sup on the sagittal section
Posterior (Cd-post) The most posterior point of the condylar head within a 5 mm-radius from Cd-sup on the sagittal section
Sigmoid Inferior (Sig-inf) The most inferior point of the sigmoid notch
Posterior (Sig-post) Perpendicular point from Sig-inf to the tangent line of the ramal posterior surface on the sagittal section
Fossa superior (Fs-sup) The point showing the shortest distance from Cd-sup to the superior wall of the glenoid fossa
Articular tubercle (At-inf) The most inferior point of the articular tubercle Auditory meatus (Am-inf) The most inferior point of the auditory meatus
Table 3. Definitions of the measurements performed in this study
Measurement Definition
Condyle Volume* Volume of the mandibular condyle bound inferiorly by a parallel plane to the FH plane and passing through Sig-inf
Width
†Distance between Cd-med and Cd-lat Length Distance between Cd-ant and Cd-post
Height Perpendicular distance from Cd-sup to the line between Sig-inf and Sig-post
Fossa Length Distance from At-inf to a point where the line connecting At-inf and Am-inf meets the posterior wall of the glenoid fossa in the selected sagittal section
Height Perpendicular distance from Fs-sup to the line connecting At-inf and Am-inf in the selected sagittal section
Joint space Superior Distance from Cd-sup to Fs-sup
Anterior The shortest distance from Cd-ant to the corresponding glenoid fossa Posterior The shortest distance from Cd-post to the corresponding glenoid fossa All measurements were performed by using OnDemand software (Cybermed Inc., Seoul, Korea).
*Condylar volume was measured by separating the condylar structure from the mandible.
†
Condylar width was measured on the coronal section Other parameters were measured on the sagittal section.
See Table 2 for definitions of each landmark.
interval. Intraclass correlation coefficients of 0.995 were achieved, which confirmed acceptable reproducibility of the measurements.
Normal distribution of the data was confirmed by the Kolmogorov-Smirnov test. One-way analysis of vari- ance (ANOVA) and Scheffe post-hoc test were used to compare Class I, II, and III groups according to the sag- ittal skeletal patterns. The same tests were performed to compare hypodivergent, normodivergent, and hyper- divergent groups according to the vertical skeletal pat- terns. The nine subgroups were compared by two-way ANOVA and Bonferroni post-hoc test to evaluate the interactions between the sagittal and vertical cephalo- metric patterns. All measurements were analyzed by us- ing IBM SPSS Statistics software (ver. 23.0; IBM Corp.,
Armonk, NY, USA).
RESULTS
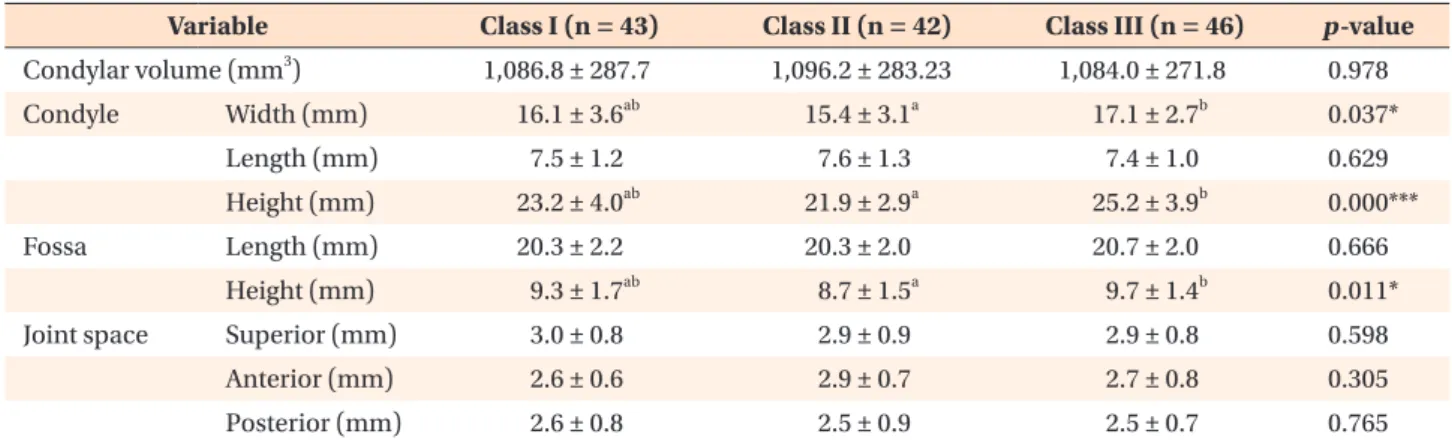
The three sagittal groups showed significant differenc- es in condylar width, condylar height, and fossa height:
the Class III group showed larger values of condylar width, condylar height, and fossa height than the Class II group (p < 0.05; Table 4). In contrast, condylar vol- ume, condylar width, fossa height and length, and su- perior joint space showed significant differences among the three vertical groups (p < 0.01; Table 5): condylar volume and superior joint space in the hyperdivergent group were significantly smaller than those in the other two vertical groups (p < 0.001), whereas fossa length
Table 4. Comparison of dimensions of temporomandibular joint structure according to sagittal skeletal patterns Variable Class I (n = 43) Class II (n = 42) Class III (n = 46) p-value Condylar volume (mm
3) 1,086.8 ± 287.7 1,096.2 ± 283.23 1,084.0 ± 271.8 0.978
Condyle Width (mm) 16.1 ± 3.6
ab15.4 ± 3.1
a17.1 ± 2.7
b0.037*
Length (mm) 7.5 ± 1.2 7.6 ± 1.3 7.4 ± 1.0 0.629
Height (mm) 23.2 ± 4.0
ab21.9 ± 2.9
a25.2 ± 3.9
b0.000***
Fossa Length (mm) 20.3 ± 2.2 20.3 ± 2.0 20.7 ± 2.0 0.666
Height (mm) 9.3 ± 1.7
ab8.7 ± 1.5
a9.7 ± 1.4
b0.011*
Joint space Superior (mm) 3.0 ± 0.8 2.9 ± 0.9 2.9 ± 0.8 0.598
Anterior (mm) 2.6 ± 0.6 2.9 ± 0.7 2.7 ± 0.8 0.305
Posterior (mm) 2.6 ± 0.8 2.5 ± 0.9 2.5 ± 0.7 0.765
Values are presented as mean ± standard deviation.
p-value indicates one-way analysis of variance results for comparisons among the three sagittal groups. The same letters indicate that there were no statistically significant differences.
*p < 0.05; ***p < 0.001.
Table 5. Comparison of dimensions of temporomandibular joint structure according to vertical skeletal patterns
Variable Hypodivergent
(n = 37) Normodivergent
(n = 47) Hyperdivergent
(n = 47) p-value
Condylar volume (mm
3) 1152.4 ± 275.1
a1191.3 ± 279.2
a936.4 ± 211.7
b0.000***
Condyle Width (mm) 17.6 ± 3.0
a16.1 ± 2.8
ab15.2 ± 3.5
b0.003**
Length (mm) 7.6 ± 1.2 7.7 ± 1.2 7.2 ± 1.1 0.104
Height (mm) 23.1 ± 3.3 24.2 ± 4.1 23.1 ± 4.0 0.292
Fossa Length (mm) 20.1 ± 2.1
a20.0 ± 1.7
a21.2 ± 2.1
b0.007**
Height (mm) 8.5 ± 1.2
a9.0 ± 1.6
a10.1 ± 1.5
b0.000***
Joint space Superior (mm) 3.3 ± 0.8
a3.0 ± 0.9
a2.6 ± 0.7
b0.000***
Anterior (mm) 2.7 ± 0.6 2.7 ± 0.7 2.8 ± 0.8 0.861
Posterior (mm) 2.4 ± 0.7 2.7 ± 0.9 2.5 ± 0.8 0.280
Values are presented as mean ± standard deviation.
p-value indicates one-way analysis of variance results for comparisons among the three vertical groups. The same letters indicate that there were no statistically significant differences.
**p < 0.01; ***p < 0.001.
and height were significantly higher in the hyperdiver- gent group than in the other groups (p < 0.01). With respect to the condylar width, the hypodivergent group showed a wider condylar head than the hyperdivergent group (p < 0.01).
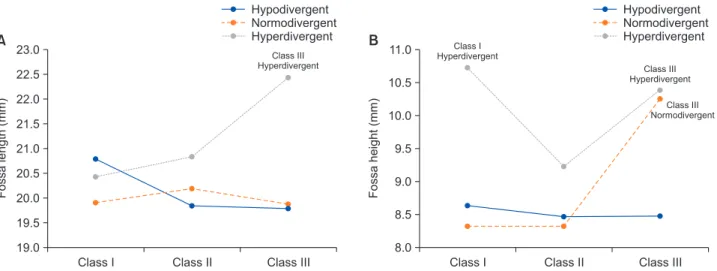
Two-way ANOVA tests among the nine subgroups showed no statistically significant interactions between the sagittal and vertical cephalometric patterns for the condylar parameters and joint spaces (p > 0.05). How- ever, statistically significant interactions were observed between the sagittal and vertical cephalometric patterns for fossa length and height (p < 0.05; Table 6 and Fig- ure 2): for fossa length, the Class III-hyperdivergent sub- group showed a higher value than the other subgroups, and for fossa height, the Class I-hyperdivergent, Class III-hyperdivergent, and Class III-normodivergent sub- groups showed higher values than the other subgroups.
DISCUSSION
This study aimed to compare the morphology of TMJ structures and the spatial relationships between the condyle and fossa in relation to vertical and sagittal cephalometric patterns, and the findings suggested that the Class III group showed higher values for condylar width, condylar height, and fossa height than the Class II group. Condylar volume, condylar width, and superior joint space in the hyperdivergent group were significant- ly smaller than those in the hypodivergent group, while fossa length and height were significantly larger in the hyperdivergent group than the hypodivergent group. In addition, there were statistically significant interactions between the vertical and sagittal cephalometric patterns in fossa length and height. Therefore, the null hypoth- esis of this study was rejected.
Figure 2. Interaction between vertical and sagittal skeletal patterns and fossa length (A) and height (B).
Fossalength(mm)
Class I 23.0
22.5 22.0 21.5 21.0 20.5 20.0 19.5 19.0
Class II Class III Hypodivergent Normodivergent Hyperdivergent
Class III Hyperdivergent
Fossaheight(mm)
Class I 11.0
10.5
10.0
9.5
9.0
8.5
8.0
Class II Class III Hypodivergent Normodivergent Hyperdivergent
Class III Normodivergent Class III Hyperdivergent Class I
Hyperdivergent