Evaluation of the Chondromalacia Patella Using a Microscopy Coil: Comparison of the Two-Dimensional Fast Spin Echo Techniques and the Three-Dimensional Fast Field Echo Techniques
Hyun-joo Kim, MD
1, Sang Hoon Lee, MD
1, Chang Ho Kang, MD
1, Jeong Ah Ryu, MD
1, Myung Jin Shin, MD
1, Kyung-Ja Cho, MD
2, Woo Shin Cho, MD
31Department of Radiology and the Research Institute of Radiology, Departments of 2Pathology and 3Orthopedic Surgery, University of Ulsan College of Medicine, Asan Medical Center, Seoul 138-736, Korea
Objective: We wanted to compare the two-dimensional (2D) fast spin echo (FSE) techniques and the three-dimensional (3D) fast fi eld echo techniques for the evaluation of the chondromalacia patella using a microscopy coil.
Materials and Methods: Twenty five patients who underwent total knee arthroplasty were included in this study.
Preoperative MRI evaluation of the patella was performed using a microscopy coil (47 mm). The proton density-weighted fast spin echo images (PD), the fat-suppressed PD images (FS-PD), the intermediate weighted-fat suppressed fast spin echo images (iw-FS-FSE), the 3D balanced-fast fi eld echo images (B-FFE), the 3D water selective cartilage scan (WATS-c) and the 3D water selective fl uid scan (WATS-f) were obtained on a 1.5T MRI scanner. The patellar cartilage was evaluated in nine areas: the superior, middle and the inferior portions that were subdivided into the medial, central and lateral facets in a total of 215 areas. Employing the Noyes grading system, the MRI grade 0-I, II and III lesions were compared using the gross and microscopic fi ndings. The sensitivity, specifi city and accuracy were evaluated for each sequence. The signifi cance of the differences for the individual sequences was calculated using the McNemar test.
Results: The gross and microscopic findings demonstrated 167 grade 0-I lesions, 40 grade II lesions and eight grade III lesions. Iw-FS-FSE had the highest accuracy (sensitivity/specificity/accuracy = 88%/98%/96%), followed by FS- PD (78%/98%/93%, respectively), PD (76%/98%/93%, respectively), B-FFE (71%/100%/93%, respectively), WATS-c (67%/100%/92%, respectively) and WATS-f (58%/99%/89%, respectively). There were statistically signifi cant differences for the iw-FS-FSE and WATS-f and for the PD-FS and WATS-f (p < 0.01).
Conclusion: The iw-FS-FSE images obtained with a microscopy coil show best diagnostic performance among the 2D and 3D GRE images for evaluating the chondromalacia patella.
Index terms: Cartilage; Magnetic resonance (MR); Knee; Histopathologic correlation
Received May 20, 2010; accepted after revision October 25, 2010.
This study was supported by a grant from the Asan Institute for Life Sciences (2004-355), and the Korea Health 21 R & D Project, Ministry of Health & Welfare, Republic of Korea (A062254).
Corresponding author: Sang Hoon Lee, MD, Department of Radiology and the Research Institute of Radiology, University of Ulsan College of Medicine, Asan Medical Center, 86 Asanbyeongwon-gil, Songpa-gu, Seoul 138-736, Korea.
• Tel: (822) 3010-3983 • Fax: (822) 476-4719
• E-mail: [email protected]
This is an Open Access article distributed under the terms of the Creative Commons Attribution Non-Commercial License (http://creativecommons.org/licenses/by-nc/3.0) which permits unrestricted non-commercial use, distribution, and reproduction in any medium, provided the original work is properly cited.
pISSN 1229-6929 · eISSN 2005-8330 Korean J Radiol 2011;12(1):78-88
INTRODUCTION
Although arthroscopy is considered to be the gold standard for making the diagnosis of chondromalacia, MRI is a non-invasive method for diagnosing chondral lesions and it is easily performed. The increased strength of the magnets and the specialized coil allow an increase in both the sensitivity and specifi city of diagnosing chondromalacia.
MRI has become an important tool for evaluating articular cartilages and chondral lesions.
The two-dimensional (2D) sequences, such as the proton-
density weighted (PD) images and the intermediate-
In one study, the 2 x 2 channel carotid coil showed slightly better results than the conventional coil for grading chondromalacia (8). The microscopy coil (diameter: 47 mm) has recently been used in many clinical fi elds, and this coil is adequate to cover the entire patellar cartilage (10, 11). Through the development of surface coils and MRI equipment, it is possible to acquire thinner slices on the 2D images of chondromalacia, although further evaluation is required.
The purpose of this study is to compare the diagnostic performance of the 2D FSE techniques and the 3D fast fi eld echo techniques for the evaluation of the chondromalacia patella using a microscopy coil.
MATERIALS AND METHODS
Patients
The study protocol was approved by our Institutional Review Board. Informed consent was obtained from all patients before MRI acquisition.
Those patients who underwent total knee arthroplasty due to severe degenerative osteoarthritis during a fi ve- month period were prospectively included in this study.
The patients who had relatively mild osteoarthritis in the patellofemoral compartment were selected because selection of many grade 0-II chondromalacia cases is needed for the evaluation of a broad spectrum of chondromalacia. The MRI examinations were performed before surgery and then arthroplasty was done 1-2 days after the MRI examination.
weighted fast spin-echo (iw-FSE) images with or without fat-saturation (FS), are frequently used for MR imaging of the knee. The gradient-echo (GRE) sequence, such as the fat-suppressed spoiled gradient echo (FS-SPGR) images and the fat-suppressed fast low angle shot (FS-FLASH) images, is one of the most frequently used sequences (1). The three- dimensional (3D) T1-fast fi eld echo with water excitation for cartilage (WATS-c) scan and the 3D water selective fl uid scan (WATS-f) are sequences that use water excitation for fat suppression and they are similar to the water excitation 3D FLASH scan (2, 3). Although other sequences, such as driven equilibrium Fourier transform (DEFT) sequence (4) the balanced steady-state free precession (B-SSFP) sequence (5) and the 3D dual-echo steady-state sequence (3D-DESS) (6) have also demonstrated successful results for detecting chondral lesions, these are not widely used in most clinical settings. The reported sensitivities and specifi cities of 3D sequences were variable for the evaluation of chondromalacia in different study settings (1-6).
Fat suppressed PD MR imaging has shown good performance for detecting articular cartilage lesions (7, 8), but the 3D sequences showed better results than the 2D sequences (8), and the 3D images can acquire thinner slices than the 2D images. The iw-FS-FSE showed the best sensitivity for detecting chondromalacia compared with that of FS-SPGR and B-SSFP (9). So comparison of 2D images such as the PD, FS-PD, iw-FS-FSE and 3D images is needed to assess their diagnostic performance.
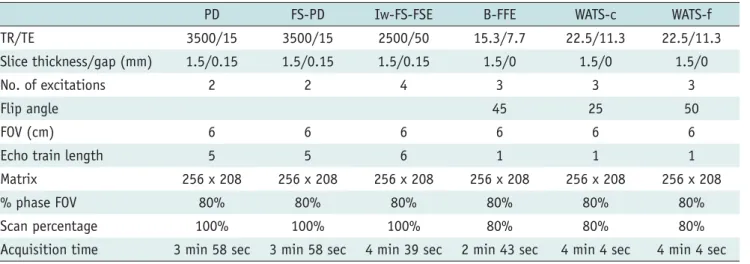
Table 1. The Pulse Sequences used in this Study
PD FS-PD Iw-FS-FSE B-FFE WATS-c WATS-f
TR/TE 3500/15 3500/15 2500/50 15.3/7.7 22.5/11.3 22.5/11.3
Slice thickness/gap (mm) 1.5/0.15 1.5/0.15 1.5/0.15 1.5/0 1.5/0 1.5/0
No. of excitations 2 2 4 3 3 3
Flip angle 45 25 50
FOV (cm) 6 6 6 6 6 6
Echo train length 5 5 6 1 1 1
Matrix 256 x 208 256 x 208 256 x 208 256 x 208 256 x 208 256 x 208
% phase FOV 80% 80% 80% 80% 80% 80%
Scan percentage 100% 100% 100% 80% 80% 80%
Acquisition time 3 min 58 sec 3 min 58 sec 4 min 39 sec 2 min 43 sec 4 min 4 sec 4 min 4 sec Note.— Measured voxel size/reconstructed voxel size = 1.5 x 0.23 x 0.29/1.5 x 0.23 x 0.23 mm
3. B-FFE = balanced-fast fi eld echo image, FOV = fi eld of view, FS-PD = fat-suppressed proton density-weighted image, Iw-FS-FSE = intermediate weighted-fat suppressed fast spin echo image, PD = proton density-weighted fast spin echo image, TE = echo time, TR = repetition time, WATS-c
= water selective cartilage scan, WATS-f = water selective fl uid scan
MRI Examination
Preoperative MRI evaluation of the patella using a microscopy coil (47 mm, Philips Medical Systems) on a clinical 1.5T MRI scanner was performed (Intera; Philips Medical Systems; Best, The Netherlands) with the patient in the supine position. The axial MR images were obtained on the proton density-weighted fast spin echo imaging (PD), the FS-proton density-weighted fast spin echo imaging (FS-PD), the FS-T2 weighted fast spin echo imaging with intermediate T2 weighting (iw-FS-FSE), the 3D balanced-fast fi eld echo imaging (B-FFE), the 3D T1 fast fi eld echo with water excitation for cartilage imaging (WATS-c), and the 3D fast fi eld echo with water excitation for fl uid imaging (WATS-f) sequences. The imaging protocols are all shown in Table 1. The WATS-c sequence is a T1 enhanced FFE volume scan with ProSet (Principle of selective excitation technique). The WATS-f sequence is the non-spoiled FFE with ProSet, and the WATS-c and WATS-f use water selective 1-3-3-1 binominal pulse for optimal fat suppression (12).
The low high technique of the k-space profi le order in the PD and FSE sequences was used. The CLEAR (Constant Level Appearance) technique for homogeneity correction in image reconstruction was used.
Evaluation of MR Images
After completion of the data acquisition in all the patients, the MR images were evaluated separately and independently by two radiologists with 10 and two years, respectively, of clinical experience in musculoskeletal MR imaging. The readers were blinded with regard to the pathology data. The interval between each evaluation was six weeks.
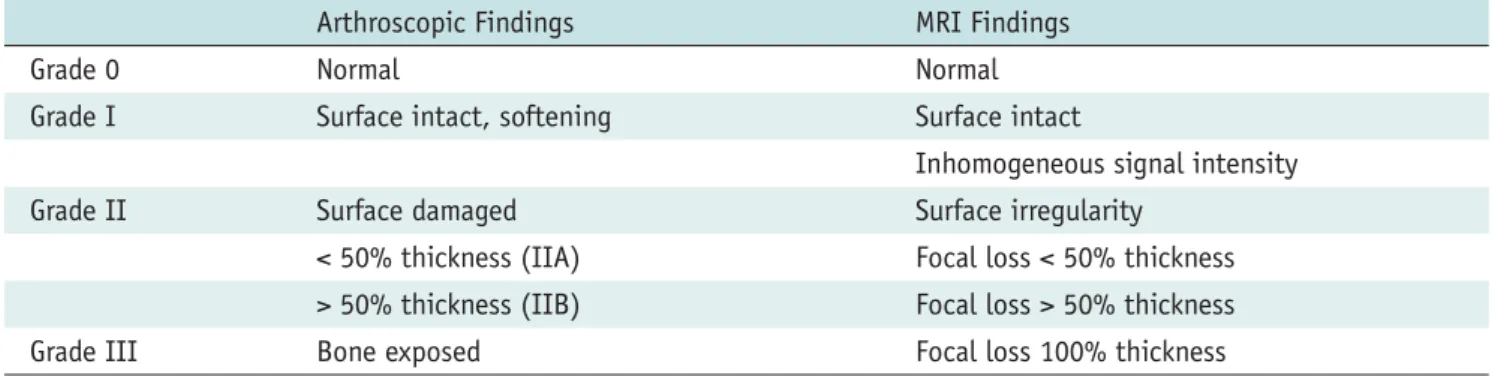
The grading of the cartilage lesions was performed in correspondence with the surgical grading, with minor adaptations required according to the MRI appearance of the abnormalities and following the grading schema
of Recht et al. (13) (Table 2): grade 0: normal cartilage (homogeneous signal intensity, intact cartilage surface and thickness), grade I: abnormal signal intensity (focal alteration of the cartilage signal intensity) but a normal surface, grade IIA: superfi cial fraying, erosion or ulceration with a depth of not more than 50% of the cartilage thickness, grade IIB: a defect of more than 50%, but less than 100% of the cartilage thickness, and grade III: full- thickness cartilage damage.
The patella cartilage was evaluated in nine areas (Fig. 1), i.e., the superior, middle and inferior portions subdivided by the medial, central and lateral facets. The highest grade of each segment was recorded on the MRI and pathology.
Arthroplasty was then performed one to two days after the MRI examination.
Patella cutting was done from the medial to lateral edge.
After cutting, all the patella specimens were photographed (Fig. 2). Transverse patella cutting was done for the histological grading. Each three sections were obtained at the superior, middle and inferior portions. Hematoxylin
Table 2. Grading of Cartilage according to MRI Appearance of Abnormalities and by Grading Schema of Recht et al. (13)
Arthroscopic Findings MRI Findings
Grade 0 Normal Normal
Grade I Surface intact, softening Surface intact
Inhomogeneous signal intensity
Grade II Surface damaged Surface irregularity
< 50% thickness (IIA) Focal loss < 50% thickness
> 50% thickness (IIB) Focal loss > 50% thickness
Grade III Bone exposed Focal loss 100% thickness
Fig. 1. Division of nine areas of patella.
& Eosin staining was done after decalcifi cation. The macroscopic fi ndings using the specimens’ photographs and histology were closely evaluated and graded using the same grading system as that for MRI.
Using the Noyes grading system, the MRI grade 0-I, II and III lesions were compared using the gross and microscopic fi ndings as the gold standard. Grades 0 and I were regarded as the same grade. If the chondromalacia was
undergraded on the MRI examination, then it was regarded as a false negative. If the chondromalacia was overgraded on the MRI examination, then it was regarded as a false positive.
Statistical Analysis
The sensitivity, specifi city and accuracy for the detection of cartilage lesions were calculated for each sequence and
Fig. 2. Cutting articular surface of patella (schematic diagram, left) and example of gross pictures of cutting patella (right).
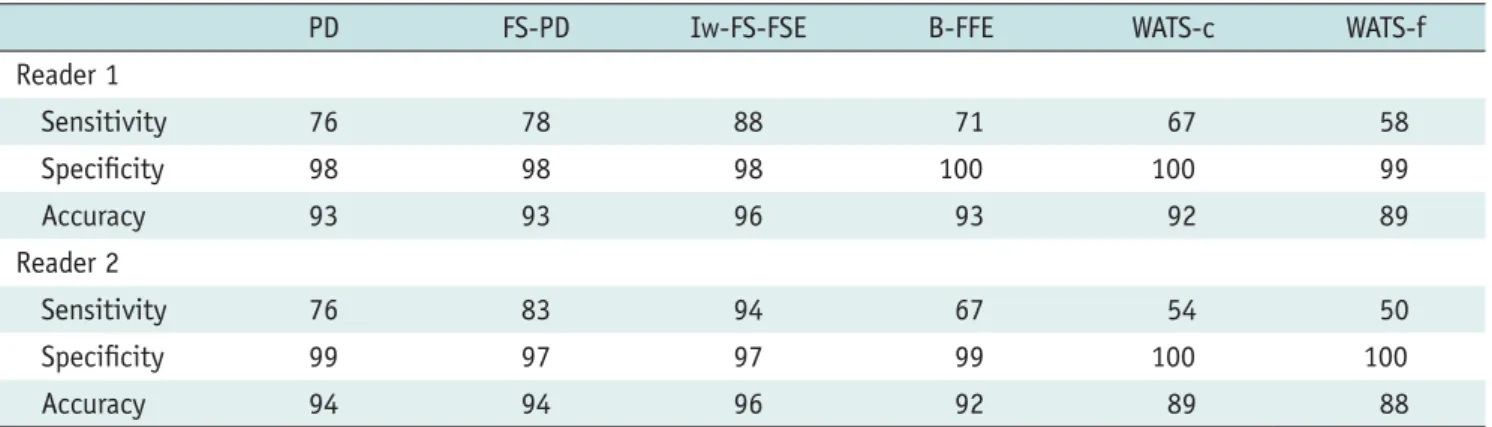
Table 3. Individual Reviewer Performance for MR Images (Sensitivity, Specifi city and Accuracy)
PD FS-PD Iw-FS-FSE B-FFE WATS-c WATS-f
Reader 1
Sensitivity 76 78 88 71 67 58
Specifi city 98 98 98 100 100 99
Accuracy 93 93 96 93 92 89
Reader 2
Sensitivity 76 83 94 67 54 50
Specifi city 99 97 97 99 100 100
Accuracy 94 94 96 92 89 88
Note.— Data are percentages. B-FFE = balanced-fast fi eld echo image, FS-PD = fat-suppressed proton density-weighted image, Iw- FS-FSE = intermediate weighted-fat suppressed fast spin echo image, PD = proton density-weighted fast spin echo image, WATS-c
= water selective cartilage scan, WATS-f = water selective fl uid scan
Table 4. Inter- and Intraobserver Agreement ( k-values) for Each Sequence
PD FS-PD Iw-FS-FSE B-FFE WATS-c WATS-f
Interobserver agreement 0.839 0.863 0.908 0.857 0.764 0.721
Reader 1 0.885 0.898 0.909 0.844 0.867 0.815
Reader 2 0.817 0.853 0.853 0.751 0.648 0.752
Note.— B-FFE = balanced-fast fi eld echo image, FS-PD = fat-suppressed proton density-weighted image, Iw-FS-FSE = intermediate
weighted-fat suppressed fast spin echo image, PD = proton density-weighted fast spin echo image, WATS-c = water selective
cartilage scan, WATS-f = water selective fl uid scan
for both readers. Differences in the results were evaluated using the McNemar test (SPSS software, version 14.0, 2006; SPSS. Chicago, IL). A p value of less than 0.05 was considered to indicate a statistically signifi cant difference.
The inter-observer and intra-observer agreements were determined with k statistics.
RESULTS
A total of 25 patients (M:F = 2:23, mean age: 65.44 years, range: 56-75 years) were included in this study. Ten lesions of three patients were excluded as they had inadequate pathology specimens of the patella.
There were 167 grade 0 or I lesions, 40 grade II lesions and eight grade III lesions. Iw-FS-FSE showed highest sensitivity and accuracy among the sequences. For reader 1, the sensitivity varied from 58% (WATS-f) to 88% (iw-FS-
FSE), the specifi city varied from 98% (FS-PD) to 100% (B-FFE and WATS-c) and the accuracy varied from 89% (WATS-f) to 96% (iw-FS-FSE). For reader 2, the sensitivity varied from 50% (WATS-f) to 94% (iw-FS-FSE), the specifi city varied from 97% (FS-PD and iw-FS-FSE) to 100% (WATS-c and WATS-f) and the accuracy varied from 88% (WATS-f) to 96%
(iw-FS-FSE) (Table 3). We provide examples of each type of cartilage lesion in Figures 3 to 6.
The interobserver k values for the different sequences were between almost perfect (k = 0.91 for iw-FS-FSE) and substantial (k = 0.72 for WATS-f). The overall intraobserver agreement was almost perfect (k = 0.87) for reader 1 and substantial (k = 0.78) for reader 2. The intraobserver k values for each sequence were between almost perfect (k = 0.91 for the iw-FS-FSE for reader 1) and substantial (k = 0.65 for the WATS-c for reader 2). All the inter- and intraobserver k values were statistically signifi cant (p < 0.01) (Table 4).
B C
A
E F
D
Fig. 3. 55-year-old woman with knee pain.
Proton density-weighted (A), fat-suppressed proton density-weighted (B), intermediate weighted-fat suppressed fast spin echo (C), 3D water selective cartilage scan (D), 3D water selective fl uid scan (E) and 3D balanced-fast fi eld echo (F) images show no evidence of chondromalacia in patella except for osteophyte at medial end.
The WATS-f sequence showed signifi cantly lower sensitivity, specifi city and accuracy than those of the iw- FS-FSE and FS-PD sequences (p < 0.01). Otherwise, no sequence was clearly superior to any other sequence. Even without statistically signifi cant results between the iw-FS- FSE and the other sequences, the iw-FS-FSE showed highest accuracy of any of the sequences.
DISCUSSION
The PD sequence could be used to evaluate the knee cartilage with accuracy comparable to that of the previously reported cartilage-specifi c sequences (14). Furthermore, fat suppression in the cartilage evaluation was important because of the increased dynamic range and fi ndings of
B C
A
E F
D
G
Fig. 4. 72-year-old woman with knee pain.
Proton density-weighted (A), fat-suppressed proton density-weighted (B), intermediate weighted-fat suppressed fast spin echo (C), 3D water selective cartilage scan (D), 3D water selective fl uid scan (E) and 3D balanced-fast fi eld echo (F) images show blister formation at lateral patellar cartilage and grade I change on all sequences (arrows). Histology (G, x 40) shows blister formation at base of patellar cartilage (arrows), intact surface, hypercellularity and extensive matrix formation at superior portion of blister (arrowheads).
underlying bone changes (15). The FS-PD sequence was highly sensitive for chondromalacia and it allowed the possibility of replacing the 3D SPGR and short tau inversion recovery (STIR) images for evaluating chondromalacia (15).
Yoshioka et al. (16) reported that FS-PD showed a higher signal to noise (SNR) of articular cartilage, and it showed a lower contrast to noise ratio (CNR) between cartilage and fl uid than did the iw-FS-FSE, but the FS-PD and iw-FS- FSE images were reported to have the same sensitivity and specifi city (16). However, the iw-FS-FSE images showed the best accuracy in our results. Yoshioka et al. (16) used
a 39 ms echo time for iw-FS-FSE, and we selected a longer echo time (50 ms) for the iw-FS-FSE and a thinner slice thickness and we used a microscopy coil, which probably made our results different from the results of Yoshioka et al.
Many institutions tend to use iw-FS-FSE (echo time: 33-60 ms) rather than the PD sequences, and the former provides higher intrinsic contrast and less magic angle effects (17).
We use iw-FS-FSE as the fi rst choice sequence for the evaluation of a chondromalacia patella.
One of the most commonly used techniques for assessing cartilage lesions was FS-SPGR, and the FS-SPGR images
B C
A
E F
D
G
Fig. 5. 66-year-old woman with knee pain.
Proton density-weighted (A), fat-suppressed proton density-weighted (B), intermediate weighted-fat suppressed fast spin echo (C), 3D water selective cartilage scan (D), 3D water selective fl uid scan (E) and 3D balanced-fast fi eld echo (F) images show focal breakage in cartilage surface of medial patellar facet on fast spin echo sequence images (A-C, arrows), but this is not defi nite on gradient echo images (D-F). Gross microscopic image (G) shows disruption of articular surface to depth less than 50% (arrow), and this grade IIA.
provided thin slices and high spatial resolution in several studies (18, 19). WATS pulses have been developed as an alternative technique to suppress fat signals (12). WATS pulses suppress the fat signal better than presaturation techniques due to the lesser sensitivity to magnetic fi eld inhomogeneity (20). Compared with FS-SPGR, WATS pulses reduced the scan time (12). FS-FLASH (i.e., FS-SPGR) showed no signifi cant difference of the SNR and CNR and the chondromalacia grading with water excitation FLASH (i.e., WATS-c) (2). So, the WATS GRE images could actually replace the fat-suppressed GRE images. According to recent studies,
FS-SPGR and water excitation FLASH (i.e., WATS-c) showed a lower sensitivity and specifi city for cartilage pathology than did FS-FSE (9, 16, 21). The high signal of the WATS-c images often hides the internal cartilage abnormality, and the low contrast between cartilage and synovial fl uid made it diffi cult to detect fi ssures or cartilage fi brillation (17, 22, 23). Therefore, the clinical usefulness of WATS-c or FS-SPGR images for the diagnosis of chondromalacia is still limited.
Balanced FFE is synonymous with true fast imaging with steady-state precession (true FISP) or B-SSFP and with fast imaging with a steady state acquisition (FIESTA) sequence
B C
A
E F
D
G
Fig. 6. 64-year-old woman with knee pain.
Proton density-weighted (A), fat-suppressed proton density-weighted (B), intermediate weighted-fat suppressed fast spin echo (C), 3D water selective cartilage scan (D), 3D water selective fl uid scan (E) and 3D balanced-fast fi eld echo (F) images show deep fi ssuring of articular cartilage of medial patellar facet, and exposed subchondral bone is seen on all sequences and gross microscopic image (G) (arrows), and this grade III.
(24). It produces a very high signal for tissue with a high T2/T1 ratio independent of the absolute value of T1 and T2 and independent of the repetition time. It provides excellent fl uid-tissue contrast with a very short repetition time (TR). Refocused FS-SSFP sequences, i.e., the fat- suppressed B-FFE, showed a higher SNR and CNR than that of PD, SPGR and DEFT; B-FFE can also reduce the scan time (23). Therefore, B-FFE may be an option for the quick evaluation of cartilage and especially in uncooperative patients. However, B-FFE has limited soft-tissue contrast because of the low T2/T1 values (25), and in our experience, chondromalacia detection without seeing the interface of the cartilage and joint fl uid made it diffi cult to detect surface irregularity. Bauer et al. also reported that the diagnostic performance for chondromalacia was higher for iw-FS-FSE imaging than that with SSFP or SPGR imaging (9). These results indicate that the superior SNR of cartilage in B-FFE does not always correlate with a higher diagnostic performance for chondromalacia than that of FSE imaging.
Duc et al. (26) also indicated that the superior CNR of the 3D water-excitation true FISP sequences had no advantage for determining chondromalacia over that of the iw-FS- FSE sequence. The fact that the SSFP sequence had severe artifacts than the FSE or SPGR (27) sequences might be one of the factors for the decreased sensitivity for detecting chondromalacia among these sequences.
The early composition changes of cartilage can be detected on T2 mapping (28). As the T2 value of cartilage refl ects its collagen content, tissue anisotropy and its water content (29), FSE imaging can detect early chondromalacia according to the T2 contrast. The magnetization transfer effect is also one of the factors for cartilage contrast on the FSE imaging. In cases of cartilage degeneration, the decreased collagen content reduced the MT effect in cartilage, which therefore increased the cartilage signal on FSE imaging (30). In addition, the subchondral change in the cases of chondromalacia could be detected on the iw- FS-FSE sequence rather than on the 3D water excitation true FISP sequence (26). Schaefer et al. (8) reported that grade I cartilage lesions were underestimated on 3D sequences and that the intrasubstantial contrast between chondromalacia and intact cartilage was poor on the 3D sequence. Therefore, the iw-FS-FSE images can more easily detect the cartilage lesions.
Diagnosis of chondromalacia using MRI depends on spatial resolution. Compared with the classical volume coils, a surface coil has limits for evaluating deep structures and
this is usually limited by the radius (31). Gensanne et al.
(32) reported on the performance of four microscopy coils (23, 47, 60 and 90 mm) from different MRI manufacturers, and the Micro 47 coil showed highest SNR value at 20- 30 mm of tissue thickness. The patellar thickness with including the skin and subcutaneous area is 22.8 (range:
19-31 mm) prior to total knee arthroplasty (33). The patellar height of the normal knee is 43.95 mm (range:
35.6-46.3 mm) (34). So, it is suitable to use a 47 mm coil for the imaging of the chondromalacia patella. The increased SNR of the 47 mm microscopy coil enabled us to obtain high spatial resolution on musculoskeletal MR imaging and to use a small fi eld of view (FOV) and a thin slice thickness that overcome the weakness of 2D imaging.
A microscopy coil can also show smaller structures such as ligaments and cartilage (10). The advantages of high resolution MRI using a microscopy coil have been reported for both the wrist joint and the knee joint (11, 35).
This study has several limitations. First, our study patients had too many grade 0 or I lesions, which increased the specifi city and made almost perfect inter- observer and intra-observer agreement. Second, we used an MRI microscopy coil, which created a small FOV and a thin slice thickness that overcome the 2D weakness. However, as a microscopy coil is usually not used in standard clinical practice, the evaluation of chondromalacia in clinical practice is different from that seen in this study. Third, grades 0 & I chondromalacia were not divided and they were evaluated as the same grade in this study. Further, MRI study will be necessary in order to evaluate grade I chondromalacia. Fourth, the 3D GRE images are able to be acquired with thinner slices than that of the 2D FSE images with a similar SNR, which could increase the sensitivity and specifi city. However, as the same slice thickness was used in this study, the advantages of the 3D sequences were underestimated.
In conclusion, the iw-FS-FSE images obtained with a microscopy coil with the same voxel size showed the best diagnostic performance among the 2D and 3D GRE images for evaluating chondromalacia. The iw-FS-FSE images could be used as the main pulse sequence for arthritis imaging of not only soft tissue and bony abnormalities, but also for evaluating chondromalacia when using a dedicated coil.
Acknowledgement
We thank Kyeung Ro Lee (MR application specialist of
Philips Medical Systems) for his valuable assistance and
technical suggestions for this study.
REFERENCES
1. Disler DG, McCauley TR, Wirth CR, Fuchs MD. Detection of knee hyaline cartilage defects using fat-suppressed three- dimensional spoiled gradient-echo MR imaging: comparison with standard MR imaging and correlation with arthroscopy.
AJR Am J Roentgenol 1995;165:377-382
2. Mohr A, Priebe M, Taouli B, Grimm J, Heller M, Brossmann J. Selective water excitation for faster MR imaging of articular cartilage defects: initial clinical results. Eur Radiol 2003;13:686-689
3. Hauger O, Dumont E, Chateil JF, Moinard M, Diard F. Water excitation as an alternative to fat saturation in MR imaging:
preliminary results in musculoskeletal imaging. Radiology 2002;224:657-663
4. Gold GE, Fuller SE, Hargreaves BA, Stevens KJ, Beaulieu CF.
Driven equilibrium magnetic resonance imaging of articular cartilage: initial clinical experience. J Magn Reson Imaging 2005;21:476-481
5. Kornaat PR, Doornbos J, van der Molen AJ, Kloppenburg M, Nelissen RG, Hogendoorn PC, et al. Magnetic resonance imaging of knee cartilage using a water selective balanced steady-state free precession sequence. J Magn Reson Imaging 2004;20:850-856
6. Ruehm S, Zanetti M, Romero J, Hodler J. MRI of patellar articular cartilage: evaluation of an optimized gradient echo sequence (3D-DESS). J Magn Reson Imaging 1998;8:1246- 1251
7. Saadat E, Jobke B, Chu B, Lu Y, Cheng J, Li X, et al.
Diagnostic performance of in vivo 3-T MRI for articular cartilage abnormalities in human osteoarthritic knees using histology as standard of reference. Eur Radiol 2008;18:2292- 2302
8. Schaefer FK, Kurz B, Schaefer PJ, Fuerst M, Hedderich J, Graessner J, et al. Accuracy and precision in the detection of articular cartilage lesions using magnetic resonance imaging at 1.5 Tesla in an in vitro study with orthopedic and histopathologic correlation. Acta Radiol 2007;48:1131-1137 9. Bauer JS, Barr C, Henning TD, Malfair D, Ma CB, Steinbach L,
et al. Magnetic resonance imaging of the ankle at 3.0 Tesla and 1.5 Tesla in human cadaver specimens with artifi cially created lesions of cartilage and ligaments. Invest Radiol 2008;43:604-611
10. Iwama Y, Fujii M, Shibanuma H, Muratsu H, Kurosaka M, Kawamitsu H, et al. High-resolution MRI using a microscopy coil for the diagnosis of recurrent lateral patellar dislocation.
Radiat Med 2006;24:327-334
11. Yoshioka H, Tanaka T, Ueno T, Shindo M, Carrino JA, Lang P, et al. High-resolution MR imaging of the proximal zone of the lunotriquetral ligament with a microscopy coil. Skeletal Radiol 2006;35:288-294
12. Hardy PA, Recht MP, Piraino DW. Fat suppressed MRI of
articular cartilage with a spatial-spectral excitation pulse. J Magn Reson Imaging 1998;8:1279-1287
13. Recht MP, Piraino DW, Paletta GA, Schils JP, Belhobek GH. Accuracy of fat-suppressed three-dimensional spoiled gradient-echo FLASH MR imaging in the detection of patellofemoral articular cartilage abnormalities. Radiology 1996;198:209-212
14. Sonin AH, Pensy RA, Mulligan ME, Hatem S. Grading articular cartilage of the knee using fast spin-echo proton density- weighted MR imaging without fat suppression. AJR Am J Roentgenol 2002;179:1159-1166
15. Mohr A, Roemer FW, Genant HK, Liess C. Using fat-saturated proton density-weighted MR imaging to evaluate articular cartilage. AJR Am J Roentgenol 2003;181:280-281
16. Yoshioka H, Stevens K, Hargreaves BA, Steines D, Genovese M, Dillingham MF, et al. Magnetic resonance imaging of articular cartilage of the knee: comparison between fat-suppressed three-dimensional SPGR imaging, fat-suppressed FSE
imaging, and fat-suppressed three-dimensional DEFT imaging, and correlation with arthroscopy. J Magn Reson Imaging 2004;20:857-864
17. Link TM, Stahl R, Woertler K. Cartilage imaging: motivation, techniques, current and future signifi cance. Eur Radiol 2007;17:1135-1146
18. Disler DG. Fat-suppressed three-dimensional spoiled gradient- recalled MR imaging: assessment of articular and physeal hyaline cartilage. AJR Am J Roentgenol 1997;169:1117-1123 19. Peterfy CG, van Dijke CF, Janzen DL, Glüer CC, Namba R,
Majumdar S, et al. Quantifi cation of articular cartilage in the knee with pulsed saturation transfer subtraction and fat-suppressed MR imaging: optimization and validation.
Radiology 1994;192:485-491
20. Zur Y. Design of improved spectral-spatial pulses for routine clinical use. Magn Reson Med 2000;43:410-420
21. Mohr A. The value of water-excitation 3D FLASH and fat- saturated PDw TSE MR imaging for detecting and grading articular cartilage lesions of the knee. Skeletal Radiol 2003;32:396-402
22. Yoshioka H, Stevens K, Genovese M, Dillingham MF, Lang P.
Articular cartilage of knee: normal patterns at MR imaging that mimic disease in healthy subjects and patients with osteoarthritis. Radiology 2004;231:31-38
23. Hargreaves BA, Gold GE, Beaulieu CF, Vasanawala SS, Nishimura DG, Pauly JM. Comparison of new sequences for high-resolution cartilage imaging. Magn Reson Med 2003;49:700-709
24. Scheffl er K. Fast frequency mapping with balanced SSFP:
theory and application to proton-resonance frequency shift thermometry. Magn Reson Med 2004;51:1205-1211
25. Vlaardingerbroek MT, den Boer JA. Magnetic resonance imaging: theory and practice, 3rd ed. New York: Springer, 2003 26. Duc SR, Pfi rrmann CW, Schmid MR, Zanetti M, Koch PP,
Kalberer F, et al. Articular cartilage defects detected with 3D water-excitation true FISP: prospective comparison with sequences commonly used for knee imaging. Radiology
2007;245:216-223
27. Barr C, Bauer JS, Malfair D, Ma B, Henning TD, Steinbach L, et al. MR imaging of the ankle at 3 Tesla and 1.5 Tesla:
protocol optimization and application to cartilage, ligament and tendon pathology in cadaver specimens. Eur Radiol 2007;17:1518-1528
28. Mosher TJ, Smith HE, Collins C, Liu Y, Hancy J, Dardzinski BJ, et al. Change in knee cartilage T2 at MR imaging after running: a feasibility study. Radiology 2005;234:245-249 29. Mosher TJ, Dardzinski BJ. Cartilage MRI T2 relaxation time
mapping: overview and applications. Semin Musculoskelet Radiol 2004;8:355-368
30. Yao L, Gentili A, Thomas A. Incidental magnetization transfer contrast in fast spin-echo imaging of cartilage. J Magn Reson Imaging 1996;6:180-184
31. Prock T, Collins D, Leach MO. Numerical evaluation of shaped surface coil sensitivity at 63 MHz. Phys Med Biol
2001;46:1753-1765
32. Gensanne D, Josse G, Lagarde JM, Vincensini D. High spatial resolution quantitative MR images: an experimental study of dedicated surface coils. Phys Med Biol 2006;51:2843-2855 33. Hurson C, Kashir A, Flavin R, Kelly I. Routine patellar
resurfacing using an inset patellar technique. Int Orthop 2010;34:955-958
34. Hantes ME, Zachos VC, Bargiotas KA, Basdekis GK, Karantanas AH, Malizos KN. Patellar tendon length after anterior cruciate ligament reconstruction: a comparative magnetic resonance imaging study between patellar and hamstring tendon autografts. Knee Surg Sports Traumatol Arthrosc 2007;15:712- 719
35. Niitsu M, Ikeda K. Magnetic resonance microscopic images with 50-mm fi eld-of-view of the medial aspect of the knee.
Acta Radiol 2004;45:760-768