◈ 원 저 ◈
고속스핀에코기법을 이용한 MRI검사에서 ETL 변화에 따른 영상 blurring의 평가
권순용1·임우택1·강충환1·김경수1·김순배1·김현수2
1건국대학교병원 영상의학과·2신구대학교 방사선과
Evaluation of the Image Blurring in the Fast Spin Echo Technique ccording to Variation of the ETL
Soon-Yong Kwon1·Woo-Taek Lim1·Chung-Hawn Kang1· Kyeong-Soo Kim1·Soon-Bae Kim1·Hyun-Soo Kim2
1Department of Radiology, Konkuk University Medical Center·
2Radiological Technology, Shingu College
9)
Abstract
The purpose of this study is to evaluate image blurring according to variation of the ETL and propose the clinically appropriate ETL range. SIEMENS MAGNETOM Skyra 3.0T and 20 channel head coil were used for the study. MRI phantom was kept the lines horizontally to three direction(X,Y,Z) of the coil and T1, T2 weighted images that used the fast spin echo technique acquired. The ETL with increase of 10 was applied from 10 to 80. In addition, the ETL with increase of 1 was applied in the interval statistically significant differences occurred. And T1, T2 weighted images that used the conventional spin echo technique acquired to compare image blurring of the images that used the fast spin echo technique.
The slope of lattice in the images was measured using Image J 1.47v program to evaluate image blurring.
And image blurring was determined by the degree of the slope. The statistical significance of both techniques was evaluated by the Kruskal-Wallis test of the SPSS 17.0v. And the correlation of the ETL and image blurring was evaluated quantitatively by regression analysis. The slope of the T1, T2 weighted images that used fast spin echo technique decreased as contrasted with conventional spin echo technique.
Received: Received: September 2. 2013. 1st Revised: September 30. 2013. / Accepted for Publication: October. 21. 2013.
Corresponding Author: 김현수
(462-743) 경기도 성남시 중원구 광명로 377 신구대학교 방사선과 Tel: 010-5344-8798
E-mail: [email protected]
In the result of the Kruskal-Wallis test, the T1, T2 weighted images that used fast spin echo technique made a significant difference with conventional spin echo technique. Particularly, in the Tomhane’ T2 test, the T1, T2 weighted images made a significant difference from ETL 22 and 31 respectively. In the result of the regression analysis, the R-squared of the T1, T2 weighted images are 0.762 and 0.793. It is difficult to apply the long ETL in the T1 weighted image caused by the short TR and multi-slices study. Therefore, clinical impact according to variation of the ETL is very slight in the T1 weighted images. But the application of the proper ETL is demanded in T2 weighted images using the fast spin echo technique in order to prevent image blurring.
Key word : Fast spin echo technique, ETL, Image Blurring
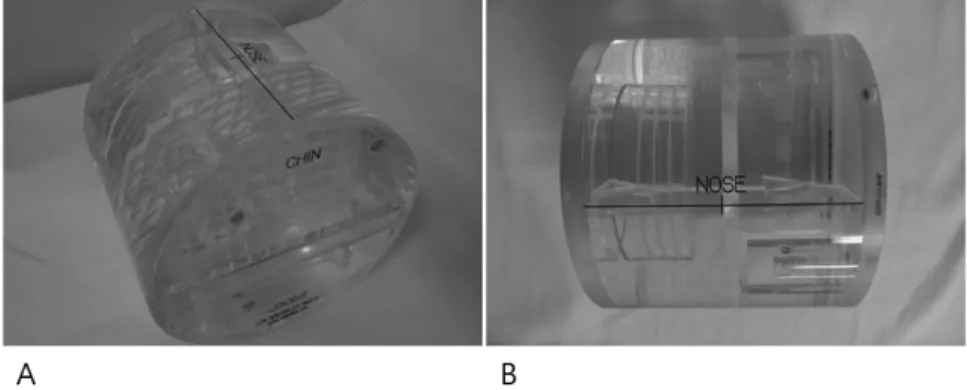
Fig. 1. Oblique(A) and lateral(B) view of the ACR MRI phatom
Ⅰ. 서 론
자기공명영상에서 영상의 질을 높이기 위해 적절한 스 캔시간은 중요한 요소이다. 스캔시간이 길수록 환자로부 터 발생하는 움직임이나 영상 자체에 운동 인공물이 발 생할 수 있고 이로 인해 영상의 질은 저하될 수 있다.
스캔시간을 결정하는 인자로는 반복시간(Time Repeat;
TR), 신호평균횟수(Number of Signal Averages; NEX), 위상부호화수가 있으며 스캔시간을 줄이기 위해서는 이 들 인자 중 한 가지 이상을 감소시켜야 한다.1 하지만 TR과 NEX를 감소하면 영상대조도와 신호 대 잡음 비 (Signal to Noise Ratio; SNR)에 영향을 미치고, 위상 부호화를 감소하면 공간해상도가 떨어지게 된다.2 하지만 고속스핀에코(Fast Spin Echo;이하 FSE)기법 이 소개되면서 다른 변수들의 변함없이 스캔시간을 획 기적으로 줄일 수 있게 되었다.3-7 고식적 스핀에코 (Conventional Spin Echo;이하 CSE)기법은 매 TR마 다 1개의 에코를 얻는 반면, FSE기법은 한번의 TR동안 반복적인 다수의 180° 재위상화펄스를 통해 한 개 이상 의 에코를 얻어 빠른 시간 안에 k-공간을 채우는 방식
이다.8 따라서 스캔시간은 180° 재위상화펄스의 개수만 큼 줄어들게 되고 FSE기법에서 180° 재위상화펄스의 개수는 에코열 길이(Echo Train Length;이하 ETL)라 는 변수로 조절이 가능하다.9
하지만 FSE기법에서 긴 ETL을 적용하는 경우, T2붕 괴에 의해 감소된 신호의 수신이 증가하게 된다. 이로 인해 k-공간 내에 신호 강도가 불균질 해질 수 있고, 영상 흐려짐(이하 blurring)이 발생할 수 있다.6
따라서 본 연구는 FSE기법을 이용한 MRI검사에서 ETL 변화가 영상 blurring에 미치는 영향을 정량적으 로 분석하고자 하였다. 더불어 펄스열에 따라 임상적으 로 적절한 ETL의 값을 제시하고자 한다.
Ⅱ. 대상 및 방법
1. 팬텀 영상획득
장비는 MAGNETOM Skyra 3.0T MRI 장치 (SIEMENS, Erlagen, Germany)와 20채널 두부코일을 사용하였다. 검사방법은 ACR MRI Accreditation 팬텀
Fig. 2. Sagittal local image(A) and image plan(B) of the ACR MRI phatom
TR (ms)
TE (ms)
FOV (mm)
ST (mm)
BW
(kHz/pixel) NEX Matrix
T1 weighted
image 850 11 200 3 501 1 512×512
T2 weighted
image 4000 100 200 3 221 1 512×512
Table 1. Scan parameter
Fig. 3. ROI(A) of the image and slop analysis(B)
(J. M. Specialty Parts, Inc., San Diego, CA, USA)을 두부코일 중앙부에 위치시키고 세 방향으로 수평이 되도록 고정 한 후 검사를 시행하였다(Fig. 1). 팬텀영 상 위치는 기하학적 왜곡을 측정하는 영역을 선택하였 다(Fig. 2).
검사는 FSE기법을 이용한 T1, T2 강조영상을 획득하 였고 ETL 변화에 따른 영상 blurring의 정도를 평가하 기 위해 10부터 80까지 ETL을 10씩 증가시키며 검사하 였다. 좀 더 정확한 ETL 범위를 제시하고자 실험 결과 통계적으로 유의한 차이가 발생한 ETL 구간에서는 추 가적으로 ETL을 1씩 증가시켜 검사하였다. 그리고 CSE
기법을 이용한 T1, T2 강조영상을 획득하여 FSE기법에 서 ETL을 증가시켰을 때 발생하는 영상 blurring의 정 도를 정량적으로 비교 분석하였다.
펄스열에 따른 변수들은 다음 표에 요약된 바와 같다 (Table 1).
2. 영상 blurring의 정량적 분석
영상 blurring의 정량적 분석은 획득된 팬텀 영상의 격자에서 측정된 경사도(slope)의 분석을 통해 이루어 졌으며, 경사도가 완만할수록 blurring의 정도가 크다
Fig. 4. Average slope of the T1, T2 weighted images
Fig. 5. CSE(A) and FSE(B)_ETL80 in T1 weighted images CSE(C) and FSE(D)_ETL80 in T2 weighted images
고 정의하였다. 경사도 측정은 image J 1.47v(WayneRasband National Institutes of Health, USA) 프로 그램을 사용하여 분석하였고 영상에서 특정 9개의 구역 을 정하여 신호 강도 profile을 획득한 후 그 경사도를 측정하였다(Fig. 3).
3. 통계분석 방법
측정된 경사도는 SPSS(version 17.0, Chicago, IL, USA)의 비모수 통계방법인 Kruskal-Wallis 검정을 사 용하여 각각의 영상 그룹들에 대한 유의성을 평가하였 다. 그리고 CSE기법을 이용한 영상을 기준으로 FSE기 법을 이용한 영상 그룹들의 유의성을 평가하기 위하여 Tamhane의 T2 사후검정을 시행하였다.
또한 ETL과 영상 blurring의 관계를 정량적으로 평 가하기 위해 단순 회기분석을 시행하였으며 독립변수는 ETL 그리고 종속변수는 영상 blurring으로 정하였다.
통계적 유의수준은 0.05미만으로 하였다.
Ⅲ. 결 과
분석 결과, FSE기법을 이용한 T1, T2 강조영상은 CSE기법을 이용한 영상과 비교했을 때 ETL이 증가함 에 따라 경사도의 평균값이 감소하였다(Fig. 4).
다음은 CSE기법과 FSE기법(ETL 80)을 이용한 T1, T2 강조영상의 확대 영상이다(Fig. 5).
T1 weighted images T2 weighted images
B SE T p B SE T p
상수 86.809 0.160 543.909 상수 87.144 0.110 793.927
ETL -0.060 0.003 -18.003 0.00 ETL -0.046 0.002 -19.845 0.00
R²=0.762 F=324.10 R²=0.793 F=393.838
Table 3. Results of the simple regression analysis
T1 weighted image T2 weighted image
ETL Average slope p-value ETL Average slope p-value
1 86.44±0.44 1.000 1 86.86±0.52 1.000
10 86.10±0.39 1.000 10 86.80±0.63 1.000
20 85.84±0.36 0.634 20 86.48±0.64 1.000
21 85.57±0.44 0.100 30 85.86±0.40 0.052
22 85.34±0.48 0.018 31 85.75±0.27 0.015
23 85.11±0.29 0.000 32 85.71±0.35 0.012
24 85.02±0.30 0.000 33 85.46±0.22 0.002
25 85.01±0.33 0.000 34 85.42±0.28 0.001
26 84.84±0.28 0.000 35 85.41±0.26 0.001
27 84.60±0.40 0.000 36 85.33±0.14 0.000
28 84.54±0.35 0.000 37 85.23±0.33 0.000
29 84.48±0.13 0.000 38 85.22±0.30 0.000
30 84.44±0.43 0.000 39 85.22±0.39 0.000
40 84.42±0.43 0.000 40 85.22±0.33 0.000
50 83.91±0.68 0.000 50 84.81±0.42 0.000
60 83.43±0.69 0.000 60 84.28±0.59 0.000
70 82.06±0.93 0.000 70 83.86±0.69 0.000
80 82.03±0.54 0.000 80 83.61±0.50 0.000
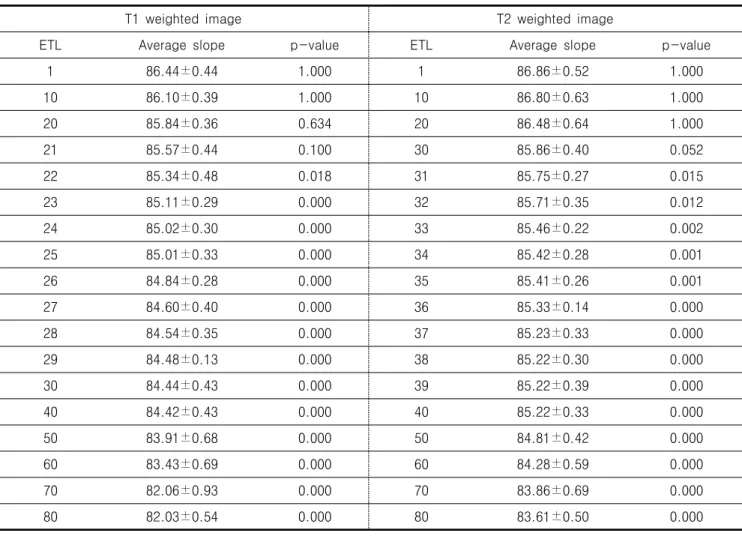
Table 2. Average slope and p-value in the Tamhane T2 test
Kruskal-wallis 검정을 통한 분석한 결과, T1, T2 강조영상 모두 ETL의 변화에 따라 각 그룹들 간에 유 의한 차이가 나타났다(p<0.05). 특히, Tamhane의 T2 를 통한 사후 검정결과에서는 CSE기법을 이용한 영상 과 비교했을 때 FSE기법을 이용한 T1 강조영상의 경우 ETL 22 이상부터 유의한 차이가 나타났고(p<0.05), T2 강조영상은 ETL 31 이상부터 유의한 차이가 나타났다 (p<0.05)(Table 2).단순회기분석 결과에서도 T1, T2 강조영상 모두 ETL 의 변화가 경사도에 영향을 주는 것으로 나타났다 (p<0.05). T1강조영상에서 회기계수(B)는-0.060 그리 고 결정계수(R²)는 0.762로 나타났다. T2강조영상에서 회기계수(B)는 –0.046 그리고 결정계수(R²)는 0.793로 나타났다(Table 3).
Ⅳ. 결론 및 고찰
FSE기법은 CSE기법의 긴 영상획득시간을 극복하기 위 해 1986년 Henning 등에 의해 RARE(Rapid Acquisition with Relaxation Enhancement)라는 펄스열로 처음 소 개된 후, 고주파 펄스의 숙임각(flip angle) 오차를 줄이 기 위해 Carr-Purcell-Meiboom- Gill 펄스열을 적용하 는 등의 수정을 거쳐 FSE라는 이름이 붙여졌다. 한번의 TR동안 한 번의 위상부호화 단계(phase encoding step) 를 얻는 CSE기법에 비해, FSE기법은 다중 위상부호화 단계를 생성함으로써 더 빠르게 k-공간을 채워 스캔시간 을 줄일 수 있다.10-11 하지만 FSE기법에서 긴 ETL을 사용할 경우 T2붕괴에 의해 신호가 감소된 신호의 수신 이 증가하게 되고, 이는 k-공간 내 신호 강도의 불균질 을 초래하게 되어 영상 blurring을 증가시킬 수 있다. 본 연구는 FSE기법에서 ETL이 증가함에 따라 나타나는 영 상 blurring을 정량적으로 분석하고 펄스열에 따라 적절 한 ETL의 사용 범위를 제시하고자 하였다.
앞서 이루어진 연구에서는 FSE기법을 이용한 T1, T2 강조영상, 양자밀도영상, 3D영상에서 ETL이 증가함에 따라 나타난 영상의 흐려짐을 정량적으로 분석하였고 3D FSE영상을 제외한 나머지 펄스열에서는 ETL 증가 가 영상 흐려짐에 미치는 영향이 유의하지 않다고 설명 하였다.12 하지만 이 연구방법의 한계점은 펄스열마다 같은 ETL이 적용되지 않아 펄스열에 따른 ETL 변화가 정확히 평가되지 않았고 T1 강조영상의 경우 최대 ETL 의 수를 12로 T2 강조영상의 경우 최대 ETL의 수를 22로 설정하여 그 이상의 ETL적용에서 나타날 수 있는 영향이 제대로 제시되지 않았다는 점이다.
따라서 본 연구는 이러한 한계점을 보완하여 각각의 펄스열에 같은 ETL을 적용하였고, ETL 변화에 따른 영향을 좀 더 정확히 분석하기 위해 극단적으로 ETL을 80까지 높여가며 검사를 진행하였다. 그 결과, 선행연 구와 달리 FSE기법을 이용한 T1 강조영상에서는 ETL 22이상부터 그리고 T2강조영상에서는 ETL 31이상부터 CSE기법을 이용한 영상과 비교하여 경사도에 유의한 차이(p<0.05)가 나타났다. 또한 단순회기분석의 결과에 서도 ETL이 영상 blurring과 비교적 높은 상관관계를 가지고 있음을 알 수 있었다.
본 연구의 제한점으로는 자기공명영상 팬텀을 사용하 였기 때문에 조직의 이완시간 차이에 따른 영향을 알 수 없었던 점과 경사도를 측정하는 과정에서 발생할 수
있는 오차를 감안하지 못한 점이다.
임상적으로 FSE기법을 이용한 T1 강조영상에서는 짧 은 TR과 복수단면검사의 시행으로 긴 ETL의 적용이 힘들다. 따라서 T1 강조영상에서는 ETL의 변화가 영상 blurring에 미치는 영향은 미미하다. 하지만 긴 TR을 사용하는 T2 강조영상에서는 긴 ETL의 적용이 가능하 기 때문에 부적절한 ETL을 적용할 경우 영상 blurring 을 증가시킬 수 있다. 그러므로 FSE기법을 이용한 T2 강조영상에서 영상 blurring을 방지하기 위해서는 검사 자의 적절한 ETL의 적용이 필요할 것으로 사료된다.
참고문헌
1. Kim Yeonggeun et al. MRI in practice. Acade- mya 2008:116-118.
2. Constable RT, Smith RC, Gore JC. Signal-to- noise and contrast in fast spin echo (FSE) and inversion recovery FSE imaging. J Comput Assist Tomogr 1992;16:41-47.
3. Mirowitz SA. Diagnostic pitfalls and artifacts in abdominal MR imaging: a review. Radiology 1998;208:577-589
4. Wood ML, Runge VM, Henkelman RM. Overc- oming motion in abdominal MR imaging. AJR Am J Roentgenol 1988; 150:513-522
5. Arena L, Morehouse HT, Safir J. MR imaging artifacts that simulate disease: how to recognize and eliminate them. Radiographics 1995;15:1373-1394
6. Li T, Mirowitz SA. Fast T2-weighted MR imaging: impact of variation in pulse sequence parameters on image quali\-ty and artifacts.
Magn Reson Imaging 2003;21:745-753
7. Wolff AB, Pesce LL, Wu JS, Smart LR, Medvecky MJ, Haims AH. Comparison of spin echo T1-weighted sequences ver-sus fast spin-echo proton density-weighted sequences for evaluation of meniscal tears at 1.5 T.
Skeletal Radiol 2009; 38:21-29
8. Listerud J, Einstein S, Outwater E, et al. First principles of fast spin echo. Magn Reson Q 1992; 8:199-244.
9. Kim Chiyeong, Ahn Changbeom. Enhancement of fast spin echo imaging using optimal echo arrangement and filtering. The Korean Society of Medical & Biological Engineering 1997:240.
10. Van Hoe L, Bosmans H, Aerts P, Baert AL, Fevery J, Kiefer B, et al. Focal liver lesions:
fast T2-weighted MR imaging with half-Fourier rapid acquisition with relaxation enhancement. Radiology 1996;201:817-823.
11. Gaa J, Hatabu H, Jenkins RL, Finn JP, Edelman RR. Liver masses: replacement of conventional T2-weighted spin-echo MR imaging with breath-hold MR imaging.
Radiology 1996;200:459-464.
12. Jong Woo Kim, Sang Hoon Lee, Namkug Kim, PhD, Kyung-Sik Cho, Jin Seong Lee. Impact of the Parameter Variation on the Image Blurring in 3T Magnetic Resonance Imaging: A Phantom Study. The Korean Society of Radiology 2013:355-362.