INTRODUCTION
Two commonly used contrast mechanisms in magnetic resonance (MR) imaging are two-dimensional (2D) turbo spin echo (TSE) T2-weighted imaging and proton density imaging with or without fat suppression, which can provide
Qualitative and Quantitative Assessment of Isotropic Ankle Magnetic Resonance Imaging: Three-Dimensional Isotropic Intermediate-Weighted Turbo Spin Echo versus Three-Dimensional Isotropic Fast Field Echo Sequences
Hyun Su Kim, MD
1, Young Cheol Yoon, MD
1, Jong Won Kwon, MD
1, Bong-Keun Choe, MD, PhD
21Department of Radiology, Samsung Medical Center, School of Medicine, Sungkyunkwan University, Seoul 135-710, Korea; 2Department of Preventive Medicine, School of Medicine, Kyung Hee University, Seoul 130-872, Korea
Objective: To compare the image quality of volume isotropic turbo spin echo acquisition (VISTA) imaging method with that of the three-dimensional (3D) isotropic fast field echo (FFE) imaging method applied for ankle joint imaging.
Materials and Methods: MR imaging of the ankles of 10 healthy volunteers was performed with VISTA and 3D FFE sequences by using a 3.0 T machine. Two radiologists retrospectively assessed the tissue contrast between fluid and cartilage (F-C), and fluid and the Achilles tendon (F-T) with use of a 4-point scale. For a quantitative analysis, signal-to-noise ratio (SNR) was obtained by imaging phantom, and the contrast ratios (CRs) were calculated between F-T and F-C. Statistical analyses for differences in grades of tissue contrast and CRs were performed.
Results: VISTA had significantly superior grades in tissue contrast of F-T (p = 0.001). Results of 3D FFE had superior grades in tissue contrast of F-C, but these result were not statistically significant (p = 0.157). VISTA had significantly superior CRs in F-T (p = 0.002), and 3D FFE had superior CRs in F-C (p = 0.003). The SNR of VISTA was higher than that of 3D FFE (49.24 vs. 15.94).
Conclusion: VISTA demonstrates superior tissue contrast between fluid and the Achiles tendon in terms of quantitative and qualitative analysis, while 3D FFE shows superior tissue contrast between fluid and cartilage in terms of quantitative analysis.
Index terms: MRI; 3D isotropic imaging; Ankle; Cartilage; Tendon
Received December 7, 2011; accepted after revision January 19, 2012.
Corresponding author: Young Cheol Yoon, MD, Department of Radiology, Samsung Medical Center, School of Medicine, Sungkyunkwan University, 50 Irwon-dong, Gangnam-gu, Seoul 135-710, Korea.
• Tel: (822) 3410-2518 • Fax: (822) 3410-2559
• E-mail: [email protected]
This is an Open Access article distributed under the terms of the Creative Commons Attribution Non-Commercial License (http://creativecommons.org/licenses/by-nc/3.0) which permits unrestricted non-commercial use, distribution, and reproduction in any medium, provided the original work is properly cited.
Korean J Radiol 2012;13(4):443-449
an excellent signal-to-noise ratio (SNR) and contrast between tissues of interest (1). The ankle joint has a complex anatomy and is comprised of three articulations.
The tibiotalar joint has a curved surface and the ligaments and tendons run in different planes, thus the evaluation of oblique or small structures using orthogonal planes of 2D TSE can be challenging. Three-dimensional acquisition techniques, with the capability for arbitrary multiplanar reconstruction and reduction of partial-volume artifact have been applied for ankle joint imaging (1, 2).
Several clinical studies using three-dimensional (3D) TSE for evaluation of knee joints have reported promising results (3-5). For ankle joints, a preliminary study using 3D TSE in 10 healthy volunteers has been published recently (2).
Three-dimensional fast field echo (FFE) imaging, including 3D spoiled gradient-recalled echo (SPGR) imaging, is considered the standard for morphologic imaging of
pISSN 1229-6929 · eISSN 2005-8330
cartilage (6-8). However, 3D FFE imaging is generally thought to have disadvantages in the evaluation of other joint structures, such as ligaments or menisci, and is thus considered to be less useful for the evaluation of internal derangement of the joint (1).
A comparison of 2D TSE and 3D FFE techniques for the evaluation of cartilage has been reported, and the results revealed superior diagnostic performance in 2D TSE compared with 3D FFE (9). Several other studies comparing 2D SE and 3D FFE sequences have suggested a complementary role of 3D FFE imaging in the evaluation of joint structures and other than cartilage (10-12).
Because it is crucial for MR imaging studies to have acceptable imaging acquisition time to be suitable for routine clinical work, determining a single imaging sequence that allows for evaluating both cartilage and tendons is desirable. There is no published literature comparing the image quality of 3D TSE and 3D FFE
sequences for musculoskeletal imaging. Because it has been reported previously that there is no significant difference in overall image quality between 2D TSE and 3D TSE MR imaging (2), we have reasoned that it is necessary that we compare the tissue contrast of 3D TSE and 3D FFE sequences for joint imaging. In the current study we compared 3D isotropic TSE intermediate-weighted MR imaging with 3D isotropic FFE MR imaging for tissue contrast of cartilage and tendons in the ankle joint.
MATERIALS AND METHODS
Subjects and MR Imaging
The Institutional Review Board approved this Health Insurance Portability and Accountability Act (HIPAA)- compliant study, and informed consent was obtained.
MR imaging was performed of the ankles of 10 healthy volunteers (mean age, 28 years; age range, 26-30 years), consisting of 3 men (mean age, 28 years; age range, 26-29 years) and 7 women (mean age, 29 years; age range, 26-30 years). All images were acquired between November 2009 and April 2010 using a 3.0 T machine (Gyroscan Intera Achieva; Philips Medical Systems, Best, Netherlands). The details of the MR protocol are described in Table 1. The sequences with fat saturation were obtained in the sagittal plane.
Imaging with the 3D TSE intermediate-weighted sequence with refocusing control (volume isotropic turbo spin echo acquisition [VISTA]) and the 3D isotropic FFE sequence
(water-selective sequence, fluid [WATS-f]; non-spoiled FFE 3D volume scan with the principle of selective excitation technique [ProSet]) was performed.
The VISTA sequence was obtained utilizing a TSE 3D non- selective method, which uses short, non-volume selective TSE refocusing pulses and allows shorter echo spacing to prevent chemical shift artifacts. The k-space sampling order was low-to-high (low-high TSE profile order). Refocusing control was utilized to lower the specific absorption rate (SAR) with only a minor loss of the SNR in TSE scans with a long echo train length. Also, a driven equilibrium (DRIVE) radio frequency reset pulse was applied at the end of a TSE echo train to accelerate the relaxation time and the return to equilibrium of the magnetization. Therefore, the total scan time can be decreased and flow void artifacts can be reduced by enhancement of the fluid signal. Fat suppression was done utilizing spectral attenuated inversion recovery (SPAIR) method, which is a frequency-selective adiabatic inversion pulse utilizing the difference in resonance frequencies of water and fat.
The WATS-f sequence is a non-spoiled FFE pulse sequence with ProSet, which is a selective excitation technique that employs a frequency and spatially selective excitation pulse.
With the use of a binominal RF pulse with a flip angle of 11.25° and 33.75° in 1 : 3 : 3 : 1 spectral spatial pulses, selective water excitation and strong fat suppression was achieved, which can improve contrast with no effect on Table 1. MR Sequence Parameters
3D VISTA 3D WATS-f
TR/TE (msec) 1300/33 19/8.8
FOV (mm) 150 150
Acquisition voxel size (mm) 0.5/0.5/0.5 0.5/0.5/0.5
Slice gap (mm) 0 0
Receiver bandwidth (Hz/pixel) 317 95.8
SENSE factor 4 4
Echo train length 64
Flip angle 90 35
Fat suppression SPAIR ProSet
Number of signal averaging 2 2
Slice 150 150
Scan time 7 min 31 sec 7 min 22 sec
Note.— MR = magnetic resonance, 3D = three-dimensional, VISTA = volume isotropic turbo spin echo acquisition, TSE
= turbo spin echo, WATS-f = water selective, fluid, TR/TE
= repetition time/echo time, FOV = field of view, SENSE = sensitivity encoding, SPAIR = spectral attenuated inversion recovery, ProSet = principle of selective excitation technique
scan time.
To quantitatively assess the SNR at parallel imaging, we measured noise via noise-only acquisitions (13, 14). The bottle phantom containing 2000 cc of white mineral oil (liquid petroleum at 20°C, FAC phantom assembly; Invivo Corp., Orlando, FL, USA) was scanned with VISTA and WATS-f sequences. The phantom was positioned at the center of the images and scanned in the sagittal plane. Noise-only data was acquired with RF turned off for parameters of each of the VISTA and 3D FFE sequences. Both object and noise-only data were reconstructed offline to apply parallel imaging calibration weights, homodyne partial Fourier phase correction, and multichannel image combination to the noise-only data. To calculate the SNR of the phantom, regions of interest (ROIs) were placed in the reconstructed object images to measure mean signal intensities, and duplicated in the noise-only reconstructions to measure noise.
Image Analysis
Two radiologists specializing in the musculoskeletal system (6 and 5 years of experience in musculoskeletal MR imaging, respectively) independently evaluated VISTA and WATS-f images using a picture archiving and communication system (PACS, Centricity Radiology RA 1000; General Electric Healthcare, Chicago, IL, USA). At the time of image analysis, the radiologists separately analyzed VISTA and WATS-f MR imaging in random order. The coronal and axial reformation with a slice thickness of 0.5 mm of both sequences was performed simultaneously during the image analysis using Aquarius NET 1.8.2.6 software (TeraRecon Inc., San Mateo, CA, USA). The two readers subjectively assessed the tissue contrasts between fluid and cartilage (F-C; comprehensive analysis of contrast at the tibiotalar and subtalar joints) and between fluid and tendon (F-T; Achilles tendon at the tibiotalar joint level) with use of a 4-point scale (1, poor; 2, fair; 3, good; and 4, excellent) for VISTA and WATS-f imaging independently. The time interval between the 2 sessions (sets of VISTA and WATS-f) was 2 weeks.
For a quantitative analysis, image contrast ratios (CRs) were calculated between tendon, cartilage, and joint fluid in VISTA and WATS-f MR imaging (15-18). Signal intensity from cartilage, tendon, and synovial fluid was measured in all patients in ROIs in the subtalar joint cartilage, Achilles tendon, and fluid in the posterior subtalar recess.
To ensure consistency, measurements were performed by one radiology resident (3 years of experience). ROIs were
placed in the respective tissues, with the area as large as possible to avoid the inclusion of confounding structures image contrast between the tissues or between tissue, and fluid was calculated by dividing the difference between the signal intensity (SI) of the reference tissue and the SI of the compared tissue by the sum of the SI of the reference tissue and the SI of the compared tissue, as follows: (SIref - SIctiss) / (SIref + SIctiss), where SIref is the SI of the reference tissue, and SIctiss is the SI of the compared tissue. The CR of the SI of tendon to the SI of synovial fluid and the CR of the SI of cartilage to the SI of synovial fluid were calculated for each sequence. SIs were measured twice, and the mean CR for each sequence was used for comparison.
We measured the SNR in VISTA and FFE with the following calculation: SNR = mean of the object/standard deviation of the noise in the object. As the standard deviation of the noise in the object is biased by proper signal variation, the standard deviation of the noise in the object, s, was estimated from the mean of the noise image at the same location. For a Rician distribution in the absence of a signal, s was calculated as the mean of the noise image/1.253 (19). Hence, the SNR = Mobject / s = 1.253 x Mobject / Mnoise, where Mobject is the mean of the object in the object image, and Mnoise is the mean of the noise image. To obtain the mean value of the object and the noise image, we applied 435.7 mm2 - sized ROIs at the same position of the phantom and noise images.
Statistical Analysis
Statistical analysis for interobserver agreement was calculated using the kappa analysis (± 95% confidence interval [CI]). Interobserver agreement was rated as less than chance agreement for a κ value of < 0, slight agreement for a κ value between 0.01 and 0.20, fair agreement for a κ value between 0.21 and 0.40, moderate agreement for a κ value between 0.41 and 0.60, substantial agreement for a κ value between 0.61 and 0.80, and almost perfect agreement for a κ value between 0.81 and 0.99 (20). Non-squared data are expressed as the percentage of agreement.
For analysis of differences in subjective tissue contrast scores between VISTA and WATS-f MR imaging, the Wilcoxon signed-rank test was used. For analysis of the differences in image CRs between the two images a paired t test was used. The image CRs between the VISTA and WATS-f were compared using a paired t test. A p value < 0.05 was considered statistically significant.
RESULTS
Interobserver agreement in the evaluation of VISTA images were as follows: almost perfect agreement for F-C;
and fair agreement for F-T. The results for WATS-f image evaluation were as follows: almost perfect agreement for F-C; and substantial agreement for F-T (Table 2).
A statistically significant difference between VISTA and WATS-f was demonstrated for tissue contrast of F-T and F-C.
VISTA images showed significantly superior grades in tissue contrast of F-T (p = 0.001). Reader 1 rated excellent for 8 studies and good for 2 studies of VISTA images. Reader 2 rated excellent for 5 studies and good for 5 studies of VISTA images. Reader 1 rated excellent for 2 studies, good for 7 studies, and fair for 1 study of WATS-f images. Reader 2 rated excellent for 2 studies, good for 5 studies, and fair for 3 studies of WATS-f images.
WATS-f revealed superior grades in tissue contrast of F-C, but the result was not statistically significant (p = 0.157). Reader 1 rated good for all studies and reader 2
rated excellent for 1 study and good for 9 studies of WATS-f images. Reader 1 rated good for 9 studies and fair for 1 study, and reader 2 rated good for all studies of VISTA images.
The mean CRs for F-T were significantly higher in VISTA than WATS-f (p = 0.002) (Fig. 1), and the mean CRs for F-C was significantly higher in WATS-f than VISTA (p = 0.003) (Fig. 2, Table 3). In the SNR analysis with a phantom, the SNR of VISTA imaging was higher than WATS-f imaging (49.24 vs. 15.94).
DISCUSSION
Until recently, the use of 3D sequences with isotropic resolution in musculoskeletal MR imaging has been limited by the long acquisition and post-processing time, and 3D MR imaging of joints has mainly focused on imaging of cartilage (7, 21-25). Numerous MR sequences have been suggested for imaging cartilage, the majority of which were FFE sequences, including fat-suppressed 3D SPGR, a sensitive imaging sequence for the detection of articular cartilage defects in the knee (7, 21). The 3D FFE sequence, however, is generally thought to be less useful for the diagnosis of internal derangement of the joint (1). Several disadvantages of the FFE sequence, including susceptibility artifacts in the presence of metal or calcified structures, magic angle artifacts, insufficient tissue contrast, and limited accuracy in the detection of degenerative changes in tendons and ligaments have been suggested (26, 27).
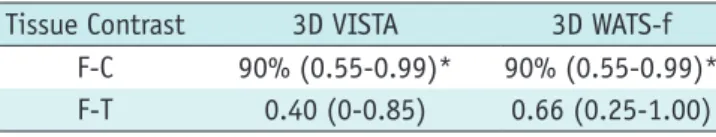
MR images obtained at 3.0 T and parallel imaging in Table 2. Interobserver Agreement in Evaluation of
Subjective Tissue Contrast
Tissue Contrast 3D VISTA 3D WATS-f
F-C 90% (0.55-0.99)* 90% (0.55-0.99)*
F-T 0.40 (0-0.85) 0.66 (0.25-1.00) Note.— Data are mean κ values; numbers in parentheses are 95% confidence interval. *Non-squared data are expressed as percentage of agreement. F = fluid, C = cartilage, T = tendon, 3D = three-dimensional, VISTA = volume isotropic turbo spin echo acquisition, WATS-f = water selective, fluid
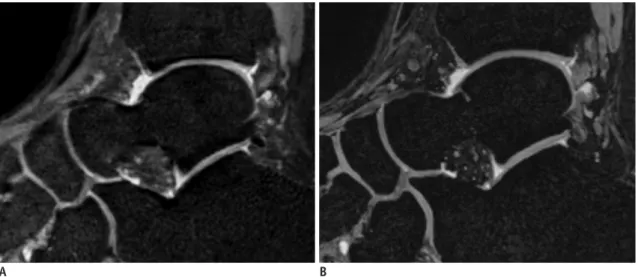
Fig. 1. MR images of right ankle in 31-year-old woman.
For 3D VISTA (A), reader A graded excellent and reader B graded good for grade of contrast between Achilles tendon and joint fluid. For 3D WATS-f (B), both readers graded fair. CR of SI of tendon to SI of synovial fluid was 0.953 in 3D VISTA and 0.920 in 3D WATS-f. 3D = three- dimensional, VISTA = volume isotropic turbo spin echo acquisition, WATS-f = water selective, fluid, CR = contrast ratio; SI = signal intensity
A B
both phase-encoding directions can facilitate improved image quality within a shorter imaging time (12, 28). Using partial Fourier acquisition also reduces the number of phase encodes required to encode a large 3D data set (29). In addition, volumetric imaging reduces the time spent for multiplanar imaging, which is necessary for assessment of complex musculoskeletal structures in the joint. With these technical advances, the 3D TSE sequence is clinically feasible and several reports have revealed promising results (2, 3, 30). The diagnostic performance of 3D TSE images of the knee joint with 3.0 T MR had similar results compared with a 2D MR imaging protocol (3, 30). Stevens et al. (2) reported no significant difference for the overall image quality and artifacts demonstrated between the 2D TSE and 3D TSE sequences on MR imaging of the ankle joint at 3.0 T. In some reports, a higher amount of image blurring and indistinctness of the structural edges was noted on 3D TSE images compared with the 2D TSE images (31). There have been several reports suggesting the potential role of the FFE sequence (10, 11). Reeder et al. (11) compared the T1-
weighted 2D SE sequence and the 3D FFE sequence in 50 patients with suspected internal derangement of the knee, who then underwent arthroscopic examinations. The results revealed sensitivity and specificity of the 3D FFE sequence in the diagnosis of meniscal tears and ligament disruption comparable to those of SE sequence suggesting that both sequences have a role in the diagnosis of knee injuries (11).
Another study with clinical and histopathologic comparison of 2D SE and 3D FFE sequences using cadaveric knee joints revealed that 3D FFE findings correlated better with degenerative meniscal changes (10).
Three-dimensional FFE with selective frequency and a spatially selective excitation radiofrequency pulse with binominal amplitude ratios serve water-selective excitation and fat suppression that enables relatively better imaging of the internal joint structure compared with 3D SPGR sequences (32, 33). In balanced FFE imaging, banding artifacts due to off-resonance are challenging as repetition time increases or at high field (34). Thus, in this study we compared 3D isotropic TSE intermediate-weighted MR imaging with 3D isotropic FFE with WATS-f in terms of the image quality of the ankle joint, which has a more complex joint and ligament structure compared with the knee joint.
In the present study, the mean CRs for F-C were
significantly higher in 3D FFE imaging than 3D isotropic TSE imaging. The subjective tissue contrast score was higher in 3D FFE, but the result was not statistically significant.
Through many comparative studies, the 3D FFE sequence has been suggested to have a more adequate pulse sequence for clinical imaging of cartilage compared with the 2D TSE Fig. 2. MR images of right ankle in 30-year-old man.
For 3D VISTA (A), both readers graded fair for grade of contrast between cartilage and joint fluid. For 3D WATS-f (B), both readers graded excellent. CR of SI of cartilage to SI of synovial fluid was 0.274 in 3D VISTA and 0.297 in 3D WATS-f. 3D = three-dimensional, VISTA = volume isotropic turbo spin echo acquisition, WATS-f = water selective, fluid, CR = contrast ratio, SI = signal intensity
A B
Table 3. Image Contrast Ratios
Fluid-Cartilage Fluid-Tendon
VISTA FFE VISTA FFE
Average 0.30 ± 0.05 0.34 ± 0.05 0.95 ± 0.01 0.92 ± 0.03
P 0.003 0.002
Note.— Measured CRs are the means ± SDs. Significant difference at p < 0.05. FFE = fast field echo, SD = standard deviation, VISTA = volume isotropic turbo spin echo acquisition, WATS-f = water selective, fluid
sequence (7, 21). However, for low-grade chondral lesions, it has been suggested that 2D intermediate-weighted fat suppressed TSE shows best diagnostic performance among the 2D and 3D gradient echo (GRE) images (9).
The mean CRs and subjective tissue contrast score for F-T was significantly higher in 3D isotropic TSE imaging than in 3D FFE imaging. The result suggests that using a 3D isotropic TSE sequence may enable better diagnosis of the injury of internal structure of the joints, such as tendons or ligaments.
Our study had several limitations. First, only healthy volunteers were initially imaged, and the number of participants was relatively small. Additional studies in patients with internal derangement of the ankle joint for comparison of diagnostic performance would be beneficial.
Second, awareness of the MR sequence while evaluating the image may have caused bias. This may have caused a discrepancy between qualitative and quantitative analyses of the results of F-C. Third, comparison of the 3D-TSE sequence with 2D-TSE sequence or other FFE sequences was not performed. Since imaging analysis was performed after acquiring imaging from the volunteers, adding another sequence for further comparison was not possible. It is reported that diagnostic performance with 3D balanced FFE imaging is similar to standard 2D sequences and commonly used 3D-GRE sequences for the morphologic assessment of knee cartilage (35, 36). Comparison with other sequences is required in future studies.
In summary, 3D isotropic TSE intermediate-weighted MR imaging demonstrated superior tissue contrast between F-T, while 3D isotropic FFE imaging appeared to demonstrate superior tissue contrast between F-C in terms of CR. Three- dimensional isotropic FFE imaging demonstrated a superior subjective tissue contrast score, but the result was not statistically significant.
REFERENCES
1. Gold GE, Chen CA, Koo S, Hargreaves BA, Bangerter NK.
Recent advances in MRI of articular cartilage. AJR Am J Roentgenol 2009;193:628-638
2. Stevens KJ, Busse RF, Han E, Brau AC, Beatty PJ, Beaulieu CF, et al. Ankle: isotropic MR imaging with 3D-FSE-cube--initial experience in healthy volunteers. Radiology 2008;249:1026- 1033
3. Jung JY, Yoon YC, Kwon JW, Ahn JH, Choe BK. Diagnosis of internal derangement of the knee at 3.0-T MR imaging:
3D isotropic intermediate-weighted versus 2D sequences.
Radiology 2009;253:780-787
4. Notohamiprodjo M, Horng A, Pietschmann MF, Müller PE, Horger W, Park J, et al. MRI of the knee at 3T: first clinical results with an isotropic PDfs-weighted 3D-TSE-sequence.
Invest Radiol 2009;44:585-597
5. Gold GE, Busse RF, Beehler C, Han E, Brau AC, Beatty PJ, et al. Isotropic MRI of the knee with 3D fast spin-echo extended echo-train acquisition (XETA): initial experience. AJR Am J Roentgenol 2007;188:1287-1293
6. McCauley TR, Disler DG. Magnetic resonance imaging of articular cartilage of the knee. J Am Acad Orthop Surg 2001;9:2-8
7. Recht MP, Piraino DW, Paletta GA, Schils JP, Belhobek GH. Accuracy of fat-suppressed three-dimensional spoiled gradient-echo FLASH MR imaging in the detection of patellofemoral articular cartilage abnormalities. Radiology 1996;198:209-212
8. Disler DG. Fat-suppressed three-dimensional spoiled gradient- recalled MR imaging: assessment of articular and physeal hyaline cartilage. AJR Am J Roentgenol 1997;169:1117-1123 9. Kim HJ, Lee SH, Kang CH, Ryu JA, Shin MJ, Cho KJ, et al.
Evaluation of the chondromalacia patella using a microscopy coil: comparison of the two-dimensional fast spin echo techniques and the three-dimensional fast field echo techniques. Korean J Radiol 2011;12:78-88.
10. Gückel C, Jundt G, Schnabel K, Gächter A. Spin-echo and 3D gradient-echo imaging of the knee joint: a clinical and histopathological comparison. Eur J Radiol 1995;21:25-33 11. Reeder JD, Matz SO, Becker L, Andelman SM. MR imaging of
the knee in the sagittal projection: comparison of three- dimensional gradient-echo and spin-echo sequences. AJR Am J Roentgenol 1989;153:537-540
12. Gold GE, Suh B, Sawyer-Glover A, Beaulieu C. Musculoskeletal MRI at 3.0 T: initial clinical experience. AJR Am J Roentgenol 2004;183:1479-1486
13. Dietrich O, Raya JG, Reeder SB, Reiser MF, Schoenberg SO.
Measurement of signal-to-noise ratios in MR images: influence of multichannel coils, parallel imaging, and reconstruction filters. J Magn Reson Imaging 2007;26:375-385
14. Li CQ, Chen W, Beatty PJ, Brau AC, Hargreaves BA, Busse RF, et al. SNR quantification with phased-array coils and parallel imaging for 3d-fSE. Stockholm: 19th annual meeting &
exhibition, International Society for Magnetic Resonance in Medicine, 2010:552
15. Held P, Seitz J, Fründ R, Nitz W, Lenhart M, Geissler A.
Comparison of two-dimensional gradient echo, turbo spin echo and two-dimensional turbo gradient spin echo sequences in MRI of the cervical spinal cord anatomy. Eur J Radiol 2001;38:64-71
16. Turetschek K, Wunderbaldinger P, Bankier AA, Zontsich T, Graf O, Mallek R, et al. Double inversion recovery imaging of the brain: initial experience and comparison with fluid attenuated inversion recovery imaging. Magn Reson Imaging 1998;16:127-135
17. Willinek WA, Bayer T, Gieseke J, von Falkenhausen M, Sommer
T, Hoogeveen R, et al. High spatial resolution contrast- enhanced MR angiography of the supraaortic arteries using the quadrature body coil at 3.0T: a feasibility study. Eur Radiol 2007;17:618-625
18. Nelles M, König RS, Gieseke J, Guerand-van Battum MM, Kukuk GM, Schild HH, et al. Dual-source parallel RF transmission for clinical MR imaging of the spine at 3.0 T: intraindividual comparison with conventional single-source transmission.
Radiology 2010;257:743-753
19. Gudbjartsson H, Patz S. The Rician distribution of noisy MRI data. Magn Reson Med 1995;34:910-914
20. Landis JR, Koch GG. The measurement of observer agreement for categorical data. Biometrics 1977;33:159-174
21. Disler DG, Recht MP, McCauley TR. MR imaging of articular cartilage. Skeletal Radiol 2000;29:367-377
22. McCauley TR, Disler DG. MR imaging of articular cartilage.
Radiology 1998;209:629-640
23. Yoshioka H, Alley M, Steines D, Stevens K, Rubesova E, Genovese M, et al. Imaging of the articular cartilage in osteoarthritis of the knee joint: 3D spatial-spectral spoiled gradient-echo vs. fat-suppressed 3D spoiled gradient-echo MR imaging. J Magn Reson Imaging 2003;18:66-71
24. Gay SB, Chen NC, Burch JJ, Gleason TR, Sagman AM.
Multiplanar reconstruction in magnetic resonance evaluation of the knee. Comparison with film magnetic resonance interpretation. Invest Radiol 1993;28:142-145
25. Wieslander SB, Rappeport ED, Lausten GS, Thomsen HS.
Multiplanar reconstruction in MR imaging of the knee.
Comparison with standard sagittal and coronal images. Acta Radiol 1998;39:116-119
26. Duc SR, Pfirrmann CW, Koch PP, Zanetti M, Hodler J. Internal knee derangement assessed with 3-minute three-dimensional isovoxel true FISP MR sequence: preliminary study. Radiology 2008;246:526-535
27. Carlson J, Crooks L, Ortendahl D, Kramer DM, Kaufman L. Signal-to-noise ratio and section thickness in two-
dimensional versus three-dimensional Fourier transform MR imaging. Radiology 1988;166:266-270
28. Weiger M, Pruessmann KP, Boesiger P. 2D SENSE for faster 3D MRI. MAGMA 2002;14:10-19
29. Noll DC, Nishimura DG, Macovski A. Homodyne detection in magnetic resonance imaging. IEEE Trans Med Imaging 1991;10:154-163
30. Kijowski R, Davis KW, Woods MA, Lindstrom MJ, De Smet AA, Gold GE, et al. Knee joint: comprehensive assessment with 3D isotropic resolution fast spin-echo MR imaging--diagnostic performance compared with that of conventional MR imaging at 3.0 T. Radiology 2009;252:486-495
31. Ristow O, Steinbach L, Sabo G, Krug R, Huber M, Rauscher I, et al. Isotropic 3D fast spin-echo imaging versus standard 2D imaging at 3.0 T of the knee--image quality and diagnostic performance. Eur Radiol 2009;19:1263-1272
32. Schick F. Simultaneous highly selective MR water and fat imaging using a simple new type of spectral-spatial excitation. Magn Reson Med 1998;40:194-202
33. Peng Q, McColl RW, Wang J, Weatherall PT. Novel rapid fat suppression strategy with spectrally selective pulses. Magn Reson Med 2005;54:1569-1574
34. Gold GE, Hargreaves BA, Reeder SB, Block WF, Kijowski R, Vasanawala SS, et al. Balanced SSFP imaging of the musculoskeletal system. J Magn Reson Imaging 2007;25:270- 278
35. Duc SR, Pfirrmann CW, Schmid MR, Zanetti M, Koch PP, Kalberer F, et al. Articular cartilage defects detected with 3D water-excitation true FISP: prospective comparison with sequences commonly used for knee imaging. Radiology 2007;245:216-223
36. Duc SR, Koch P, Schmid MR, Horger W, Hodler J, Pfirrmann CW. Diagnosis of articular cartilage abnormalities of the knee:
prospective clinical evaluation of a 3D water-excitation true FISP sequence. Radiology 2007;243:475-482