INTRODUCTION
Magnetic resonance imaging (MRI) is a widely used standard imaging technique for the diagnosis of abnormalities of bones, Received: May 11, 2017 Revised: August 22, 2017
Accepted: August 22, 2017
Corresponding author: Dr. Jin-Suck Suh, Department of Radiology, Research In-stitute of Radiological Science, YUHS-KRIBB Medical Convergence Research Insti-tute, and Severance Biomedical Science InstiInsti-tute, Yonsei University College of Medicine, 50-1 Yonsei-ro, Seodaemun-gu, Seoul 03722, Korea.
Tel: 82-2-2228-7420, Fax: 82-2-393-3035, E-mail: [email protected]
*Current address: Department of Radiology, Inje University College of Medicine, Haeundae Paik Hospital, Busan, Korea.
•The authors have no financial conflicts of interest. © Copyright: Yonsei University College of Medicine 2017
This is an Open Access article distributed under the terms of the Creative Com-mons Attribution Non-Commercial License (http://creativecomCom-mons.org/licenses/ by-nc/4.0) which permits unrestricted non-commercial use, distribution, and repro-duction in any medium, provided the original work is properly cited.
Three-Dimensional Fast Spin-Echo Imaging without
Fat Suppression of the Knee: Diagnostic Accuracy
Comparison to Fat-Suppressed Imaging on 1.5T MRI
Hee Woo Cho
1, Jin-Suck Suh
1, Jin-Oh Park
2, Hyoung-Sik Kim
2,
Soo Yoon Chung
1, Young Han Lee
1, and Seok Hahn
1*
1Department of Radiology, Research Institute of Radiological Science, YUHS-KRIBB Medical Convergence Research Institute, and
Severance Biomedical Science Institute, Yonsei University College of Medicine, Seoul;
2Department of Orthopedic Surgery, Yonsei University College of Medicine, Seoul, Korea.
Purpose: To evaluate the diagnostic performance of three-dimensional fast spin-echo (3D FSE-Cube) without fat suppression (NFS) for detecting knee lesions, using comparison to 3D FSE-Cube with fat suppression (FS).
Materials and Methods: One hundred twenty-four patients who underwent 1.5T knee magnetic resonance imaging (MRI) scans and 25 subsequent arthroscopic surgeries were retrospectively reviewed. Using arthroscopic results and two-dimensional images as reference standards, diagnostic performances of 3D FSE-Cube-NFS and FS imaging about lesions of ligament, meniscus, sub-chondral bone marrow edema (BME), and cartilage were compared. Scan parameters of 3D FSE-Cube imaging were previously optimized by a porcine knee phantom.
Results: No significant differences were observed between detection rates of NFS and FS imaging for detecting lesions of menis-cus and cartilage (p>0.05). However, NFS imaging had lower sensitivity for detection of medial collateral ligament (MCL) tears, and lower sensitivity and specificity for detection of BME lesions, compared to FS imaging (p<0.05).
Conclusion: 3D FSE-Cube-NFS imaging showed similar diagnostic performance for detecting lesions of meniscus or cartilage compared to FS imaging, unlike MCL or BME lesions.
Key Words: Knee, magnetic resonance imaging, three-dimensional image, Cube, fat suppression
pISSN: 0513-5796 · eISSN: 1976-2437 Yonsei Med J 2017 Nov;58(6):1186-1194
https://doi.org/10.3349/ymj.2017.58.6.1186
cartilages, ligaments, and menisci in the knee joints.1 While
conventional MRI protocols include various planes of two-di-mensional (2D) fast spin-echo (FSE) sequences, three-dimen-sional (3D) FSE imaging with variable flip angle (Cube) is iso-tropically acquired with thin sections, and can be reconst-ructed in any plane without image quality degradation. This 3D FSE imaging includes volume isotropic turbo spin-echo acquisition (VISTA®; Philips Healthcare, Best, the Netherlands),
sampling perfection with application-optimized contrasts using different flip-angle evolution (SPACE®; Siemens Healthcare,
Erlangen, Germany), and Cube® (GE Healthcare, Waukesha,
WI, USA). 3D FSE-Cube imaging offers many advantages in-cluding high spatial resolution, reduced partial volume aver-aging, relatively shorter scan time, and possible multiplanar re-formations.1-4 Moreover, recent studies have shown that 3D
FSE-Cube imaging has sensitivity, specificity, and accuracy com-parable to those of conventional 2D FSE imaging in
compre-hensive evaluation of knee joint injuries.4-13 Therefore, 3D
FSE-Cube imaging is currently well-established as an essential se-quence in routine knee MRI protocol at many institutions.
In the current study, we focused on 3D isotropic imaging wi-thout fat suppression (NFS) as a challenging topic. Fat satura-tion technique for fat signal suppression, which is routinely applied by 3D FSE-Cube imaging in knee MRI, has disadvan-tages over imaging NFS, e.g., the presence of relatively more se-vere susceptibility artifacts.14 Furthermore, a recent
compara-tive study showed that 3D isotropic NFS imaging is significantly more superior to the routine 3D fat-suppressed imaging for ligament traceability in ankle MRI.15 These suggest a
possibili-ty that 3D isotropic NFS imaging in knee MRI might be more helpful than fat-suppressed imaging for evaluating ligaments or other structures of the knee joint, with reduced susceptibility artifact and better ligament traceability, under certain clinical situations. Therefore, at this point, studies comparing the overall diagnostic performances of 3D FSE-Cube-NFS to those of 3D FSE-Cube-FS for knee joint lesions are desperately required. Pa-pers comparing “with” and “without” fat suppression (FS) in 3D FSE imaging of 3.0T MRI or 2D FSE imaging of 1.5T MRI have been published; however, to the best of our knowledge, there is no comparison study in 3D FSE imaging of 1.5T MRI.16-18
The purpose of this study was to evaluate the diagnostic per-formance of 3D FSE-Cube-NFS at 1.5T MRI for detecting knee lesions in the meniscus, ligaments, bone marrow, or cartilage, by comparing 3D FSE-Cube-NFS and 3D FSE-Cube-FS.
MATERIALS AND METHODS
Preclinical phantom imagingAlthough the main purpose of this study was to compare the diagnostic performances of 3D FSE-Cube-FS and NFS imag-ing sequences, a prior optimization study was also designed to solve the problem of longer scan times resulting from
addition-al 3D FSE-Cube-NFS scan. The optimization methodology was similar to that of a previous volunteer imaging study for scan parameters in a 3.0T knee MRI.19
A freshly harvested porcine knee phantom was imaged us-ing a 1.5T MRI system (Signa Horizon; GE Healthcare) with an 8-channel HD transmitter/receiver knee array coil (GE Health-care). MRI scans with varying parameter settings of repetition time (TR) and echo train length (ETL) were acquired. At first, the phantom was subjected to sagittal 3D FSE-Cube-FS and sagittal 3D FSE-Cube-NFS by using parameters of TR=1300 ms and ETL=30. FS technique using frequency-selective radiofre-quency pulse was applied for 3D FSE-Cube-FS. These scans served as a reference for subjective image quality assessment of other scans. Ranges of used parameters are shown in Table 1. Number of excitations and parallel imaging acceleration fac-tors were not changed, as any change in these parameters would increase the 3D FSE-Cube imaging scan time to more than 6 minutes, which is unacceptable in clinical imaging. Echo time remained the same to maintain constant image contrast weighting in all scans. Slice thickness and number, matrix size, and field of view were not changed to maintain constant voxel size. Receiver bandwidth was also not changed due to image blurring and insufficient FS.
Phantom imaging evaluation and selection of optimized parameters
The subjective image evaluation method was similar to a pre-viously described method in a recent imaging optimization stu-dy.19 All 3D FSE-Cube scans were evaluated for image quality
by two fellowship-trained musculoskeletal radiologists, who each had 9 years of experience. Readers evaluated each scan relative to the reference scan on an integer scale for image blur-ring and overall image quality. The scores, which ranged from -2 to 2, corresponded with significantly worse, slightly worse, no difference (score of zero), slightly better, and significantly better than the reference scan for each quality metric. Total sc-Table 1. Acquisition Parameter Settings for Reference Scan and Parameters for All Other Scans in the Phantom Study, Using 3D FSE-Cube Imaging with 1.5T MRI
Parameter Reference Ranges
Minimum Maximum TR (ms) 1300 1000 1100 1200 1300 ETL 30 30 45 60 rBW (kHz) 50 NEX 0.5 ACC 1.74 TE (ms) 30 Matrix size 320×320 FOV (mm) 160×160 Slice thickness (mm)* 0.5
3D FSE-Cube, three-dimensional fast spin-echo; TR, repetition time; ETL, echo train length; rBW, receiver bandwidth; NEX, number of excitations; ACC, accelera-tion factor; TE, echo time; FOV, field of view.
ores for each scan, given by the two readers, ranged from -8 to 8. Images with a score of -1 or above were regarded as acceptable. Signal-to-noise ratio (SNR) and SNR per unit time (minute) were measured in patellar cartilage and femoral bone marrow on the sagittal image of each sequence, to serve as an objec-tive measure of image quality. Regions of interest were placed in the center area of lateral patellar cartilage and distal femo-ral epiphyseal bone marrow.
Selection of optimized scan parameters was performed in the following order: 1) higher image quality (score of 2 or above) than the reference scan on subjective evaluation or 2) similar image quality (score of -1 or above) relative to the reference scan on subjective image evaluation and highest SNR per unit time. Imaging of patients
After determining optimized scan parameters based on phan-tom imaging, knee MR imaging was performed in patients with knee pain by using a protocol, consisting of 2D FSE se-quences, optimized 3D Cube-FS, and optimized 3D FSE-Cube-NFS sequences, between September 2015 and Decem-ber 2015. Two of the 126 patients who underwent knee MRI during this period were excluded due to severe motion artifacts. The remaining 124 patients included 52 men and 72 women, with an age range of 11−91 years (mean, 46.1 years). Twenty-five subsequent arthroscopic surgeries were done in these pa-tients. Time interval between knee MRI and arthroscopic sur-gery was 0−32 days, with an average of 6.4 days.
2D FSE sequences routinely included axial T1-weighted im-aging, sagittal T2-weighted imaging (T2WI), axial fat-sup-pressed T2WI, and coronal fat-supfat-sup-pressed T2WI. Details of scan parameters are described in Table 2.
The 3D FSE-Cube sequences were obtained by using a 2D auto-calibrating parallel imaging reconstruction technique (ARC; GE Healthcare). Sagittal 3D FSE-Cube isotropic source data were used to create coronal and axial reformatted images
of the knee joint. Image post-processing was performed by a MRI technologist on MRI console (GE Healthcare), immediate-ly after MRI scan.
This retrospective study was approved by the Institutional Ethics Review Board. Informed patient consent was not re-quired.
Review of patient imaging
All MR images were independently reviewed at a separate workstation by the two abovementioned readers, who were blinded to the radiologic reports of knee MRI and results of ar-throscopic surgery.
During the first review session, readers only evaluated the 3D FSE-Cube-FS images of each patient for the presence or ab-sence of ligament tear, meniscus tear, subchondral bone mar-row edema (BME) lesions, and cartilage defect by using a pic-ture archiving and communication system (PACS). At the second review session, readers only evaluated the 3D FSE-Cube-NFS images of each patient after two weeks, in order to minimize recall and learning bias.
The arthroscopic surgical findings were regarded as refer-ence for cruciate ligament tear, meniscus tear, and cartilage defect. Arthroscopic surgeries were performed by an orthope-dic surgeon with 17 years of experience. For medial collateral ligament (MCL) tear and BME lesions, the two readers estab-lished a reference in consensus, by using all routine 2D and optimized 3D images with clinical information. MCL tear was defined as a complete discontinuity or blurring of the ligament fibers, and BME lesion was defined as a high signal intensity lesion on fat-suppressed T2-weighted images involving sub-chondral bone of the knee joint. Lateral collateral ligament (LCL) tear was not included in this study due to no patient in-volvement. For tears of anterior cruciate ligament (ACL), pos-terior cruciate ligament (PCL), and MCL, a partial tear was also considered a true tear and was not distinguished from a com-Table 2. Acquisition Parameter Settings for Routine Knee MRI of Patients
Parameter
Sequence
Axial T1WI Sagittal T2WI Axial FS T2WI Coronal FS T2WI Optimized 3D FSE-Cube-FS and optimized 3D FSE-Cube-NFS TR (ms) 533 4000 4600 4500 1300† TE (ms) 12 78 72 79 30 ETL 4 14 15 15 45† rBW (kHz) 31 31 35 35 50 NEX 1 2 2 2 0.5 Matrix size 256×256 480×256 288×256 480×256 320×320 FOV (mm) 150 160 150 160 160 Slice thickness (mm) 4 4 4 4 0.5*
Scan time (min) 1:56 2:48 2:52 2:47 3:52 each
TR, repetition time; TE, echo time; ETL, echo train length; rBW, receiver bandwidth; NEX, number of excitations; FOV, field of view; T1WI, T1-weighted imaging; T2WI, T2-weighted imaging; 3D FSE-Cube-FS, three-dimensional fast spin-echo with fat suppression; 3D FSE-Cube-NFS, three-dimensional fast spin-echo with-out fat suppression.
*0.5-mm-slice-thickness isovoxel imaging was reformatted with interpolation after 1.6-mm-slice-thickness scanning, †Optimized parameters were results from
plete tear. Meniscus tear was defined as increased intrameni-scal signal intensity extending to the superior or inferior menis-cal surface.20,21 Types of meniscus tears, such as vertical or radial
tears, were not considered in this study. Specifying the location of meniscus tear enabled comparison to the arthroscopic sur-gical report.
BME lesions and cartilage defect were evaluated at each segment, including the medial femoral condyle, medial tibial
plateau, lateral femoral condyle, lateral tibial plateau, patella, and femoral trochlea. Readers graded cartilage lesions by using a modified Noyes classification system (grade 0=normal carti-lage; grade 1=increased T2 signal intensity of morphologically normal cartilage; grade 2A=superficial partial-thickness carti-lage lesion <50% of the total thickness of the articular surface; grade 2B=deep partial-thickness cartilage lesion >50% of the total thickness of the articular surface; and grade
3=full-thick-1 0 -1 -2 -3 -4 -5 -6 -7 -8 40 30 20 10 0 25 20 15 10 5 0 Score
SNR per minute SNR per minute
900 1000 1100 1200 1300 1400 3D FSE-Cube-FS of phantom TR TR/ETL 30 ETL 45 ETL 60 ETL 1 0 -1 -2 -3 -4 -5 -6 -7 -8 Score 900 1000 1100 1200 1300 1400 3D FSE-Cube-NFS of phantom TR TR/ETL 30 ETL 45 ETL 60 ETL 1200/45 1100/30 1200/30 1300/30 1300/45 Cartilage SNR per minute
FS NFS
1200/45
1100/30 1200/30 1300/30 1300/45 Bone SNR per minute
FS NFS
A B
C D
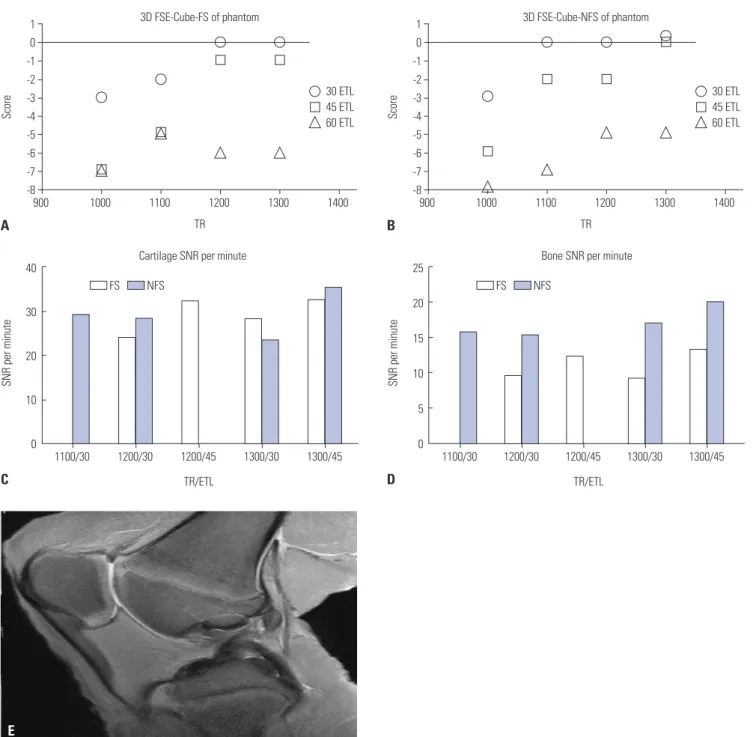
Fig. 1. Subjective scores of phantom imaging (A) with fat suppression and (B) without fat suppression. Images with a score of -1 or above were re-garded as acceptable. Highest SNRs per unit time were acquired with scan parameters of TR=1300 ms and ETL=45 in both FS and NFS images with parameter settings of acceptable image quality, measured in the (C) patellar cartilage and (D) femoral epiphyseal bone marrow. (E) 3D FSE-Cube-NFS phantom image with optimized parameters. 3D FSE-Cube-FS, three-dimensional fast spin-echo with fat suppression; 3D FSE-Cube-NFS, three-dimen-sional fast spin-echo without fat suppression; SNR, signal-to-noise ratio; TR, repetition time; ETL, echo train length.
ness cartilage lesion).22-25
After the image review sessions, readers tried to evaluate the merits of additionally obtained 3D FSE-Cube-NFS images. Statistical analysis
Interobserver agreement rates were tested by non-weighted kappa (k) statistics. A k-value of 0.0−0.20 indicated slight, 0.21− 0.40 indicated fair, 0.41−0.60 indicated moderate, 0.61−0.80 indicated good, and 0.81−1.00 indicated excellent interobserver agreement.26 McNemarar test was used to determine any
sig-nificant difference between the diagnostic performances of 3D FSE-Cube-NFS and 3D FSE-Cube-FS images for detection of knee lesions, which included ligament tears, meniscus tears, cartilage lesions, or BME lesions. A p-value less than 0.05 indi-cated statistical significance.
RESULTS
Scan parameter optimization by phantom imaging Results of phantom imaging evaluation by readers are shown in Fig. 1. Image quality and SNR increased with longer TR and shorter ETL; therefore, no images had higher scores than the reference scan in subjective image evaluation. Three parameter settings, each with acceptable image quality (score -1 or above), were noted in FS (TR and ETL: 1200 ms and 30, 1200 ms and 45, and 1300 ms and 45) and NFS sequences (TR and ETL: 1100 ms and 30, 1200 ms and 30, and 1300 ms and 45), except for the reference scan. Among these settings, including the refer-ence scan, parameter setting with the highest SNR per unit time was TR=1300 ms and ETL=45 in both FS and NFS sequences. Interpretation of patient imaging
The 25 arthroscopic surgeries revealed three ACL tears, one PCL tear, 17 medial meniscus (MM) tears, and six lateral me-niscus (LM) tears. Moreover, 88 segments of cartilage defect were found among 150 segments of the 25 knee joints. There
were no statistically significant differences between 3D FSE-Cube-NFS and 3D FSE-Cube-FS sequences for the detection of meniscus tear and cartilage defect. Imaging of the 124 pa-tients with knee pain showed that 3D FSE-Cube-NFS had lower sensitivity for detection of MCL tear (p<0.001), and lower sensi-tivity and specificity for detection of subchondral BME lesions (p<0.001), in comparison to 3D FSE-Cube-FS (Table 3). Sensi-tivity and specificity of sequences for the detection of cartilage defect lesions according to grades are shown in Table 4.
Interobserver agreement rates with unweighted kappa are shown in Table 5. Overall, 3D FSE-Cube-NFS showed worse interobserver agreement compared to 3D FSE-Cube-FS. When assessing MM and LM tears, FS imaging showed excellent and good interobserver agreement, respectively, whereas NFS im-aging showed moderate and fair interobserver agreement, re-spectively. For ACL tear or cartilage defect lesion, slightly bet-ter inbet-terobserver agreement rates were seen in FS imaging than in NFS imaging. For MCL tear, moderate interobserver agree-ment rate was seen in both FS and NFS imaging. However, for BME lesions, while moderate interobserver agreement was seen in FS imaging, only fair interobserver agreement was seen in NFS imaging. Fair interobserver agreement was seen both in FS and NFS imaging for the detection of cartilage defect le-sions.
DISCUSSION
Although a previous paper has mentioned the lack of research on the diagnostic performance of isotropic 3D FSE-Cube-NFS imaging in knee MRI as a study limitation, no previous study has yet compared the diagnostic performance of FS and NFS imaging on 1.5T MRI.8 Therefore, this study dealt with the core
keyword “without fat suppression.” We wondered if isotropic 3D FSE-Cube-NFS imaging would show higher diagnostic performance than 3D FSE-Cube-FS imaging in some clinical situations, such as ligament injury, meniscus tear, BME lesion, Table 3. Diagnostic Performance of 3D FSE-Cube-FS and 3D FSE-Cube-NFS for Detection of Knee Joint Lesions
Knee lesion Sensitivity (%) Specificity (%) Accuracy (%)
Cube-FS Cube-NFS Cube-FS Cube-NFS Cube-FS Cube-NFS
ACL tear (n=3/25) 66.7 66.7 [p=NA] 86.4 88.6 [p=0.564] 84.0 86.0
PCL tear (n=1/25) 0 50.0 [p=NA] 93.8 91.7 [p=NA] 90.0 90.0
MM tear (n=17/25) 94.1 85.3 [p=0.083] 81.3 75.0 [p=0.655] 90.0 82.0
LM tear (n=6/25) 100 83.3 [p=0.157] 79.0 73.7 [p=0.157] 84.0 76.0
Cartilage lesions (n=88/150) 75.6 75.0 [p=0.857] 43.6 34.7 [p=0.063] 62.3 58.3
MCL tear (n=16/124) 65.6 25.0 [p<0.001]* 97.7 93.1 [p=0.257] 93.6 89.5
BME lesions (n=205/744) 60.2 45.6 [p<0.001]* 98.3 94.3 [p<0.001]* 87.8 80.9
3D FSE-Cube-FS, three-dimensional fast spin-echo with fat suppression; 3D FSE-Cube-NFS, three-dimensional fast spin-echo without fat suppression; ACL, an-terior cruciate ligament; PCL, posan-terior cruciate ligament; MM, medial meniscus; LM, lateral meniscus; MCL, medial collateral ligament; BME, bone marrow edema; NA, not applicable.
Figures represent combined data from independent reviews of the two readers; data in brackets are p-values for comparison of the two imaging techniques. *p<0.05 indicates a significant difference.
or cartilage defect. This might be attributed to our line of thought that low signal intensity of ligaments or menisci, as well as high signal intensity of adjacent fat, might contribute to better tissue contrast in NFS imaging than in FS imaging. However, the re-sults of this study showed that 3D FSE-Cube-NFS has similar or inferior diagnostic performance in all clinical settings, com-pared to 3D FSE-Cube-FS. We believe the main reason for this finding was the lack of tissue contrast increase due to the for-mation of a fluid signal in the ligament or meniscus when a pa-thologic lesion appears. Representatively, in the case of MCL tears, a signal increase in the surrounding soft tissue was use-ful for diagnosing the tear, except for blurring or discontinuity of the ligament itself. Nevertheless, signal abnormality in the surrounding soft tissue was poorly visible in NFS images; there-fore, 3D FSE-Cube-NFS showed much lower sensitivity for the detection of MCL tears (p<0.001) (Fig. 2).
Our review of 17 cases of MM tears in this study proved the utility of 3D FSE-Cube-NFS imaging at diagnosing MM tears, as both readers showed high accuracy rates of more than 80%. However, compared to FS imaging, NFS imaging had p-values between 0.05 and 0.1 for sensitivity and specificity for the di-agnosis of MM tears or cartilage defect lesions. We strongly be-lieve that a future study using a larger subject group would show statistically significant differences.
Based on the arthroscopic surgical findings of 25 patients, 3D FSE-Cube-FS and 3D FSE-Cube-NFS imaging sequences had similar diagnostic accuracy for the detection of ACL tears, MM tears, LM tears, and cartilage lesions. Judging from these results, it is possible that 3D FSE-Cube-NFS can replace 3D FSE-Cube-FS imaging for the detection of such pathologies.
However, the analysis of images of all 124 patients who under-went knee MRI showed different results regarding MCL tears or BME lesions, suggesting that 3D FSE-Cube-NFS imaging might not to be able to replace 3D FSE-Cube-FS imaging in the listed clinical situations. In particular, for subchondral BME lesions, relatively more false-positive cases (61 false-positive segments in all 1078 negative segments) were noted due to subchondral sclerosis or cortical irregularity mimicking BME lesions (Fig. 3).
Only fair interobserver agreement was observed in both FS and NFS imaging for the detection of cartilage defect lesions, which was relatively worse than the agreement for other knee lesions. Such finding may be attributed to the difficulty in dis-tinguishing cartilage defect grade 0 from grade 1 in those im-ages. This can be explained by the result given in Table 4, which shows that sensitivity of the sequences for grade 1 cartilage defect lesion is much worse than that for high-grade lesions. Another reason is that one of the two reviewers was not familiar with 1.5T MRI images than those of 3.0T MRI. The relatively lower diagnostic accuracy for cartilage defect lesion in this study can also be understood in the same context, as compared to the previous study.9
Although 3D FSE-Cube-NFS imaging was not superior to 3D FSE-Cube-FS imaging with statistical significance in all clinical settings, there were some advantages to the additionally ob-tained 3D FSE-Cube-NFS sequence during the radiologic read-ing practice (Figs. 4, 5, and 6).
First, if a patient’s knee had surgical prosthesis, NFS images showed a relatively weaker susceptibility artifact (Fig. 4). For comparing the severity of artifacts, maximal areas of metal ar-tifact posterior to proximal tibial cortex in each sagittal image were measured and compared between FS and NFS images. Two out of 124 patients had previously undergone ACL recon-struction surgery. Average values of maximal area of metal ar-tifact applied to these patients were 95.51 cm2 in 3D
FSE-Cube-FS imaging and 53.07 cm2 in 3D FSE-Cube-NFS imaging.
Al-though this topic was not mainly considered in our study due to a small postoperative patient group, such result suggests the possibility that 3D FSE-Cube-NFS could be more useful than 3D FSE-Cube-FS imaging in patients with surgical prosthesis.
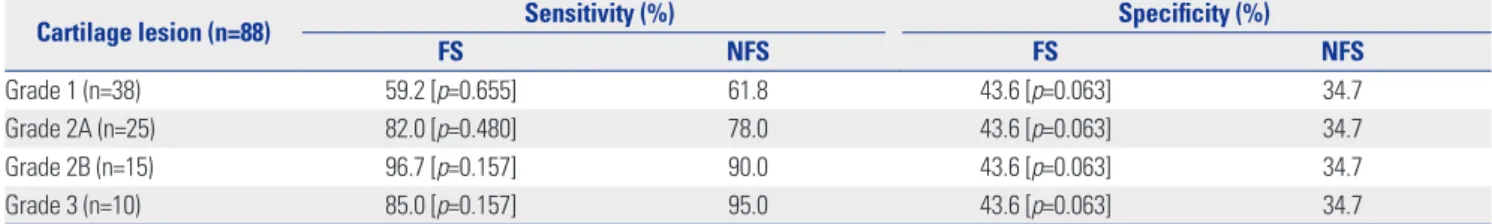
Second, 3D FSE-Cube-NFS images may be more helpful if there were artifacts during prior 3D FSE-Cube-FS imaging (Fig. 5). Therefore, acquisition of an additional 3D FSE-Cube-NFS Table 4. Sensitivity and Specificity of 3D FSE-Cube-FS and 3D FSE-Cube-NFS for Detection of Cartilage Lesions
Cartilage lesion (n=88) Sensitivity (%) Specificity (%)
FS NFS FS NFS
Grade 1 (n=38) 59.2 [p=0.655] 61.8 43.6 [p=0.063] 34.7
Grade 2A (n=25) 82.0 [p=0.480] 78.0 43.6 [p=0.063] 34.7
Grade 2B (n=15) 96.7 [p=0.157] 90.0 43.6 [p=0.063] 34.7
Grade 3 (n=10) 85.0 [p=0.157] 95.0 43.6 [p=0.063] 34.7
3D FSE-Cube-FS, three-dimensional fast spin-echo with fat suppression; 3D FSE-Cube-NFS, three-dimensional fast spin-echo without fat suppression. Data in brackets are p-values for comparison of the two imaging techniques.
Table 5. Interobserver Agreement Rates with Unweighted Kappa
Knee lesion 3D FSE-Cube-FS 3D FSE-Cube-NFS
ACL tear (n=3) 0.750 0.595 MM tear (n=17) 0.905 0.403 LM tear (n=6) 0.675 0.371 Cartilage lesions (n=88) 0.264 0.213 MCL tear (n=16) 0.571 0.586 BME lesions (n=205) 0.508 0.301
3D FSE-Cube-FS, three-dimensional fast spin-echo with fat suppression; 3D FSE-Cube-NFS, three-dimensional fast spin-echo without fat suppression; ACL, anterior cruciate ligament; MM, medial meniscus; LM, lateral menis-cus; MCL, medial collateral ligament; BME, bone marrow edema.
image might sometimes lead to a more accurate diagnosis of knee lesions, which may not be possible by using 3D FSE-Cube-FS image alone.
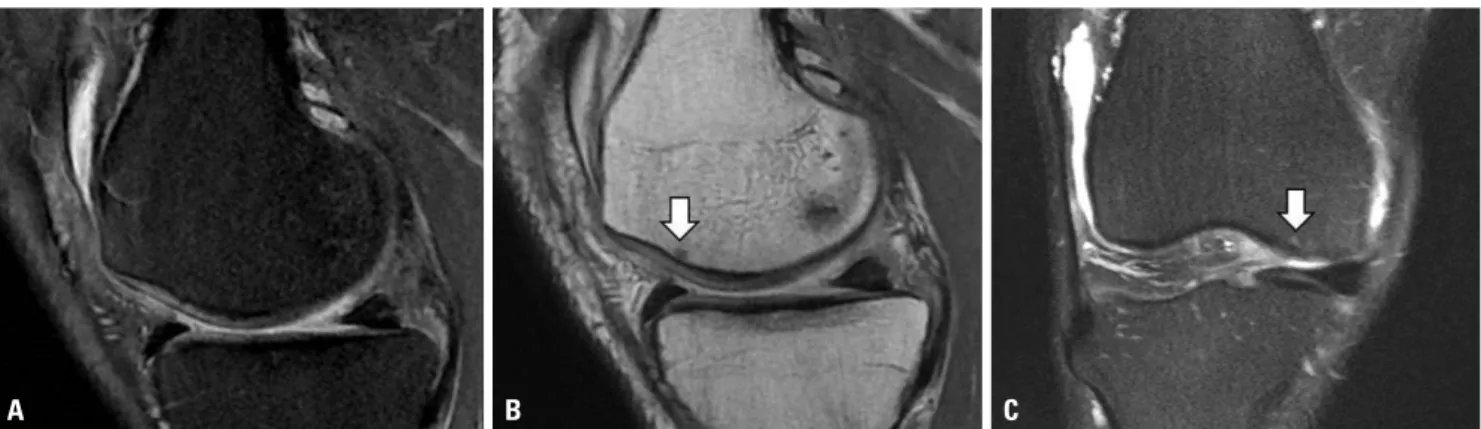
Third, some cases of subtle BME lesions could be more visi-ble on 3D FSE-Cube-NFS imaging than on 3D FSE-Cube-FS imaging (Fig. 6). Since the reason for this is not yet clear, further research is warranted in the future. Nevertheless, such cases were not frequent enough to be statistically significant.
Due to these advantages of 3D Cube-NFS over 3D FSE-Cube-FS, future studies should further explore the diagnostic values of adding 3D FSE-Cube-NFS images to the routine knee MRI protocol.
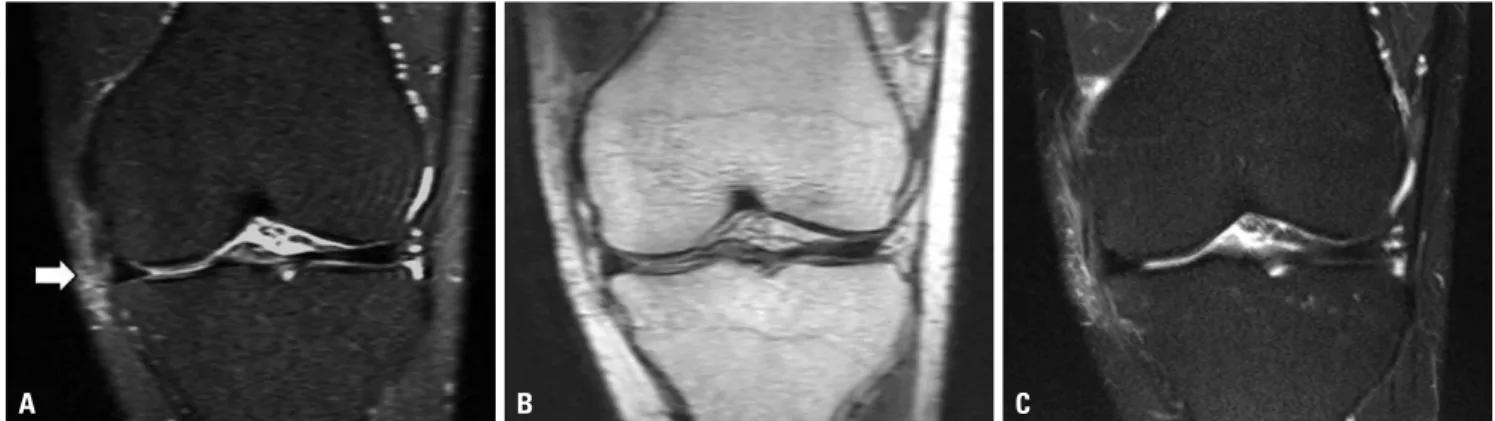
Limitations of this study are as follows. First, since the readers were more familiar with FS images, a relative underestimation of diagnostic accuracy may have occurred for the less familiar 3D FSE-Cube-NFS images. This could be the reason behind the inferior scores of diagnostic performance and interobserver agreements of 3D FSE-Cube-NFS images. Second, due to the small patient group, evaluation of PCL or LCL tears could not Fig. 2. (A) Blurring of MCL fibers in addition to an increase in signal intensity of surrounding soft tissue are seen on the coronal reformatted 3D FSE-Cube-FS image (arrow). (B) Blurring of ligament fiber is not definite, and no signal abnormality in surrounding soft tissue is detected on the coronal reformatted 3D Cube-NFS image. (C) Conventional 2D coronal T2-weighted image reveals MCL tear. MCL, medial collateral ligament; 3D FSE-Cube-FS, three-dimensional fast spin-echo with fat suppression; 3D FSE-Cube-NFS, three-dimensional fast spin-echo without fat suppression.
A B C
A B
Fig. 4. (A) Metal artifact posterior to the proximal tibial cortex in 3D FS image. (B) Greatly reduced artifact is noted in 3D FSE-Cube-NFS image (arrow). Posterior tibial cortex margin is well-demarcated in this sequence. 3D FSE-Cube-FS, three-dimensional fast spin-echo with fat suppression; 3D FSE-Cube-NFS, three-dimensional fast spin-echo without fat suppression.
A B
Fig. 5. (A) Artifact during 3D FSE-Cube-FS imaging. It is impossible to know whether there is a tear in the LM (arrow). (B) Subsequent 3D FSE-Cube-NFS image shows a normal meniscus. 3D FSE-Cube-FS, three-di-mensional fast spin-echo with fat suppression; 3D FSE-Cube-NFS, three-dimensional fast spin-echo without fat suppression; LM, lateral meniscus.
A B
Fig. 3. (A) 3D FSE-Cube-NFS image shows a suspicious subchondral BME lesion on the posterolateral tibial plateau (arrow), while (B) 3D FSE-Cube-FS image shows a subchondral sclerotic change. After cor-relation with 2D imaging, it turned out to be a false-positive lesion. 3D FSE-Cube-FS, three-dimensional fast spin-echo with fat suppression; 3D FSE-Cube-NFS, three-dimensional fast spin-echo without fat sup-pression; 2D, two-dimensional.
be performed. Third, since only a few patients with surgical pro-sthesis of the knee were included, advantages of NFS imaging in this patient group were not statistically investigated. Limita-tions of the small subject group in this study can be overcome through further studies using larger groups. Fourth, this study was conducted using only a 1.5T MRI system, and results could be different with a 3.0T MRI system. Further studies using a 3.0T MRI system are needed in the future.
In conclusion, considering both acceptable image quality and short scan time, optimized scan parameters for both 3D FSE-Cube FS and 3D FSE-Cube NFS were TR=1300 ms and ETL=45. 3D FSE-Cube-NFS showed similar sensitivity and spe-cificity for detection of meniscus tears or cartilage defects, lower sensitivity for detection of MCL tears, and lower sensitivity and specificity for detection of BME lesions, in comparison to 3D Cube-FS. In some clinical situations, additional 3D FSE-Cube-NFS offers considerable advantages such as reduced susceptibility artifact, ability for replacing inappropriate 3D-FSE-Cube-FS images, and detection of subtle BME lesions.
ACKNOWLEDGEMENTS
This work was supported by a National Research Foundation (NRF) grant funded by South Korea’s Ministry of Science, ICT & Future Planning (MSIP, 2015R1A2A1A05001887).
REFERENCES
1. Mackenzie R, Dixon AK, Keene GS, Hollingworth W, Lomas DJ, Villar RN. Magnetic resonance imaging of the knee: assessment of effectiveness. Clin Radiol 1996;51:245-50.
2. Gold GE, Busse RF, Beehler C, Han E, Brau AC, Beatty PJ, et al. Iso-tropic MRI of the knee with 3D fast spin-echo extended echo-train acquisition (XETA): initial experience. AJR Am J Roentgenol 2007; 188:1287-93.
3. Kijowski R, Blankenbaker DG, Woods M, Del Rio AM, De Smet AA, Reeder SB. Clinical usefulness of adding 3D cartilage imaging sequences to a routine knee MR protocol. AJR Am J Roentgenol 2011;196:159-67.
4. Kijowski R, Davis KW, Woods MA, Lindstrom MJ, De Smet AA, Gold GE, et al. Knee joint: comprehensive assessment with 3D isotropic resolution fast spin-echo MR imaging--diagnostic perfor-mance compared with that of conventional MR imaging at 3.0 T. Radiology 2009;252:486-95.
5. Jung JY, Jee WH, Park MY, Lee SY, Kim JM. Meniscal tear configura-tions: categorization with 3D isotropic turbo spin-echo MRI com-pared with conventional MRI at 3 T. AJR Am J Roentgenol 2012; 198:W173-80.
6. Jung JY, Yoon YC, Kim HR, Choe BK, Wang JH, Jung JY. Knee de-rangements: comparison of isotropic 3D fast spin-echo, isotropic 3D balanced fast field-echo, and conventional 2D fast spin-echo MR imaging. Radiology 2013;268:802-13.
7. Jung JY, Yoon YC, Kwon JW, Ahn JH, Choe BK. Diagnosis of inter-nal derangement of the knee at 3.0-T MR imaging: 3D isotropic in-termediate-weighted versus 2D sequences. Radiology 2009;253: 780-7.
8. Lim D, Han Lee Y, Kim S, Song HT, Suh JS. Clinical value of fat-sup-pressed 3D volume isotropic spin-echo (VISTA) sequence com-pared to 2D sequence in evaluating internal structures of the knee. Acta Radiol 2016;57:66-73.
9. Ai T, Zhang W, Priddy NK, Li X. Diagnostic performance of CUBE MRI sequences of the knee compared with conventional MRI. Clin Radiol 2012;67:e58-63.
10. Kijowski R, Davis KW, Blankenbaker DG, Woods MA, Del Rio AM, De Smet AA. Evaluation of the menisci of the knee joint using three-dimensional isotropic resolution fast spin-echo imaging: di-agnostic performance in 250 patients with surgical correlation. Skeletal Radiol 2012;41:169-78.
11. Ristow O, Steinbach L, Sabo G, Krug R, Huber M, Rauscher I, et al. Isotropic 3D fast spin-echo imaging versus standard 2D imaging at 3.0 T of the knee--image quality and diagnostic performance. Eur Radiol 2009;19:1263-72.
12. Duc SR, Pfirrmann CW, Koch PP, Zanetti M, Hodler J. Internal knee derangement assessed with 3-minute three-dimensional isovoxel true FISP MR sequence: preliminary study. Radiology 2008;246: 526-35.
13. Lim D, Lee YH, Kim S, Song HT, Suh JS. Fat-suppressed volume isotropic turbo spin echo acquisition (VISTA) MR imaging in eval-uating radial and root tears of the meniscus: focusing on reader-defined axial reconstruction. Eur J Radiol 2013;82:2296-302. 14. Delfaut EM, Beltran J, Johnson G, Rousseau J, Marchandise X,
Cot-ten A. Fat suppression in MR imaging: techniques and pitfalls. Ra-diographics 1999;19:373-82.
Fig. 6. (A) No definite subchondral bone marrow signal change is seen in the medial femoral condyle in 3D FSE-Cube-FS image. (B) A small suspicious low signal intensity lesion is seen in the subsequent 3D FSE-Cube-NFS image (arrow). (C) Conventional 2D coronal T2-weighted image reveals a tiny subchondral BME lesion in the medial femoral condyle (arrow). 3D Cube-FS, three-dimensional fast spin-echo with fat suppression; 3D FSE-Cube-NFS, three-dimensional fast spin-echo without fat suppression; 2D, two-dimensional.
15. Cho KE, Yoon CS, Song HT, Lee YH, Lim D, Suh JS, et al. Quantita-tive assessment and ligament traceability of volume isotropic tur-bo spin echo acquisition (VISTA) ankle magnetic resonance imag-ing: fat suppression versus without fat suppression. J Korean Soc Magn Reson Med 2013;17:110-22.
16. Schäfer FK, Schäfer PJ, Brossmann J, Frahm C, Hilgert RE, Heller M, et al. Value of fat-suppressed proton-density-weighted turbo spin-echo sequences in detecting meniscal lesions: comparison with arthroscopy. Acta Radiol 2006;47:385-90.
17. Lee JH, Yoon YC, Park KJ, Wang JH. Diagnosis of internal derange-ment of the knee: volume isotropic turbo spin-echo acquisition MRI with fat suppression versus without fat suppression. AJR Am J Roentgenol 2017;208:1304-11.
18. Lee SY, Jee WH, Kim SK, Kim JM. Proton density-weighted MR imaging of the knee: fat suppression versus without fat suppres-sion. Skeletal Radiol 2011;40:189-95.
19. Li CQ, Chen W, Rosenberg JK, Beatty PJ, Kijowski R, Hargreaves BA, et al. Optimizing isotropic three-dimensional fast spin-echo meth-ods for imaging the knee. J Magn Reson Imaging 2014;39:1417-25. 20. De Smet AA, Norris MA, Yandow DR, Quintana FA, Graf BK, Keene
JS. MR diagnosis of meniscal tears of the knee: importance of high signal in the meniscus that extends to the surface. AJR Am J
Roent-genol 1993;161:101-7.
21. De Smet AA, Tuite MJ, Norris MA, Swan JS. MR diagnosis of menis-cal tears: analysis of causes of errors. AJR Am J Roentgenol 1994; 163:1419-23.
22. Bredella MA, Tirman PF, Peterfy CG, Zarlingo M, Feller JF, Bost FW, et al. Accuracy of T2-weighted fast spin-echo MR imaging with fat saturation in detecting cartilage defects in the knee: com-parison with arthroscopy in 130 patients. AJR Am J Roentgenol 1999;172:1073-80.
23. Potter HG, Linklater JM, Allen AA, Hannafin JA, Haas SB. Mag-netic resonance imaging of articular cartilage in the knee. An eval-uation with use of fast-spin-echo imaging. J Bone Joint Surg Am 1998;80:1276-84.
24. Sonin AH, Pensy RA, Mulligan ME, Hatem S. Grading articular car-tilage of the knee using fast spin-echo proton density-weighted MR imaging without fat suppression. AJR Am J Roentgenol 2002; 179:1159-66.
25. Noyes FR, Stabler CL. A system for grading articular cartilage le-sions at arthroscopy. Am J Sports Med 1989;17:505-13.
26. Seigel DG, Podgor MJ, Remaley NA. Acceptable values of kappa for comparison of two groups. Am J Epidemiol 1992;135:571-8.