End plate and degenerative disc disease
Asian Spine Journal
Asian Spine Journal
405Copyright Ⓒ 2014 by Korean Society of Spine Surgery
This is an Open Access article distributed under the terms of the Creative Commons Attribution Non-Commercial License (http://creativecommons.org/licenses/by-nc/3.0/) which permits unrestricted non-commercial use, distribution, and reproduction in any medium, provided the original work is properly cited.
Asian Spine Journal • pISSN 1976-1902 eISSN 1976-7846 • www.asianspinejournal.org
Received Sep 2, 2013; Revised Oct 13, 2013; Accepted Oct 21, 2013 Corresponding author: Daniel F Fouladi
Drug Applied Research Center, Tabriz University of Medical Sciences, Daneshgah Street, Pashmineh Building, Postal Code 5157658581, Tabriz, Iran Tel: +98-9144122542, Fax: +98-4113363231, E-mail: Medicorelax@yahoo.com
End Plate Disproportion and Degenerative Disc Disease: A Case-Control Study
Masoud Poureisa
1, Mohammad Hossein Daghighi
1, Sepideh Mesbahi
1, Amir Hagigi
2, Daniel F Fouladi
31Department of Radiology and Neuroscience Research Center, Tabriz University of Medical Sciences, Tabriz, Iran
2Department of Radiology and Nuclear Medicine, Keck Scholl of Medicine, University of Southern California, Los Angeles, CA, USA
3Drug Applied Research Center, Tabriz University of Medical Sciences, Tabriz, Iran
Study Design: Case-control.
Purpose: To determine whether a disproportion between two neighboring vertebral end plates is associated with degenerative disc disease.
Overview of Literature: Recently, it has been suggested that disproportion of the end plates of two adjacent vertebrae may in- crease the risk of disc herniation.
Methods: Magnetic resonance (MR) images (n=160) with evidence of grades I–II lumbar degenerative disc disease (modified Pfir- rmann’s classification) and normal MR images of the lumbar region (n=160) were reviewed. On midsagittal sections, the difference of anteroposterior diameter of upper and lower end plates neighboring a degenerated (in the case group) or normal (in the control group) intervertebral disc was calculated (difference of end plates [DEP]).
Results: Mean DEP was significantly higher in the case group at the L5–S1 level (2.73±0.23 mm vs. 2.21±0.12 mm, p=0.03). Differ- ences were not statistically significant at L1–L2 (1.31±0.13 mm in the cases vs. 1.28±0.08 mm in the controls, p=0.78), L2–L3 (1.45±0.12 mm in the cases vs. 1.37±0.08 mm in the controls, p=0.58), L3–L4 (1.52±0.13 mm in the cases vs. 1.49±0.10 mm in the controls, p=0.88), and L4–L5 (2.15±0.21 mm in the cases vs. 2.04±0.20 mm in the controls, p=0.31) levels. The difference at the L5–S1 level did not remain significant after adjusting for body mass index (BMI), which was significantly higher in the patients.
Conclusions: End plate disproportion may be a significant, BMI-dependent risk factor for lumbar degenerative disc disease.
Keywords: Vertebra; Anatomy; Intervertebral disc degeneration
Clinical Study Asian Spine J 2014;8(4):405-411 • http://dx.doi.org/10.4184/asj.2014.8.4.405
ASJ A SJ
Introduction
Overall, degenerative disc disease is back pain symptoms attributable to intervertebral disc degeneration that in- cludes pathologic changes in the disc, annulus, and the end plates, with or without osteophyte formation at the vertebral apophyses [1]. These degenerative changes are among the leading causes of disability, morbidity and
socioeconomic burden all over the world. Low back pain, radiculopathy, disc herniation, alignment abnormalities, intervertebral disc displacement, and spinal stenosis are major sequelae of degenerative disc disease. As a result, there is extensive ongoing research to clarify its under- lying mechanisms and potential contributing factors [2]. Degenerative disc disease is a complex entity with many interactive ethological factors at play. Mechanical,
nutritional, traumatic, and genetic factors have all been implicated in the cascade of disc degeneration to variable degrees [2]. Increasing age, gender, higher body mass index (BMI) scores, demanding jobs/physical activities, lower bone mineral density, and genetic factors have been associated with lumbar degenerative disc disease [3-8]. In magnetic resonance imaging (MRI), which is a sensitive imaging method for the evaluation of degenerative disc disease, disc space narrowing, loss of T2-weighted signal within the nucleus pulposus, fissures, vacuum changes and calcification, endplate changes, ligamentous and/or marrow signal changes, presence of osteophytosis, and stenosis have been reported [2,9]. Based on previous data, lumbar intervertebral disc degeneration precedes degenerative diseases of the lumbar spine such as lumbar spinal canal stenosis and disc herniation [6]. Therefore, certain risk factors of disc herniation may also play a role in development of degenerative disc disease. Recently, in midsagittal sections, the difference in the anteroposterior (AP) diameter of upper and lower end plates neighbor- ing a herniated disc was shown to be a significant risk factor for lumbar disc herniation [10]. The objective of the present study was to investigate a possible connection between the end plate disproportion and lumbar degen- erative disc disease in a case-control setting.
Materials and Methods
1. Study design and participants
With approval from the ethics committee of a local university, 160 MR images of the lumbar spine in Azeri individuals with evidence of degenerative disc disease (grades I–II according to the modified Pfirrmann’s clas-
sification [6], see Table 1) were reviewed in a case-control study. For the control group, another 160 magnetic reso- nance (MR) images of normal lumbar spine in Azeri indi- viduals were used. The two groups were matched for sex and age. The studied MR images were randomly selected from the archive of another project aimed to determine normal dimensions of the spinal canal in Azeri people at three educational MRI centers from May 2009 through May 2013. The exclusion criteria were ethnicities other than Azeri, previous spinal surgery, lumbar disc hernia- tion, spondylolisthesis, severe degenerative disc disease (grades III to V [6]) (Table 1), and significant vertebral deformity resulting from any etiology.
2. MRI and measuring methods
Sagittal and axial MR T1-weighted and T2-weighted images of the lumbar spine were reviewed by two ex- perienced radiologists. A 1.5-Tesla imager (MAGNE- TOM Avanto 1.5 Tesla MRI system, Siemens, Erlangen, Germany) was used for MRI. The obtained images were stored on a picture archive and communication system that also allowed image enhancement, magnification and measurement. To measure the distance between two points, a cursor was positioned over an initial reference point. The cursor was then moved to the second refer- ence point by dragging the mouse. When the mouse but- ton was released, the distance between the two points was automatically displayed in a box. The eFilm Workstation v.2.1.2 (Merge Healthcare, Milwaukee, WI, USA) was used for this purpose. In the case group, AP diameters of the upper and lower end plates of the degenerated disc were measured on midsagittal sections, and the differ- ence of end plates (DEP) was calculated by using Excel Table 1. Classification of degenerative disc disease [6]
Grade Nucleus pulposus
Distinction of nucleus and annulus Signal intensitya) Structure
I Hyperintense/isointense Homogeneous Clearly present
II Hyperintense/isointense Inhomogeneous Clearly present
III Intermediate Inhomogeneous -
IV Hypointense Inhomogeneous -
V Black Inhomogeneous -
a)Compared to the cerebrospinal fluid.
software (Office 2003, Microsoft Co., Redmond, WA, USA) (Fig. 1) [10]. The measurements included the end plates of lower L1 and upper L2 (L1–L2), lower L2 and upper L3 (L2–L3), lower L3 and upper L4 (L3–L4), lower L4 and upper L5 (L4–L5), and lower L5 and upper S1 (L5–
S1) [10]. Similar measurements were made at all levels of the lumbar spine in the control group. The DEP of cases with lumbar degenerative disc disease and controls was compared at similar levels of the lumber spine. For the purpose of blinding, an observer unaware of the objective of this work performed the measurements, first in the control group. To assess measurement errors, the upper and lower diameters of end plates at L4–L5 level in 25 cases and 25 controls selected randomly were measured on two consecutive days by the same single observer who performed the measurements. A skilled radiologist per- formed all DEP measurements. Data from the two sets of measurements were compared. For the upper AP diam- eter of the end plates, the mean difference was 0.05 mm with a standard deviation of the difference of 0.002 mm.
For the lower AP diameter of the end plates, they were 0.04 mm and 0.001 mm, respectively. The limits of agree- ments were within 5% of the mean value [11].
The inter-observer agreement was “almost perfect”
between the two radiologists in terms of diagnosis and classification of degenerative disc disease (Cohen’s kap-
pa=0.91) [12].
3. Sample size calculation and statistical analysis According to the results of a similar study [10], to obtain 80% power and detect a difference of DEP at the level of L5–S1=0.5 mm at alpha=0.05, 151 cases were needed in each group; this was augmented to 160 cases for this study.
The SPSS ver. 19.0 (IBM Co., Armonk, NY, USA) was used for statistical comparisons. The chi-square (χ²) and Independent samples t tests were used to compare the data. The logistic regression test was performed for multivariate analysis. The inter-observer agreement in diagnosis and classification of degenerative disc disease was analyzed using Cohen’s kappa statistics. Repeatability was evaluated using Bland and Altman’s mean difference technique. A significance level of p≤0.05 was used.
Results
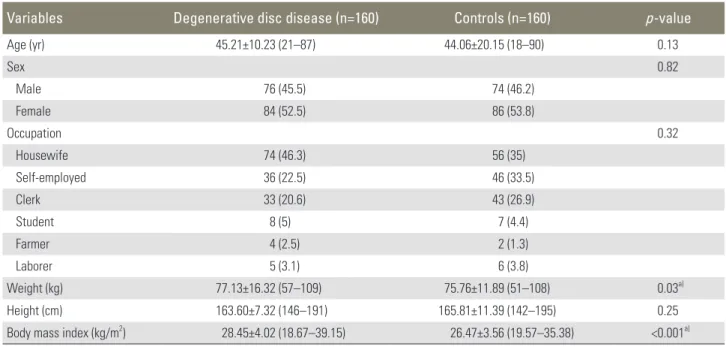
Demographics of the study population are summarized in Table 2. The two groups were comparable in terms of age at the time of MRI (Independent samples t test p=0.13), gender (χ² test p=0.82), occupation (χ² test p=0.32), and height (independent samples t test p=0.25). Both mean weight and BMI were significantly higher in patients than in controls (77.13±16.32 kg vs. 75.76±11.89 kg, p=0.03;
and 28.45±4.02 kg/m2 vs. 26.47±3.56 kg/m2, p<0.001, re- spectively).
Mean DEP at different vertebral levels are compared between the patients and the controls in Table 3. Com- paring the two groups, the mean DEP was significantly higher in the patients at the level of L5–S1 (2.73±0.23 mm vs. 2.21±0.12 mm, independent samples t test p=0.03).
This difference did not remain significant after the two groups were adjusted for the participants’ BMI (logistic regression analysis p=0.24, Exp (B)=0.92).
Based on the results of the Independent samples t test, there was no significant difference between the two groups regarding the mean DEP at the other vertebral levels (Table 3).
In patients with degenerative changes at the level of L5–S1, mean AP diameters of the cranial and caudal end plates of the fifth vertebra were 38.01±0.19 mm and 37.93±0.21 mm, respectively (paired samples t test, p=0.63).
Fig. 1. A sagittal T2-weighted magnetic resonance image reconstruc- tion with measurements on the third and forth lumbar vertebrae in a normal subject.
Discussion
Based on a conventional theory, degeneration and ag- ing are similar processes occurring at different rates.
Disc degeneration usually occurs at a faster rate and involves patients of working age. Two distinct degenera- tive processes involving the intervertebral disc have been described; “spondylosis deformans,” which affects the an- nulus fibrosus and adjacent apophyses, and “intervertebral osteochondrosis”, which affects the nucleus pulposus and the end plates with or without fissuring of the annulus fibrosus. The first has been suggested to be a consequence of normal aging, but the second, or deteriorated disc, has been shown to be the result of a pathologic process [2].
Although degenerative changes in the spine are a com-
plex entity with diverse possible etiological factors, me- chanic loading has traditionally been considered a major contributor to lumbar disc degeneration. Frequent and more severe involvement of the discs in areas with the heaviest mechanical stresses, such as the lower lumbar region, bolsters this notion [2].
A ‘‘degenerative cascade’’ of the intervertebral disc was first described in three overlapping phases by Kirkaldy- Willis et al. [13]. In the beginning phase (or dysfunction phase), repetitive microtrauma leads to circumferential painful tears of the annulus, end plate separation, and a compromised state of disc nutritional supply and waste removal. Thus, end plates are pivotal in the process of spinal degeneration in terms of both facilitation and inhibition of ‘‘degenerative cascade’’ [14-17]. Located at Table 2. Demographics of the studied groups
Variables Degenerative disc disease (n=160) Controls (n=160) p-value
Age (yr) 45.21±10.23 (21–87) 44.06±20.15 (18–90) 0.13
Sex 0.82
Male 76 (45.5) 74 (46.2)
Female 84 (52.5) 86 (53.8)
Occupation 0.32
Housewife 74 (46.3) 56 (35)
Self-employed 36 (22.5) 46 (33.5)
Clerk 33 (20.6) 43 (26.9)
Student 8 (5) 7 (4.4)
Farmer 4 (2.5) 2 (1.3)
Laborer 5 (3.1) 6 (3.8)
Weight (kg) 77.13±16.32 (57–109) 75.76±11.89 (51–108) 0.03a)
Height (cm) 163.60±7.32 (146–191) 165.81±11.39 (142–195) 0.25
Body mass index (kg/m2) 28.45±4.02 (18.67–39.15) 26.47±3.56 (19.57–35.38) <0.001a) Values are presented as mean±standard deviation (range) or frequency (%).
a)A p≤0.05 is statistically significant.
Table 3. Difference of end plates at the lumbar vertebral levels in the cases with degenerative disc disease and controls
Level No. Patients No. Controls p-value
L1–L2 61 1.31±0.13 160 1.28±0.08 0.78
L2–L3 68 1.45±0.12 160 1.37±0.08 0.58
L3–L4 71 1.52±0.13 160 1.49±0.10 0.88
L4–L5 76 2.15±0.21 160 2.04±0.20 0.31
L5–S1 85 2.73±0.23 160 2.21±0.12 0.03a)
Values are presented as mean±standard error of the mean in millimeters.
a)A p≤0.05 is statistically significant.
both cranial and caudal ends of each intervertebral disc, the end plates separate the vertebral bone from the disc, prevent the nucleus from bulging into the adjacent ver- tebrae, absorb the hydrostatic pressure that results from mechanical loading of the spine, and transfer the axial load on the vertebral body to the next vertebra [18].
In a recent study [10], we showed that the difference of AP diameter of upper and lower end plates neighbor- ing a herniated disc at the levels of L4–L5 and L5–S1 on midsagittal sections was a significant risk factor for lumbar disc herniation. Since the degeneration of the intervertebral disc may lead to later disc herniation [6], this study was designed to examine the possible role of end plate disproportion in the development of degenera- tive disc disease. Based on our findings, increasing DEP was significantly higher in patients with degenerative disc disease than in controls at the level of L5–S1.
Previously, some studies reported that asymmetry in the lumbar facets were contributors to disc pathologies [19-21]. Pappou et al. [22] evaluated the possible relation- ship of end plate shape on MRI and disc degeneration in surgically treated patients with degenerative disc disease and herniated nucleus pulposus. They found a significant association between the symptoms and flat or irregular levels in both groups with degenerative disc disease or herniated nucleus pulposus.
The annular tension may be related to the end plate shape. This association indicates a possible connection between the exerted axial load on the spinal vertebra and disproportion of the end plates in the development of disc pathologies such as herniation and degeneration [23].
In patients who undergo arthroplasty, undersized devices may subject the central portion of the vertebral body to higher stresses and therefore increase the risk for implant failure [24]. Likewise, the peripheral regions of the lum- bar end plates are stronger than the central regions [25].
Therefore, when two endplates do not fully cover each other, higher loading on the weaker central portion of the vertebral body is expected. Over time, this disproportion of the end plates would initiate and/or facilitate degenera- tive changes at the same level.
Another justification for this association comes from the hypothesis of “functional adaptation.” According to this hypothesis, degenerative changes in the spine repre- sent a remodeling process that tries to adapt to the insta- bility in the demands of the spine [26]. Considering the end plate disproportion as an indicator of instability in
the spine, this hypothesis is helpful.
In the present work, the mean BMI of patients with degenerative disc disease was significantly higher than the mean BMI of controls. Although this finding con- forms with previous reports [27,28], a significant effect of BMI on the difference of the end plates between the two groups emphasizes the common role of mechanical load- ing (weight) and end plate disproportion in the develop- ment of degenerative disc disease. In addition, although the mean DEP was higher at all levels of the lumbar spine in patients than in controls, the difference reached a statistically significant level only at the lower lumbar seg- ments (L5–S1).
Based on available data, disc degeneration is more common in the lower lumbar levels, which are subjected to higher stresses [22,29]. This may explain why end plate disproportion is significant at the lower levels of the lum- bar spine compared with upper segments.
To the best of our knowledge, this is the first study that investigates the role of end plate disproportion in connec- tion with degenerative disc disease. As a result, a number of limitations were inevitable and should be acknowl- edged.
One of these limitations was possible effect of degen- erative changes on the end plates of the affected vertebrae and their dimensions. To exclude this possibility, only cases with mild degenerative disc changes (grades I–II according to the modified Pfirrmann’s classification [6]) were studied. In addition, the AP diameters of the cranial and caudal end plates of the fifth lumbar vertebrae in the cases with degenerative changes at the level of L5–S1 were compared. Insignificant difference suggested that the detected DEP was probably present before degenera- tive changes in the case group [10].
Like any other study looking at the natural history of degenerative disc disease, the current investigation may be confounded by the common morphologic changes in asymptomatic individuals [30]. By the age of 50 years, over 80% of adults show evidence of degenerative disc disease at autopsy [2]. So, it is almost impossible to claim that the control group consists of completely normal in- dividuals with no trace of degenerative changes in their spine. However, it can at least be claimed that the end plate disproportion is associated with more severe degen- erative changes of the spine in comparison with normally and routinely seen variations.
We only used the AP diameter of the end plates to as-
sess possible disproportion of two adjacent vertebrae.
This is because in a preliminary study (unpublished data), we noted that the biggest difference was present in this dimension [10]. However, the disproportion between the end plates of two neighboring vertebrae in other dimen- sions should be investigated in future studies.
Finally, in an attempt to obviate the possible influence of ethnical heterogeneity and racial differences on the fi- nal outcome of the study [5], only MR images of the lum- bar spine in Azeri individuals were used in the present work. Future studies on other racial and ethnic groups are recommended in this regard.
Conclusions
Difference of end plate appears to be a significant, weight- dependent risk factor for lumbar degenerative disc dis- ease.
Conflict of Interest
No potential conflict of interest relevant to this article was reported.
References
1. Fardon DF, Milette PC; Combined Task Forces of the North American Spine Society, American Society of Spine Radiology, and American Society of Neurora- diology. Nomenclature and classification of lumbar disc pathology: recommendations of the Combined task Forces of the North American Spine Society, American Society of Spine Radiology, and American Society of Neuroradiology. Spine (Phila Pa 1976) 2001;26:E93-113.
2. Modic MT, Ross JS. Lumbar degenerative disk dis- ease. Radiology 2007;245:43-61.
3. Buckwalter JA, Saltzman C, Brown T. The impact of osteoarthritis: implications for research. Clin Orthop Relat Res 2004;(427 Suppl):S6-15.
4. de Schepper EI, Damen J, van Meurs JB, et al. The association between lumbar disc degeneration and low back pain: the influence of age, gender, and in- dividual radiographic features. Spine (Phila Pa 1976) 2010;35:531-6.
5. Goode AP, Marshall SW, Renner JB, et al. Lumbar spine radiographic features and demographic, clini-
cal, and radiographic knee, hip, and hand osteoar- thritis. Arthritis Care Res (Hoboken) 2012;64:1536- 44.
6. Hangai M, Kaneoka K, Kuno S, et al. Factors associated with lumbar intervertebral disc degeneration in the elderly. Spine J 2008;8:732-40.
7. Daghighi MH, Pouriesa M, Maleki M, et al. Migra- tion patterns of herniated disc fragments: a study on 1,020 patients with extruded lumbar disc herniation.
Spine J 2013 Dec 18 [Epub]. http://dx.doi.org/10.1016/
j.spinee.2013.11.056.
8. Roh JS, Teng AL, Yoo JU, Davis J, Furey C, Bohlman HH. Degenerative disorders of the lumbar and cervi- cal spine. Orthop Clin North Am 2005;36:255-62.
9. Taher F, Essig D, Lebl DR, et al. Lumbar degenerative disc disease: current and future concepts of diagnosis and management. Adv Orthop 2012;2012:970752.
10. Pouriesa M, Fouladi RF, Mesbahi S. Disproportion of end plates and the lumbar intervertebral disc hernia- tion. Spine J 2013;13:402-7.
11. Bland JM, Altman DG. Statistical methods for as- sessing agreement between two methods of clinical measurement. Lancet 1986;1:307-10.
12. Landis JR, Koch GG. The measurement of observer agreement for categorical data. Biometrics 1977;33:
159-74.
13. Kirkaldy-Willis WH, Wedge JH, Yong-Hing K, Reilly J. Pathology and pathogenesis of lumbar spondylosis and stenosis. Spine (Phila Pa 1976) 1978;3:319-28.
14. Adams MA, Freeman BJ, Morrison HP, Nelson IW, Dolan P. Mechanical initiation of intervertebral disc degeneration. Spine (Phila Pa 1976) 2000;25:1625-36.
15. Gruber HE, Gordon B, Williams C, Norton HJ, Han- ley EN Jr. Vertebral endplate and disc changes in the aging sand rat lumbar spine: cross-sectional analyses of a large male and female population. Spine (Phila Pa 1976) 2007;32:2529-36.
16. Kalichman L, Hunter DJ. Lumbar facet joint osteoar- thritis: a review. Semin Arthritis Rheum 2007;37:69- 80.
17. Gamradt SC, Wang JC. Lumbar disc arthroplasty.
Spine J 2005;5:95-103.
18. Smit TH, Odgaard A, Schneider E. Structure and function of vertebral trabecular bone. Spine (Phila Pa 1976) 1997;22:2823-33.
19. Ishihara H, Matsui H, Osada R, Ohshima H, Tsuji H. Facet joint asymmetry as a radiologic feature of
lumbar intervertebral disc herniation in children and adolescents. Spine (Phila Pa 1976) 1997;22:2001-4.
20. Ko HY, Park BK. Facet tropism in lumbar motion segments and its significance in disc herniation. Arch Phys Med Rehabil 1997;78:1211-4.
21. Broberg KB. Slow deformation of intervertebral discs.
J Biomech 1993;26:501-12.
22. Pappou IP, Cammisa FP Jr, Girardi FP. Correlation of end plate shape on MRI and disc degeneration in sur- gically treated patients with degenerative disc disease and herniated nucleus pulposus. Spine J 2007;7:32-8.
23. Harrington J Jr, Sungarian A, Rogg J, Makker VJ, Epstein MH. The relation between vertebral endplate shape and lumbar disc herniations. Spine (Phila Pa 1976) 2001;26:2133-8.
24. Auerbach JD, Ballester CM, Hammond F, Carine ET, Balderston RA, Elliott DM. The effect of implant size and device keel on vertebral compression properties in lumbar total disc replacement. Spine J 2010;10:
333-40.
25. Hou Y, Yuan W. Influences of disc degeneration and bone mineral density on the structural properties of
lumbar end plates. Spine J 2012;12:249-56.
26. van der Kraan PM, van den Berg WB. Osteophytes:
relevance and biology. Osteoarthritis Cartilage 2007;
15:237-44.
27. Cvijetic S, McCloskey E, Korsic M. Vertebral osteo- phytosis and vertebral deformities in an elderly popu- lation sample. Wien Klin Wochenschr 2000;112:407- 12.
28. Suri P, Miyakoshi A, Hunter DJ, et al. Does lumbar spinal degeneration begin with the anterior struc- tures? A study of the observed epidemiology in a community-based population. BMC Musculoskelet Disord 2011;12:202.
29. Oishi Y, Shimizu K, Katoh T, et al. Lack of association between lumbar disc degeneration and osteophyte formation in elderly japanese women with back pain.
Bone 2003;32:405-11.
30. Jensen MC, Brant-Zawadzki MN, Obuchowski N, Modic MT, Malkasian D, Ross JS. Magnetic reso- nance imaging of the lumbar spine in people without back pain. N Engl J Med 1994;331:69-73.