Continuity of Care for Elderly Patients with Diabetes Mellitus, Hypertension, Asthma, and Chronic Obstructive Pulmonary Disease in Korea
We sought to assess continuity of care for elderly patients in Korea and to examine any association between continuity of care and health outcomes (hospitalization, emergency department visits, health care costs). This was a retrospective cohort study using the Korea National Health Insurance Claims Database. Elderly people, 65-84 yr of age, who were first diagnosed with diabetes mellitus (n=268,220), hypertension (n=858,927), asthma (n=129,550), or chronic obstructive pulmonary disease (COPD, n=131,512) in 2002 were followed up for four years, until 2006. The mean of the Continuity of Care Index was 0.735 for hypertension, 0.709 for diabetes mellitus, 0.700 for COPD, and 0.663 for asthma. As continuity of care increased, in all four diseases, the risks of hospitalization and emergency department visits decreased, as did health care costs. In the Korean health care system, elderly patients with greater continuity of care with health care providers had lower risks of hospital and emergency department use and lower health care costs. In conclusion, policy makers need to develop and try actively the program to improve the continuity of care in elderly patients with chronic diseases.
Key Words: Continuity of Patient Care; Hospitalization; Health Care Costs; Diabetes Mellitus;
Hypertension; Asthma; Pulmonary Disease, Chronic Obstructive Jae Seok Hong1, Hee Chung Kang1,
and Jaiyong Kim2
Health Insurance Review & Assessment Policy Institute1, Health Insurance Review & Assessment Service, Seoul; Department of Social and Preventive Medicine2, Hallym University College of Medicine, Chuncheon, Korea
Received: 30 September 2009 Accepted: 3 March 2010 Address for Correspondence:
Jae Seok Hong, Ph.D.
Health Insurance Review & Assessment Service, Health Insurance Review & Assessment Policy Institute, 168 Hyoryeong-no, Secho-gu, Seoul 137-706, Korea Tel: +82.2-2182-2560, Fax: +82.2-6710-5835 E-mail: [email protected]
DOI: 10.3346/jkms.2010.25.9.1259 • J Korean Med Sci 2010; 25: 1259-1271 Medicine General & Social Medicine
INTRODUCTION
Health care spending for the elderly population in Korea increas
ed by 100% in 4 yr, from 5,109 billion Won in 2004 to 10,490 bil
lion Won in 2008, and its proportion of total health insurance spending also rose, from 22.9% in 2004 to 29.9% in 2008 (1). El
derly people, aged 65 yr and over, currently represent 9.6% (ap
proximately 4.6 million) of total health insurance beneficiaries, but they are responsible for a quarter of total health insurance expenditures (1). The elderly population is expected to grow faster over the next decades as the postKorean War baby boom
ers begin to retire in large numbers. Thus, appropriate strate
gies are urgently required to promote the efficient spending of health care budgets for elderly people.
Previous studies have reported that enhanced continuity of care prevented a sudden worsening in progress among chronic disease patients, and as a result was favorable for efficient spend
ing of health care funds (2). Continuity of care is not only a key factor in delivering good health care, but also an attribute em
phasized in common in various definitions of primary care (3).
The implication is that a high level of continuity of primary care could have a positive impact on the process of care, outcomes, and costs (4). Maintaining and enhancing continuity of care, pri
mary health care in particular, has become an important goal of health care policy in many countries, and a number of stud
ies on the association between continuity of care and health outcomes have been reported (5–10).
However, most studies were conducted in children or adults aged under 65 yr (5–8), not in elderly patients aged 65 and over (9, 10). Even studies of elderly patients have focused little atten
tion on the association between continuity of care and health outcomes (10).
The aim of this study was to assess the continuity of outpatient service use by elderly patients in Korea and to examine any as
sociation between the continuity of care and health outcomes (hospitalization, emergency department visits, health care costs) and ultimately provide useful information for health care policy makers.
MATERIALS AND METHODS Study setting
Health care institutions under the Korea National Health Insur
ance are classified according to the number of beds into clinics (fewer than 30 beds), hospitals (30–99 beds), and general hos
pitals (more than 99 beds); all of these can provide outpatient
services. Under the current health care delivery system, patients can select any practitioner or any medical care institution. How
ever, when a patient wants to receive medical care at a second
ary hospital, called a specialized general hospital, the patient must present a referral slip issued from the doctor who saw the patient first. Specialized general hospitals are designated among general hospitals when they meet standards of teaching hospi
tals and other requirements (number of specialized general hospitals in 2007=43) (11). Exceptions to the referral system are in the case of childbirth, emergency medical care, dental care services, rehabilitation, family medicine services, and medical services for a patient with hemophilia, in which case any health care institution can be utilized without limitation (11).
The health care delivery system in Korea is quite different from the managed care delivery system of the United States of America, in which a patient’s selection of health care provider is regulated and restricted. Above all, because most clinical prac
titioners in Korea are specialists, they do not perform the func
tion of a primary care physician as seen in America. In Korea, 91% of clinical practitioners (28,733/31,578) were specialists, and 98% of clinics (25,168/25,789) were sole practices in the year 2006 (12). In terms of outpatient services, clinics compete against other clinics, hospitals, and some general hospitals.
Study data
Study data were collected from the Korea National Health In
surance Claims Database of the Health Insurance Review & As
sessment Service, for the period 2002 to 2006. The International Classification of Disease, 10th edition (ICD 10) was used as the coding system for diagnosis.
As typical chronic diseases of elderly patients in Korea, dia
betes mellitus (E1014), hypertension (I10), asthma (J4546), and chronic obstructive pulmonary disease (COPD, J41J44, J47), were selected. These four diseases have shown a sharp increase in the elderly population associated with population aging, pre
sumably causing an increased burden of disease (1). They are also included in ambulatory caresensitive conditions (ACSCs).
ACSCs are defined as those conditions for which the provi
sion of timely and effective outpatient care, primary health care in particular, can help to reduce the risk of hospitalization (13).
This study followed the classifications by Shi et al., who classi
fied ACSCs by conditions applicable to adults (13).
The study dataset was constructed for each disease with in
surance claims for patients whose disease was marked as a pri
mary disease or a secondary disease, but not as a diagnosis by exclusion. When physicians complete the medical care cost state
ment to make an insurance claim for care service provided to a patient, they are required to enter the diagnosis code for the pa
tient in accordance with the Korean classification of diseases.
The primary disease is written in the first column, and the sec
ondary disease in the next. If two or more secondary diseases
are diagnosed, they are written in order of importance. The pri
mary disease refers to a disease for which the patient made the strongest demands for treatment or testing, and the secondary disease indicates a disease or diseases diagnosed together with the primary disease during the period of care. In this study, the first disease listed in the order of diagnosticcode entry was se
lected as a primary disease, and the second disease as a second
ary disease (14).
Study subjects were followed for 4 yr, the first 3 for continuity of care and the last year for health outcomes (hospitalization, emergency department visits, health care costs). Although the same duration was applied to all study subjects, the dates of ac
tual follow up periods could be different. For example, in the case of a patient who was first diagnosed on January 1, 2002, his or her followup period would be from January 1, 2002 to Decem
ber 31, 2005, whereas another patient first diagnosed on May 1, 2002 would be followed up until April 30, 2006.
This study was approved by the Institutional Review Boards of the Health Insurance Review and Assessment Service (HIRA:
K5358).
Study population
The study subjects were recruited with the following criteria: 1) they were first diagnosed with diabetes mellitus (E1014), hy
pertension (I10), asthma (J4546), or chronic obstructive pul
monary disease (J41J44, J47) in 2002; 2) they were 65 to 84 yr of age at the end of 2002; and 3) they were not hospitalized, nor had they visited an emergency department or died during first 3 yr of the 4yr followup period. Additionally, because a mini
mum of four ambulatory care visits was required for measuring continuity of care (15), patients who made fewer than four am
bulatory care visits during the first 3 yr were excluded. The ex
clusion of patients who died or had hospitalizations or emer
gency department visits during the first 3 yr of the 4yr follow up was intended to reveal causality between the independent vari
able and the dependent variable. The restriction on the number of visits was intended to ensure the accuracy of diagnosis and to allow the calculation of the Continuity of Care (COC) Index in a structurally reasonable and meaningful manner (7, 8). First
diagnosed patients were defined as those who had no record for a diagnosis of the disease concerned between 1995, the year in which the Korea National Health Insurance Claims Database was constructed, and 2001, and then were first diagnosed with the disease in 2002.
Measures
Independent variable: continuity of care index
Many tools are available to assess continuity of care (16). In this study, continuity of care for elderly patients was quantified us
ing the COC Index. The COC Index is a widely used measure that incorporates the idea that personal continuity of care is af
fected by both the total number of providers and the total num
ber of ambulatory care visits (6, 15). The COC Index ranges from 0 to 1. If a patient concentrates all ambulatory care visits with the same provider, the index equals 1, whereas if visits are dis
persed to all different providers, it becomes 0.
M
COC= ∑ nj2N
j=1
N (N1)
N=total number of ambulatory care visits nj=number of visits to provider j
M=total number of providers
To facilitate the analysis and description of the association between continuity of care and health outcomes, the COC level in this study was categorized into high, medium, and low ter
tiles (5, 8).
Dependent variables
Health outcomes, which were dependent variables in this study, consisted of data on hospitalization, emergency department visits, and health care costs. Hospitalization and emergency de
partment visits were recorded as dichotomous variables, indi
cating whether or not a patient had a hospital admission or an emergency visit due to the disease concerned during the last year of the 4yr follow up. If patients were hospitalized with the disease concerned as a primary disease or a secondary disease during the last year, they were regarded as having health out
come events regardless of the number of hospitalizations (17).
This rule was also applied to emergency department visits.
Health care costs refer to the total amount claimed for care services extended to study subjects under the National Health Insurance (NHI) during the last year of the 4yr follow up. Health care costs included costs for procedures, therapies, and medica
tions spent for the treatment of all diseases, including the disease concerned, but excluded noncovered costs under the NHI.
Covariates
Control variables were divided into demographic variables and disease severity variables. Demographic variables were gender (male, female), age (6569, 7074, 7559, 8084 yr), and type of insurance (health insurance, Medical Aid). Variables for disease severity were the number of ambulatory care visits, main attend
ing medical institution, and comorbidities. The number of am
bulatory care visits and the presence of comorbidities were in
cluded here because both variables are associated with health care utilization behavior and disease severity and influence hos
pitalization and emergency department visits (8). Comorbid conditions for the four diseases were selected from relevant ref
erences (17–20), and if patients were diagnosed with a comor
bid condition at a health care institution during first 3 yr of the 4yr followup, they were classified as having a comorbidity. The
selected comorbid conditions were:
• diabetes mellitus: hypertension (I1013), heart disease (I20
25), stroke (I6064), and renal disease (N1012,1519) (17);
• hypertension: heart disease (I2025), stroke (I6064), renal disease (N1012,1519), heart failure (I50), and diabetes mel
litus (E1014) (18);
• asthma: obstructive pulmonary disease (J4044,47), pneu
monia (J1018), cardiac dysrhythmias (I4749), hypertension (I1013), diabetes (E1014), and heart failure (I50) (19); and • chronic obstructive pulmonary disease: pneumonia (J1018),
hypertension (I1013), diabetes (E1014), heart failure (I50), heart disease (I2025), pulmonary vascular disease (I2628), thoracic malignancies (C3034,C3739), renal disease (N10
12,1519), stroke (I6064), and gastrointestinal bleeding (K92) (20).
Main attending medical institutions were defined as the health care institutions that patients visited most often during the first 3 yr. These were classified into specialized general hospitals, gen
eral hospitals, hospitals, clinics, and public health centers.
Statistical analyses
Continuity level was compared by demographic properties and disease severity using the ttest or ANOVA. Differences in hos
pitalization, emergency department visits, and health care costs by patient characteristics were also examined using the ttest or ANOVA.
The association between continuity of care and health out
comes (hospitalization, emergency department visits) was eval
uated through a multiple logistic regression analysis. Factors af
fecting continuity of care and the relationship between continu
ity of care and health care costs were examined through a mul
tiple regression analysis. Health care costs were logtransformed to consider the linearity of the regression model and the outli
ers among the observational values. The SAS System (Version 8.1 for Microsoft Windows) was used as statistical software.
RESULTS
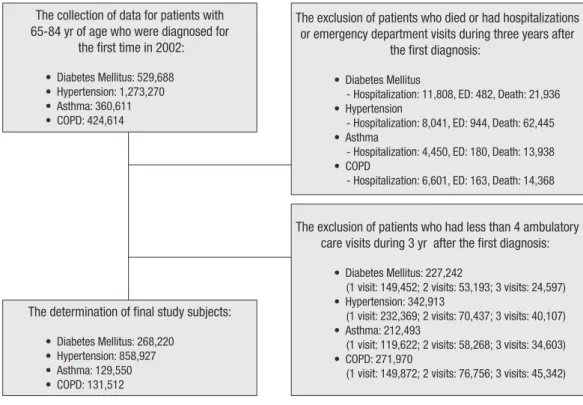
Through the selection procedures presented in Fig. 1, 268,220 patients with diabetes mellitus, 858,927 patients with hyperten
sion, 129,550 patients with asthma, and 131,512 patients with COPD were recruited as study subjects.
The characteristics of patients with diabetes, hypertension, asthma, and COPD are shown in Table 1. In all four diseases, the majority of study subjects were female, and the mean age of pa
tients was approximately 70 yr. The mean number of visits to providers during the followup period was 27.0 for diabetes mel
litus, 24.1 for hypertension, 13.0 for asthma, and 10.8 for COPD.
The mean number of providers was approximately two in all four diseases (2.6 for diabetes mellitus, 2.3 for hypertension, 2.3 for asthma, and 2.0 for COPD). Clinics were the main attending med
ical institution used by the largest number of patients in all four diseases; in asthma and COPD, in particular, more than 70% of patients were using clinics. Health insurance beneficiaries rep
resented approximately 90% of the total study subjects. The mean number of comorbidities was 2.1 for asthma, 1.7 for COPD, 1.2 for diabetes mellitus, and 0.9 for hypertension.
Continuity of care by patient characteristics is compared in Table 2. The highest level of continuity among the four diseases was measured in hypertension (mean±SD of the COC Index, 0.735±0.260), followed by diabetes mellitus (0.709±0.263), COPD (0.700±0.294), and asthma (0.663±0.294). Generally, continuity of care was higher for male patients than for female patients, and the continuity tended to decrease as the age of the patients increased. The level of continuity kept rising up to 36 visits and declined thereafter. Patients whose main attending medical in
stitutions were specialized general hospitals showed the high
est level of continuity, whereas the continuity for patients using hospitals was the lowest. Health insurance beneficiaries showed a higher level of continuity than did Medical Aid recipients. As the number of comorbidities increased, continuity of care de
creased.
Fig. 2 indicates the level of continuity and the number of pa
tients by the number of visits during the first 3 yr of the 4yr fol
low up. The level of continuity increased up to 36 visits for all four diseases but drastically declined thereafter. Number of pa
tients with diabetes mellitus and hypertension continued to in
crease up to 36 visits and dwindled thereafter, whereas that of patients with asthma and COPD was highest at four visits and declined continuously thereafter.
Factors affecting continuity of care were analyzed for the four diseases using a multiple regression analysis (Table 3). For dia
betes mellitus, hypertension, and asthma, women showed a statistically significantly lower level of continuity than men. For COPD, however, women had a higher level of continuity than men. Age affected continuity of care differently. Compared to the 65–69 age group, the 70–74 and 75–79 age groups showed decreased continuity for hypertension and COPD, but increased continuity for asthma. Continuity did not differ with age for dia
betes mellitus. The number of ambulatory care visits also influ
enced continuity of care. Because continuity of care sharply de
clined from 37 ambulatory care visits in all four diseases, ambu
latory care visits were first divided according to those patients doing ≤36 and those doing 37+ visits, and then the ≤36 visits lev
el was further divided into 4–12, 13–24, and 25–36 visits. Com
pared to continuity for patients doing 4–12 visits, those doing 13–24 visits and 25–36 visits showed increased continuity for all four diseases. The 37+ visit category had lower continuity than the 4–12 visit category for diabetes mellitus and asthma (diabe
tes mellitus: β=0.021, asthma: β=0.062). Although no negative relationship was found between continuity and number of am
bulatory visits in hypertension and COPD, a less positive rela
tionship was observed at 37+ visits than at 25–36 visits. Com
pared to patients whose main attending medical institutions were hospitals, those who used other medical institutions, in
cluding general hospitals and specialized general hospitals, showed enhanced continuity. For diabetes mellitus, hyperten
sion, and COPD, Medical Aid recipients showed lower continu
ity than did health insurance beneficiaries, whereas in asthma, The collection of data for patients with
65-84 yr of age who were diagnosed for the first time in 2002:
• Diabetes Mellitus: 529,688
• Hypertension: 1,273,270
• Asthma: 360,611
• COPD: 424,614
The determination of final study subjects:
• Diabetes Mellitus: 268,220
• Hypertension: 858,927
• Asthma: 129,550
• COPD: 131,512
The exclusion of patients who died or had hospitalizations or emergency department visits during three years after
the first diagnosis:
• Diabetes Mellitus
- Hospitalization: 11,808, ED: 482, Death: 21,936
• Hypertension
- Hospitalization: 8,041, ED: 944, Death: 62,445
• Asthma
- Hospitalization: 4,450, ED: 180, Death: 13,938
• COPD
- Hospitalization: 6,601, ED: 163, Death: 14,368
The exclusion of patients who had less than 4 ambulatory care visits during 3 yr after the first diagnosis:
• Diabetes Mellitus: 227,242
(1 visit: 149,452; 2 visits: 53,193; 3 visits: 24,597)
• Hypertension: 342,913
(1 visit: 232,369; 2 visits: 70,437; 3 visits: 40,107)
• Asthma: 212,493
(1 visit: 119,622; 2 visits: 58,268; 3 visits: 34,603)
• COPD: 271,970
(1 visit: 149,872; 2 visits: 76,756; 3 visits: 45,342)
Fig. 1. Flowchart of the selected study subjects.
COPD, chronic obstructive pul
monary disease; ED, emergency department visits.
the opposite results were shown. In all four diseases, the level of continuity decreased with the increasing number of comorbid
ities.
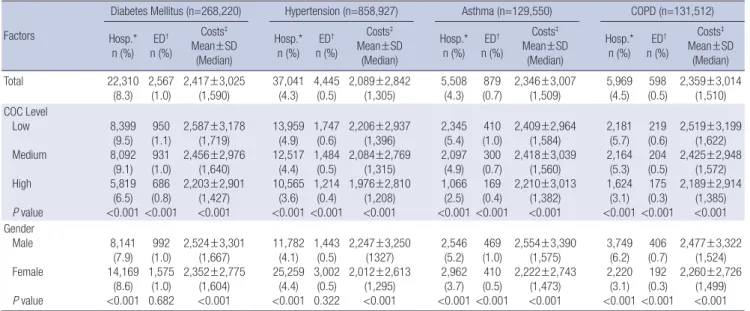
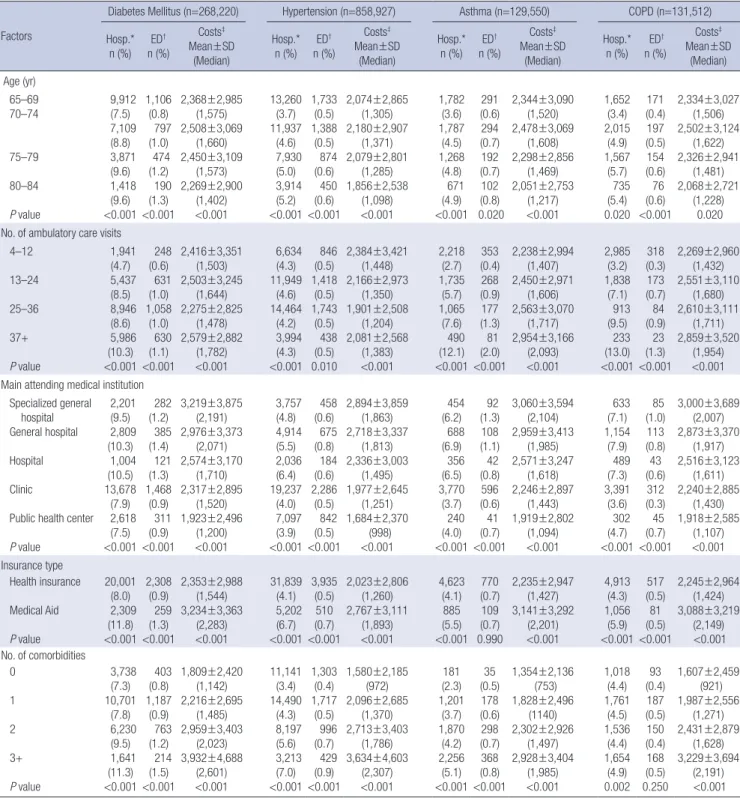
In Table 4, we examined differences in hospitalization, emer
gency department visits, and health care costs by patient char
acteristics. As the level of continuity decreased for all four dis
eases, hospitalization, emergency department visits, and mean health care costs increased. Women showed a higher hospital
ization rate than men for diabetes mellitus and hypertension, whereas men had higher rate of hospitalization and emergency
department visits than women for asthma and COPD. The rate of hospitalization and emergency department visits increased with increasing age and increasing number of ambulatory care visits. Patients whose main attending medical institutions were hospitals, general hospitals, or specialized general hospitals showed a higher rate of hospitalization and emergency depart
ment visits than those who used clinics and public health cen
ters. For Medical Aid recipients and with increasing number of comorbidities, the rate of hospitalization and emergency depart
ment visits increased. More average health care costs were spent Table 1. Study subject characteristics
Parameters
Diabetes mellitus
(n=268,220)
Hypertension (n=858,927)
Asthma (n=129,550)
COPD (n=131,512)
n % n % n % n %
Gender Male Female
102,601 165,619
38.3 61.8
284,825 574,102
33.2 66.8
48,925 80,625
37.8 62.2
60,260 71,252
45.8 54.2 Age (mean±SD) (yr)
6569 7074 7579 8084
70.6±4.6 132,561 80,708 40,195 14,756
49.4 30.1 15.0 5.5
71.5±5.0 362,757 262,639 158,630 74,901
42.2 30.6 18.5 8.7
72.0±5.1 49,471 39,885 26,619 13,575
38.2 30.8 20.6 10.5
72.1±5.1 49,125 41,269 27,416 13,702
37.4 31.4 20.9 10.4 No. of ambulatory care visits (mean±SD)
412 1324 2536 37+
27.0±12.2 41,310 64,241 104,380 58,289
15.4 24.0 38.9 21.7
24.1±10.8 156,262 261,599 346,979 94,087
18.2 30.5 40.4 11.0
13.0±9.9 80,855 30,682 13,973 4,040
62.4 23.7 10.8 3.1
10.8±8.2 94,041 26,079 9,604 1,788
71.5 19.8 7.3 1.4 No. of providers (mean±SD)
1 2 3 4 5+
2.6±1.6 75,909 77,462 52,893 30,371 31,585
28.3 28.9 19.7 11.3 11.8
2.3±1.4 290,282 266,365 160,014 79,341 62,925
33.8 31.0 18.6 9.2 7.3
2.3±1.4 43,215 41,925 24,448 11,192 8,770
33.4 32.4 18.9 8.6 6.8
2.0±1.1 52,736 45,138 21,969 7,898 3,771
40.1 34.3 16.7 6.0 2.9 Main attending medical institution
Specialized general hospital General hospital Hospital Clinic
Public health center
23,126 27,353 9,584 173,197 34,960
8.6 10.2 3.6 64.6 13.0
78,381 88,634 31,687 475,916 184,309
9.1 10.3 3.7 55.4 21.5
7,343 9,947 5,489 100,815 5,956
5.7 7.7 4.2 77.8 4.6
8,879 14,575 6,736 94,843 6,479
6.8 11.1 5.1 72.1 4.9 Insurance type
Health insurance
Medical Aid 248,650
19,570 97.7
7.3 781,460
77,467 91.0
9.0 113,468
16,082 87.6
12.4 113,580
17,932 86.4 13.6 Comorbidity
Heart disease Stroke Renal disease Hypertension Heart failure Diabetes mellitus Pneumonia Cardiac dysrhythmias Obstructive pulmonary disease Pulmonary vascular disease Thoracic malignancies Gastrointestinal bleeding
52,387 45,699 9,426 205,082
19.5 17.0 3.5 76.5
208,201 173,838 31,034 78,808 284,989
24.2 20.2 3.6 9.2 33.2
79,950 17,013 31,800 39,559 9,379 95,163
61.7 13.1 24.6 30.5 7.2 73.5
26,635 20,414 4,772 78,757 16,156 32,327 39,738
1,108 4,682 2,535
20.3 15.5 3.6 59.9 12.3 24.6 30.2
0.8 3.6 1.9 No. of comorbidity (mean±SD)
0 1 2 3+
1.2±0.8 50,896 137,311 65,479 14,534
19.0 51.2 24.4 5.4
0.9±0.9 327,454 338,562 147,167 45,744
38.1 39.4 17.1 5.3
2.1±1.1 7,732 32,460 44,787 44,571
6.0 25.1 34.6 34.4
1.7±1.3 23,414 39,239 35,118 33,741
17.8 29.8 26.7 25.7 COPD, chronic obstructive pulmonary disease.
for men, patients who made 37 or more ambulatory care visits, patients whose main attending medical institutions were spe
cialized general hospitals, and Medical Aid recipients. Mean health care costs decreased as age increased, and increased as the number of comorbidities increased.
The association between continuity of care and health out
comes, adjusted for confounders, is presented in Table 5. Com
pared to the high continuity group, in all four diseases, the low
continuity group showed a higher risk of hospitalization (dia
betes mellitus odds ratio [OR], 1.47, 95% confidence interval [CI], 1.41–1.52; hypertension OR, 1.31, 95% CI, 1.28–1.35; asthma OR, 2.07, 95% CI, 1.92–2.23; COPD OR, 1.99, 95% CI, 1.86–2.13) and a higher risk of emergency department visits (diabetes mellitus OR, 1.41, 95% CI, 1.27–1.56; hypertension OR, 1.45, 95% CI, 1.34–
1.57; asthma OR, 2.25, 95% CI, 1.87–2.70; COPD OR, 1.77, 95%
CI, 1.45–2.17) than did the high continuity group. The medium Table 2. Level of continuity by patient characteristics
Parameters Diabetes Mellitus Hypertension Asthma COPD
COC P value COC P value COC P value COC P value
Total 0.709±0.263 0.735±0.260 0.663±0.294 0.700±0.294
Gender Male
Female 0.762±0.259
0.694±0.264 <0.001 0.762±0.254
0.722±0.263 <0.001 0.677±0.288
0.654±0.294 <0.001 0.689±0.293 0.708±0.296 <0.001 Age
65–69 70–74 75–79 80–84
0.712±0.262 0.706±0.263 0.702±0.264 0.708±0.266
<0.001 0.742±0.268 0.734±0.260 0.723±0.263 0.725±0.265
<0.001 0.658±0.295 0.659±0.294 0.666±0.295 0.684±0.292
<0.001 0.702±0.295 0.697±0.295 0.694±0.295 0.712±0.291
<0.001
No. of ambulatory care visits 4–12
13–24 25–36 37+
0.695±0.301 0.723±0.257 0.730±0.252 0.664±0.252
<0.001 0.701±0.295 0.725±0.259 0.757±0.248 0.743±0.241
<0.001 0.657±0.309 0.668±0.271 0.705±0.262 0.601±0.256
<0.001 0.679±0.307 0.739±0.259 0.796±0.236 0.717±0.249
<0.001
Main attending medical institution Specialized general hospital General hospital Hospital Clinic
Public health center
0.791±0.235 0.765±0.245 0.678±0.265 0.682±0.270 0.748±0.231
<0.001 0.828±0.231 0.792±0.246 0.693±0.268 0.692±0.270 0.789±0.224
<0.001 0.709±0.265 0.698±0.278 0.626±0.289 0.655±0.299 0.719±0.257
<0.001 0.745±0.273 0.722±0.284 0.634±0.299 0.694±0.299 0.741±0.260
<0.001
Insurance type Health insurance
Medical Aid 0.710±0.263
0.696±0.263 <0.001 0.737±0.260
0.723±0.262 <0.001 0.662±0.295
0.671±0.293 <0.001 0.700±0.295 0.695±0.295 0.030 No. of comorbidities
0 1 2 3+
0.734±0.259 0.722±0.259 0.675±0.266 0.645±0.270
<0.001 0.767±0.252 0.733±0.260 0.694±0.266 0.659±0.271
<0.001 0.790±0.269 0.714±0.287 0.661±0.293 0.605±0.293
<0.001 0.743±0.285 0.718±0.289 0.694±0.295 0.655±0.300
<0.001
COPD, chronic obstructive pulmonary disease; COC, continuity of care.
COC score No. of patients
No. of visits
Mean COC (Diabetes) Mean COC (Athma)
No. of patients (Hypertension) Mean COC (Hypertension)
No. of patients (Diabetes) Mean COC (COPD)
No. of patients (Athma) No. of patients (COPD)
4 8 12 16 20 24 28 32 36 40 44 48 52 56 60
1.0
0.8
0.6
0.4
0.2
0.0
80,000
60,000
40,000
20,000
0
Fig. 2. Continuity of care scores and the number of patients by the number of ambulatory care visits during the first 3 yr of the 4yr follow up.
COC, continuity of care; COPD, chronic obstruc
tive pulmonary disease.
continuity group also had higher risks of hospitalization and emergency department visits than did the high continuity group, but lower risks than the low continuity group. As continuity of care is an important attribute in primary care and clinics, and public health centers are important primary care providers in
Korea, we made a separate analysis for patients whose main at
tending medical institutions were clinics and public health cen
ters (5). As continuity of care decreased, risks of hospitalization and emergency department visits increased in this separate anal
ysis as well.
Table 3. Analysis of factors affecting continuity of care; a multiple linear regression model
Factors Diabetes Mellitus Hypertension Asthma COPD
Coefficients P value Coefficients P value Coefficients P value Coefficients P value Gender
Male
Female 0.000
0.030 <0.001 0.000
0.029 <0.001 0.000
0.016 <0.001 0.000
0.036 <0.001 Age
6569 7074 7579 8084
0.000
0.001
0.002 0.004
0.360 0.216 0.117
0.000
0.006
0.009
0.007
<0.001
<0.001
<0.001
0.000 0.006 0.015 0.030
0.002
<0.001
<0.001
0.000
0.006
0.009 0.008
0.003
<0.001 0.006 No. of ambulatory care visits
412 1324 2536 37±
0.000 0.013 0.037
0.021
<0.001
<0.001
<0.001
0.000 0.032 0.084 0.073
<0.001
<0.001
<0.001
0.000 0.008 0.038
0.062
<0.001
<0.001
<0.001
0.000 0.058 0.112 0.035
<0.001
<0.001
<0.001 Main attending medical institution
Specialized general hospital General hospital Hospital Clinic
Public health center
0.122 0.096 0.000 0.002 0.096
<0.001
<0.001
<0.001
<0.001
0.163 0.118 0.000
0.027 0.049
<0.001
<0.001
<0.001
<0.001
0.084 0.076 0.000 0.022 0.066
<0.001
<0.001
<0.001
<0.001
0.108 0.089 0.000 0.055 0.092
<0.001
<0.001
<0.001
<0.001 Insurance type
Health insurance
Medical Aid 0.000
0.007 0.000 0.000
0.005 <0.001 0.000
0.019 <0.001 0.000
0.005 0.021 No. of comorbidities
0 1 2 3+
0.000
0.013
0.071
0.108
<0.001
<0.001
<0.001
0.000
0.043
0.094
0.138
<0.001
<0.001
<0.001
0.000
0.079
0.133
0.190
<0.001
<0.001
<0.001
0.000
0.028
0.026
0.030
<0.001
<0.001
<0.001
Adjusted Rsquare 0.049 0.082 0.043 0.033
F value (P value) 924.79 <0.001 5,091.53 <0.001 392.92 <0.001 302.29 <0.001 COPD, chronic obstructive pulmonary disease.
Table 4. Differences in hospitalization, emergency department visits, and health care costs by patient characteristics
Factors
Diabetes Mellitus (n=268,220) Hypertension (n=858,927) Asthma (n=129,550) COPD (n=131,512) Hosp.*
n (%) ED† n (%)
Costs‡ Mean±SD
(Median)
Hosp.*
n (%) ED† n (%)
Costs‡ Mean±SD
(Median)
Hosp.*
n (%) ED† n (%)
Costs‡ Mean±SD
(Median)
Hosp.*
n (%) ED† n (%)
Costs‡ Mean±SD
(Median)
Total 22,310
(8.3) 2,567
(1.0) 2,417±3,025
(1,590) 37,041 (4.3) 4,445
(0.5) 2,089±2,842
(1,305) 5,508
(4.3) 879
(0.7) 2,346±3,007
(1,509) 5,969
(4.5) 598
(0.5) 2,359±3,014 (1,510) COC Level
Low Medium High P value
8,399 (9.5) 8,092
(9.1) 5,819
(6.5)
<0.001 950 (1.1) 931 (1.0) 686 (0.8)
<0.001
2,587±3,178 (1,719) 2,456±2,976
(1,640) 2,203±2,901
(1,427)
<0.001
13,959 (4.9) 12,517
(4.4) 10,565
(3.6)
<0.001 1,747
(0.6) 1,484
(0.5) 1,214
(0.4)
<0.001
2,206±2,937 (1,396) 2,084±2,769
(1,315) 1,976±2,810
(1,208)
<0.001
2,345 (5.4) 2,097
(4.9) 1,066
(2.5)
<0.001 410 (1.0)
300 (0.7)
169 (0.4)
<0.001
2,409±2,964 (1,584) 2,418±3,039
(1,560) 2,210±3,013
(1,382)
<0.001
2,181 (5.7) 2,164
(5.3) 1,624
(3.1)
<0.001 219 (0.6) 204 (0.5) 175 (0.3)
<0.001
2,519±3,199 (1,622) 2,425±2,948
(1,572) 2,189±2,914
(1,385)
<0.001 Gender
Male Female P value
8,141 (7.9) 14,169
(8.6)
<0.001 992 (1.0) 1,575
(1.0) 0.682
2,524±3,301 (1,667) 2,352±2,775
(1,604)
<0.001
11,782 (4.1) 25,259
(4.4)
<0.001 1,443
(0.5) 3,002
(0.5) 0.322
2,247±3,250 (1327) 2,012±2,613
(1,295)
<0.001
2,546 (5.2) 2,962
(3.7)
<0.001 469 (1.0)
410 (0.5)
<0.001
2,554±3,390 (1,575) 2,222±2,743
(1,473)
<0.001
3,749 (6.2) 2,220
(3.1)
<0.001 406 (0.7)
192 (0.3)
<0.001
2,477±3,322 (1,524) 2,260±2,726
(1,499)
<0.001 (continued to the next page)
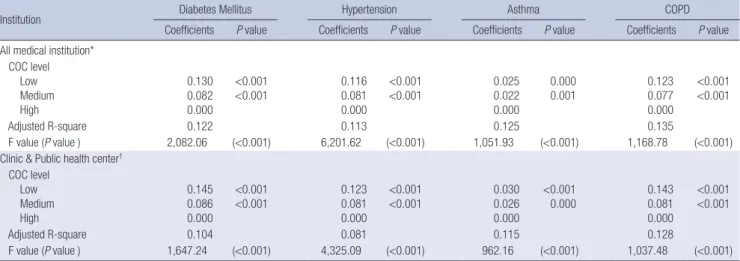
Table 6 shows the association between continuity of care and health care costs after adjusting for confounders. Compared to the high continuity group, in all four diseases, health care costs increased in both the medium continuity group and the low con
tinuity group. Similar results were also obtained in a separate analysis for patients whose main attending medical institutions
were clinics and public health centers.
DISCUSSION
Our study showed that the mean (±SD) of the COC Index for el
derly patients was, in descending order, 0.735±0.260 for hyper
Table 4. (continued from the previous page) Differences in hospitalization, emergency department visits, and health care costs by patient characteristics
Factors
Diabetes Mellitus (n=268,220) Hypertension (n=858,927) Asthma (n=129,550) COPD (n=131,512) Hosp.*
n (%) ED† n (%)
Costs‡ Mean±SD
(Median)
Hosp.*
n (%) ED† n (%)
Costs‡ Mean±SD
(Median)
Hosp.*
n (%) ED† n (%)
Costs‡ Mean±SD
(Median)
Hosp.*
n (%) ED† n (%)
Costs‡ Mean±SD
(Median) Age (yr)
65–69 70–74
75–79 80–84 P value
9,912 (7.5) 7,109
(8.8) 3,871
(9.6) 1,418
(9.6)
<0.001 1,106
(0.8) 797
(1.0) 474 (1.2) 190
(1.3)
<0.001
2,368±2,985 (1,575) 2,508±3,069
(1,660) 2,450±3,109
(1,573) 2,269±2,900
(1,402)
<0.001
13,260 (3.7) 11,937
(4.6) 7,930
(5.0) 3,914
(5.2)
<0.001 1,733
(0.5) 1,388
(0.5) 874
(0.6) 450
(0.6)
<0.001
2,074±2,865 (1,305) 2,180±2,907
(1,371) 2,079±2,801
(1,285) 1,856±2,538
(1,098)
<0.001
1,782 (3.6) 1,787
(4.5) 1,268
(4.8) 671
(4.9)
<0.001 291 (0.6) 294 (0.7) 192 (0.7) 102 (0.8) 0.020
2,344±3,090 (1,520) 2,478±3,069
(1,608) 2,298±2,856
(1,469) 2,051±2,753
(1,217)
<0.001
1,652 (3.4) 2,015
(4.9) 1,567
(5.7) 735
(5.4) 0.020
171 (0.4) 197 (0.5) 154 (0.6) 76 (0.6)
<0.001
2,334±3,027 (1,506) 2,502±3,124
(1,622) 2,326±2,941
(1,481) 2,068±2,721
(1,228) 0.020 No. of ambulatory care visits
4–12 13–24 25–36 37+
P value
1,941 (4.7) 5,437
(8.5) 8,946
(8.6) 5,986
(10.3)
<0.001 248
(0.6) 631
(1.0) 1,058
(1.0) 630
(1.1)
<0.001
2,416±3,351 (1,503) 2,503±3,245
(1,644) 2,275±2,825
(1,478) 2,579±2,882
(1,782)
<0.001
6,634 (4.3) 11,949
(4.6) 14,464
(4.2) 3,994
(4.3)
<0.001 846
(0.5) 1,418
(0.5) 1,743
(0.5) 438
(0.5) 0.010
2,384±3,421 (1,448) 2,166±2,973
(1,350) 1,901±2,508
(1,204) 2,081±2,568
(1,383)
<0.001
2,218 (2.7) 1,735
(5.7) 1,065
(7.6) 490 (12.1)
<0.001 353 (0.4) 268 (0.9) 177 (1.3) 81 (2.0)
<0.001
2,238±2,994 (1,407) 2,450±2,971
(1,606) 2,563±3,070
(1,717) 2,954±3,166
(2,093)
<0.001
2,985 (3.2) 1,838
(7.1) 913
(9.5) 233 (13.0)
<0.001 318 (0.3) 173 (0.7) 84 (0.9) 23 (1.3)
<0.001
2,269±2,960 (1,432) 2,551±3,110
(1,680) 2,610±3,111
(1,711) 2,859±3,520
(1,954)
<0.001 Main attending medical institution
Specialized general hospital General hospital Hospital Clinic
Public health center P value
2,201 (9.5) 2,809
(10.3) 1,004
(10.5) 13,678
(7.9) 2,618
(7.5)
<0.001 282
(1.2) 385
(1.4) 121
(1.3) 1,468
(0.9) 311
(0.9)
<0.001
3,219±3,875 (2,191) 2,976±3,373
(2,071) 2,574±3,170
(1,710) 2,317±2,895
(1,520) 1,923±2,496
(1,200)
<0.001
3,757 (4.8) 4,914
(5.5) 2,036
(6.4) 19,237
(4.0) 7,097
(3.9)
<0.001 458
(0.6) 675
(0.8) 184
(0.6) 2,286
(0.5) 842
(0.5)
<0.001
2,894±3,859 (1,863) 2,718±3,337
(1,813) 2,336±3,003
(1,495) 1,977±2,645
(1,251) 1,684±2,370
(998)
<0.001
454 (6.2) 688
(6.9) 356
(6.5) 3,770
(3.7) 240
(4.0)
<0.001 92 (1.3) 108 (1.1) 42 (0.8) 596 (0.6) 41 (0.7)
<0.001
3,060±3,594 (2,104) 2,959±3,413
(1,985) 2,571±3,247
(1,618) 2,246±2,897
(1,443) 1,919±2,802
(1,094)
<0.001
633 (7.1) 1,154
(7.9) 489
(7.3) 3,391
(3.6) 302
(4.7)
<0.001 85 (1.0) 113 (0.8)
43 (0.6) 312 (0.3) 45 (0.7)
<0.001
3,000±3,689 (2,007) 2,873±3,370
(1,917) 2,516±3,123
(1,611) 2,240±2,885
(1,430) 1,918±2,585
(1,107)
<0.001 Insurance type
Health insurance Medical Aid P value
20,001 (8.0) 2,309
(11.8)
<0.001 2,308
(0.9) 259
(1.3)
<0.001
2,353±2,988 (1,544) 3,234±3,363
(2,283)
<0.001
31,839 (4.1) 5,202
(6.7)
<0.001 3,935
(0.5) 510 (0.7)
<0.001
2,023±2,806 (1,260) 2,767±3,111
(1,893)
<0.001
4,623 (4.1) 885 (5.5)
<0.001 770 (0.7) 109 (0.7) 0.990
2,235±2,947 (1,427) 3,141±3,292
(2,201)
<0.001
4,913 (4.3) 1,056
(5.9)
<0.001 517 (0.5)
81 (0.5)
<0.001
2,245±2,964 (1,424) 3,088±3,219
(2,149) <0.001 No. of comorbidities
0 1 2 3+
P value
3,738 (7.3) 10,701
(7.8) 6,230
(9.5) 1,641
(11.3)
<0.001 403
(0.8) 1,187
(0.9) 763
(1.2) 214
(1.5)
<0.001
1,809±2,420 (1,142) 2,216±2,695
(1,485) 2,959±3,403
(2,023) 3,932±4,688
(2,601)
<0.001
11,141 (3.4) 14,490
(4.3) 8,197
(5.6) 3,213
(7.0)
<0.001 1,303
(0.4) 1,717
(0.5) 996
(0.7) 429
(0.9)
<0.001
1,580±2,185 (972) 2,096±2,685
(1,370) 2,713±3,403
(1,786) 3,634±4,603
(2,307)
<0.001
181 (2.3) 1,201
(3.7) 1,870
(4.2) 2,256
(5.1)
<0.001 35 (0.5) 178 (0.6) 298 (0.7) 368 (0.8)
<0.001
1,354±2,136 (753) 1,828±2,496
(1140) 2,302±2,926
(1,497) 2,928±3,404
(1,985)
<0.001
1,018 (4.4) 1,761
(4.5) 1,536
(4.4) 1,654
(4.9) 0.002
93 (0.4) 187 (0.5) 150 (0.4) 168 (0.5) 0.250
1,607±2,459 (921) 1,987±2,556
(1,271) 2,431±2,879
(1,628) 3,229±3,694
(2,191) <0.001
*Hospitalization; †Emergency department visits; ‡Health care costs (unit: 1,000 won [KRW]).
COPD, chronic obstructive pulmonary disease.