Effect of Foreign Investors’ Trade Amount by Nationality on Korean Stock Market
Jae-Ho Cho
Lecturer, Dept. of Economics, Soongsil University
한국주식시장에 대한 국적별 외국인 투자자 거래대금의 영향
조재호
숭실대학교 경제학과 강사
Abstract According to the equity home bias theory, foreign investors are considered to have less information than native investors. However, as the economy becomes liberalized and overseas economic innovation has a great influence on the local economy, it is possible for foreign investors to invest as informed traders. This study analyzes whether information on trade amount by nationality has specific characteristics. The findings are summarized as follows. First, the increase in trading by foreign investors has negative effects on stock returns. There is no significant difference in these negative effects by nationality. This means that foreign investors show strong herd behavior regardless of nationality. Second, foreigners' investment activities increase stock price volatility, but the impact is not significant. Third, the behavior of foreign investors is still positive feedback. However, there are signs that positive feedback behavior may be changing, especially for funds from the United States and the Cayman Islands. Finally, tax haven zone funds have different investment strategies than other foreign investors. However, Cayman Islands funds, which are estimated to be closely related to Korea, are different from Luxembourg and Ireland funds. These findings undermine the fundamentals of the equity home bias theory.
Key Words : Equity Home Bias, Trade Amount of Foreign Investors, Trade Amount by Nationality, Tax Haven Zone, Positive Feedback Trading
요 약 주식자국편향이론에 따르면 외국인 투자자는 국내 투자자보다 정보가 적은 것으로 간주된다. 그러나 경제가 개방되어 가고 해외경제 혁신이 국내 경제에 큰 영향을 미치면 외국인 투자자가 정보보유자(informed trader)로서 투자할 가능성이 있다. 본 연구에서는 국적별 거래대금 정보에 독특한 특징이 있는지를 분석하였다. 이 연구가 발견한 것은 다음과 같이 요약할 수 있다. 첫째, 외국인 투자자의 거래 증가는 주식 수익률에 부(-)의 효과를 가진다. 이 부(-) 의 효과는 국적에 따라 큰 차이가 없다. 이는 외국인 투자자들이 국적에 관계없이 강한 무리행동을 보인다는 것을 의미 한다. 둘째, 외국인의 투자활동은 주가 변동성을 증가시키지만 그 영향은 크지 않다. 셋째, 외국인의 투자행태는 여전 이 포지티브 피드백이다. 그러나 포지티브 피드백은 변화조짐이 있으며, 특히 미국과 케이만 제도의 펀드의 경우에 그러하다. 끝으로 조세피난처 펀드는 다른 외국인 투자자와 다른 투자전략을 가지고 있다. 그러나 한국과 밀접한 관련 이 있는 것으로 추정되는 케이맨 제도 펀드는 룩셈부르크와 아일랜드 펀드와는 다른 양상을 가지고 있다. 이러한 결과 들은 주식자국편향이론의 기반을 약화시킨다.
주제어 : 주식자국편향, 외국인의 거래대금, 국적별 거래대금, 조세피난처, 포지티브 피드백 거래
*This work was supported by the Ministry of Education of the Republic of Korea and the National Research Foundation of Korea(NRF-2018S1A5B5A07074098)
*Corresponding Author : Jae-Ho Cho([email protected]) Received May 27, 2021
Accepted August 20, 2021
Revised July 30, 2021
Published August 28, 2021
1. Introduction
Since 1992, when the Korean stock market partially opened, the liberalization of the stock market has steadily progressed. Investment amounts by foreign investors have also been increasing, and now the equity share of foreigners has reached the middle 30% range.
Accordingly, the influence of foreigners' investment on the stock market is also increasing. The inflow and outflow of foreigners' investment funds have a great influence on the capital market. Specifically, foreigners sold stocks on a large scale during the Asian currency crisis in 1997, and then bought stocks back massively during the economic recovery phase.
In the regime of the global financial crisis in 2008, foreigners sold stocks on a large scale, and in the recovery regime after that, a massive buyback was recorded. In this way, foreigners took dynamic investment strategies that repeated massive selling and buying when large financial episodes occurred, which had a great influence on the Korean stock market. In Korea, rich data that reveal foreigners' holdings and trading of each individual stock are available at almost real time, so that domestic investors tend to imitate the trading behavior of foreign investors.
There have been many papers on the effect of foreign investors' trade on stock price returns and volatility. However, foreigners are not a single entity. When some foreigners sell stocks, others buy stocks. This means that foreign investors need to be subdivided. In this study, foreign investors are classified by nationality, and their trading characteristics are examined. This is the first study to analyze the characteristics of foreign investors by nationality. If the characteristics of foreign investors are more clearly understood, the investment behavior of Korean investors would be improved efficiently, and the efficiency of the Korean capital market is also expected to be improved.
The rest of the study is as follows. Section 2 reviews previous studies and section 3 explains the analysis data and methods. In section 4, empirical results are presented. Conclusions are summarized in section 5.
2. Previous Studies
According to the equity home bias theory, foreign portfolio investors are at an informational disadvantage compared to local investors. So, they become positive feedback traders and show herd behaviors at times [1].
Then, positive feedback trading causes increased volatility. However, some recent studies on the financial market raise the following doubts about the theory.
1) Are foreign investors inferior in information to domestic investors?
It is often said that domestic investors have an edge over foreign investors in trading domestic stocks [2]. However, it is still controversial whether foreign investors are better or less informed than domestic investors [3]. As the economy becomes liberalized and overseas economic innovation has a great influence on the local economy, it is possible for foreign investors to invest as informed traders. In particular, since the investment activities of foreign investors are disclosed in almost real time in Korea, it is more likely that native individual investors would respond to the market as noise traders. It is easy to observe that individual investors follow the behavior of foreign investors because they think information is asymmetric and foreigners are superior in information. This trend is expected to become stronger as the digital economy deepens.
In fact, there are many studies that show that
foreign investors have an information advantage
over domestic investors. In particular, during the global financial crisis, the information advantage of foreigners was remarkable. This appeared to be a spillover effect of the global financial crisis [4,5]. Shin (2007) pointed out that the stock sales value of foreign investors could be used as a leading index of the stock index, while stock purchase value could not [6]. Min (2009) stated that during the global financial crisis, foreign investors showed more short-term investment patterns than in the past, so that the influence of foreigners on the stock price had expanded [7]. Ko
& Kim (2010) found that foreign investors employed dynamic hedging strategies and gave more weight to global economic information than domestic information [8]. Kim (2013) said that foreign investors realized higher rates of return based on their relative information superiority during the global financial crisis [9]. Jung, Jin &
Cha reported that short-term foreign investors did not decrease information asymmetry, but long-term investors did [10].
2) Are foreign investors positive feedback trading investors?
The simplest definition of positive feedback trading is a positive correlation between investment flows and stock returns. Many studies have insisted that foreigners' investment behavior showed strong positive feedback, thereby increasing financial market instability, especially during the global financial crisis [11,12].
However, some researchers recently reported that foreign portfolio investors' trading behavior would not be positive feedback trading.
Onishchenko & Ülkü (2019) documented that foreigners' shift away from positive feedback trading was a pervasive phenomenon [13].
Khanthavit (2020) did not find evidence to support that foreign investors are positive feedback investors, but exhibit self-herd behavior in Thailand in the time of COVID-19 [14]. Park &
Park (2015) reported that individual and institutional investors engaged in momentum trading (positive feedback trading) and foreign investors engaged in contrarian trading [15].
These research results suggest that unlike before, that foreigners' investment behavior may be shifting away from positive feedback.
3) Does foreigners' investment increase volatility?
It is also still controversial whether foreigners' investment increases or decreases volatility.
There are many research results that suggest that foreigners' trading increases volatility. For example, Lee & Han (2013) pointed out that the investment behavior of foreigners showed strong positive feedback in East Asia, thereby increasing financial market instability in Korea during the global financial crisis [16].
However, there are also many research results that indicate that foreigners' trading reduces volatility. For example, Jeong & Chung (2014) argued that foreigners' net investment had a positive effect on stock returns, but reduced volatility [17].
4) Does foreigners' investment show herd behavior?
Three reasons for herding are payoff
externalities, reputational concerns or issues
related to the principal-agent theory, and
informational externalities [18]. These also apply
to foreign investors. If such herd behavior occurs,
it causes increased volatility. In particular, with
regard to informational externalities, investors
acquire (noisy) information by observing the
actions of other agents [19]. If local individual
investors imitate foreigners' investment behavior,
volatility will increase. This further destabilizes
the financial markets. Park (2016) estimated that
as the proportion of foreign investors' trade
increased, herd behavior appeared more strongly,
so that foreign investors were more likely to herd
and destabilize the Korean stock market than individual investors [20].
However, foreign investors are not a single entity. If we look at the monthly trading data by nationality, it is easy to find that foreigners' trades are mixed with each other. Nevertheless, some behavior of foreign investors seems to have something in common. This study seeks to find such characteristics.
3. Data and Methodology
The trade amount of foreign investors in Korea's stock market by nationality has been reported monthly by the Financial Supervisory Service since November 1998. Now the trade amounts of UK and U.S. funds account for about 1/3 and 1/6, respectively. And the trade amounts of Luxembourg, Ireland and Cayman Islands funds, which can be considered tax haven zones, account for 5% to 8%, respectively. The general belief in the market is that U.S. investors are mainly based on pension funds, so their movements are stable, while UK investors operate funds with a global outlook, and tax haven zone funds pursue relatively high returns in the short term. In addition, trade amounts from various countries are being announced, but there are problems with the time series being often interrupted. It is only the data of all foreigners, the UK and U.S. that are consistently aggregated without interruption.
In this study, trade amounts are adopted as the main variable. The monthly data of all foreigners, the UK and U.S. are from Nov. 1998 to Dec. 2020.
The data of Luxembourg, Ireland and the Cayman Islands cover from Jul. 2015 to Dec. 2020.
However, trade amount and trade volume differ conceptually. In order to adopt the trade amount as a variable, it should be adjusted in line with the increase in the stock price level.
The reason is that trade amount and stock price level have a strong positive correlation. For example, KRW 1 billion in trade amount when KOSPI is 1,000 points and KRW 1 billion in trade amount when it is 2,000 points do not have the same effect on stock returns and volatility.
Therefore, trade amounts of foreign investors are divided by KOSPI. These newly calculated variables are called trade value, which is defined as:
(1)
,
,
,
,
, and
represent the trade values of all foreigners, the UK, U.S., Luxembourg, Ireland, and the Cayman Islands, respectively.
The net buy ratios are defined as:
(2)
,
,
,
,
, and
represent the net buy ratio of all foreigners, the UK, U.S., Luxembourg, Ireland, and the Cayman Islands, respectively. The exchange rate data is obtained from the Bank of Korea. The data of KOSPI is obtained from the Bank of Korea and Kyobo Securities Co. The data of NASDAQ is obtained from Kyobo Securities Co.
,
,
,
,
,
, KOSPI, NASDAQ, and exchange rates are used after taking the logarithm.
In the results of the unit root test of the data except net buy ratio data, the null hypothesis that there are a unit root cannot be rejected, so first differenced data are used. Net buy ratio data are found to be stationary, so I(0) are used.
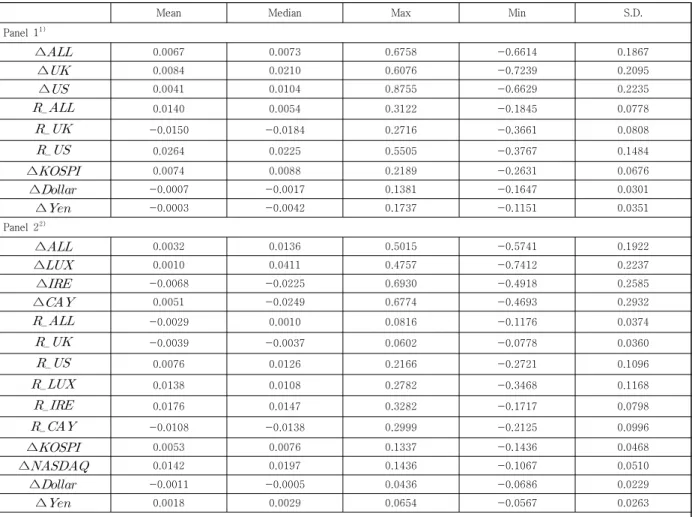
[Table 1] shows the basic descriptive statistics
for the variables. It is found that the trade values
and net buy ratio of U.S. and tax haven zones are
more volatile than those of all foreigners. This means that the funds of tax haven zones show more active investment activities than those in other areas. And the active movement of U.S.
funds runs counter to the general belief.
4. Empirical Results
4.1 Effect of Foreign Investors
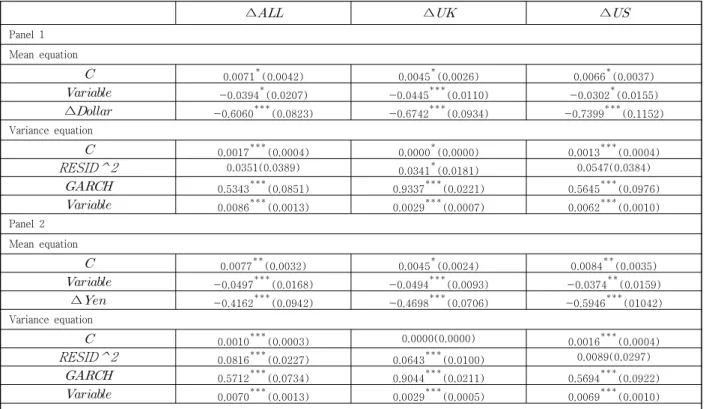
[Table 2] shows the effects of foreign investors' trade value by nationality on KOSPI returns and volatility, using GARCH(1,1).
In the variance equation of Panel 1 with
∆
as an explanatory variable,
∆statistically significantly increases the volatility of
∆ , and in the variance equation of Panel 2
with
∆as an explanatory variable,
∆also statistically significantly increases the volatility of
∆. But the coefficients are quite small. These results imply that foreigners' investment activities increase the volatility of the Korean stock market a little, but it cannot be said that the impact is obvious.
In the mean equation, the increase of
∆has a negative effect on
∆. In general, it is well known that stock returns increase as the trade volume increases [21]. However, this analysis shows contradictory results. It is often observed that there is a large selling trend by foreign investors when unfavorable asymmetric expectations in the international financial market arise. In other words, if foreign investors acquire unfavorable asymmetric information before Korean
Mean Median Max Min S.D.
Panel 1
1)∆ 0.0067 0.0073 0.6758 -0.6614 0.1867
∆ 0.0084 0.0210 0.6076 -0.7239 0.2095
∆ 0.0041 0.0104 0.8755 -0.6629 0.2235
0.0140 0.0054 0.3122 -0.1845 0.0778
-0.0150 -0.0184 0.2716 -0.3661 0.0808
0.0264 0.0225 0.5505 -0.3767 0.1484
∆ 0.0074 0.0088 0.2189 -0.2631 0.0676
∆ -0.0007 -0.0017 0.1381 -0.1647 0.0301
∆ -0.0003 -0.0042 0.1737 -0.1151 0.0351
Panel 2
2)∆ 0.0032 0.0136 0.5015 -0.5741 0.1922
∆ 0.0010 0.0411 0.4757 -0.7412 0.2237
∆ -0.0068 -0.0225 0.6930 -0.4918 0.2585
∆ 0.0051 -0.0249 0.6774 -0.4693 0.2932
-0.0029 0.0010 0.0816 -0.1176 0.0374
-0.0039 -0.0037 0.0602 -0.0778 0.0360
0.0076 0.0126 0.2166 -0.2721 0.1096
0.0138 0.0108 0.2782 -0.3468 0.1168
0.0176 0.0147 0.3282 -0.1717 0.0798
-0.0108 -0.0138 0.2999 -0.2125 0.0996
∆ 0.0053 0.0076 0.1337 -0.1436 0.0468
∆ 0.0142 0.0197 0.1436 -0.1067 0.0510
∆ -0.0011 -0.0005 0.0436 -0.0686 0.0229
∆ 0.0018 0.0029 0.0654 -0.0567 0.0263
Note: 1) Period: Nov. 1998 to Dec. 2020 2) Period: Jul. 2015 to Dec. 2020
Table 1. Basic Descriptive Statistics
investors and invest based on it, they show strong herd behavior as informed traders.
∆
and
∆also have a negative effect on
∆. This implies that foreign investors seem to be sensitive to the exchange rates.
Another possible reason for the result may be the effect of reflecting the dollar carry trade or yen carry trade in the Korean stock market. The global carry trade acts as an unstable factor in the international financial market. In particular, in the process of liquidating the carry trade in the regime of the financial crisis, volatility spillover between financial assets was observed [22]. It is noteworthy that the movement of
∆,
∆and
∆, seem to be quite similar, but the conditional volatility of
∆displays a higher degree of persistence than others. This means that once a volatility shock occurs, it will last relatively longer. And the explanatory power of the models with
∆as an independent variable are similar
to those of the models with
∆.
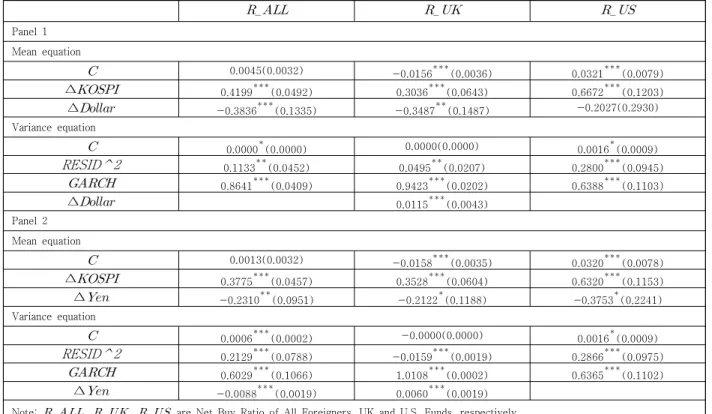
[Table 3] shows the effect of KOSPI returns on net buy ratio by nationality, using GARCH(1,1).
∆
has a positive effect on
,
and
∆
. It implies that the trading behaviors of all foreign investors, UK funds and U.S. funds show a positive feedback trading. Otherwise, the correlation of KOSPI returns and their net buy ratio is positive. Both the dollar and the yen have a negative effect on
and
. This indicates that foreign investors and UK funds are sensitive to exchange rate movements. However, the dollar has no statistically significant effect on the ratio of U.S. funds. It implies that U.S. funds are insensitive to the movement of the dollar.
4.2 Effect of Tax Haven Zone Funds Tax haven zone funds are thought to be more sensitive to international financial market trends
∆ ∆ ∆
Panel 1 Mean equation
0.0071 (0.0042) 0.0045 (0.0026) 0.0066 (0.0037)
-0.0394 (0.0207) -0.0445 (0.0110) -0.0302 (0.0155)
∆ -0.6060 (0.0823) -0.6742 (0.0934) -0.7399 (0.1152) Variance equation
0.0017 (0.0004) 0.0000 (0.0000) 0.0013 (0.0004)
RESID^2 0.0351(0.0389) 0.0341 (0.0181) 0.0547(0.0384)
0.5343 (0.0851) 0.9337 (0.0221) 0.5645 (0.0976)
0.0086 (0.0013) 0.0029 (0.0007) 0.0062 (0.0010)
Panel 2 Mean equation
0.0077 (0.0032) 0.0045 (0.0024) 0.0084 (0.0035)
-0.0497 (0.0168) -0.0494 (0.0093) -0.0374 (0.0159)
∆ -0.4162 (0.0942) -0.4698 (0.0706) -0.5946 (01042)
Variance equation
0.0010 (0.0003) 0.0000(0.0000) 0.0016 (0.0004)
RESID^2 0.0816 (0.0227) 0.0643 (0.0100) 0.0089(0.0297)
0.5712 (0.0734) 0.9044 (0.0211) 0.5694 (0.0922)
0.0070 (0.0013) 0.0029 (0.0005) 0.0069 (0.0010)
Note: : ∆ Trade Value of All Foreigners, UK and U.S. Funds, respectively.
Period: Nov. 1998 to Dec. 2020 Parenthesis are standard errors.
*, **, *** indicate significance at 10%, 5% and 1% levels, respectively.
Table 2. Effect of Trade Value by Nationality on KOSPI Returns and Volatility
than others. Several variables can be considered to measure sensitivity. In this study, NASDAQ is
Panel 1 Mean equation
0.0045(0.0032) -0.0156 (0.0036) 0.0321 (0.0079)
∆ 0.4199 (0.0492) 0.3036 (0.0643) 0.6672 (0.1203)
∆ -0.3836 (0.1335) -0.3487 (0.1487) -0.2027(0.2930) Variance equation
0.0000 (0.0000) 0.0000(0.0000) 0.0016 (0.0009)
RESID^2 0.1133 (0.0452) 0.0495 (0.0207) 0.2800 (0.0945)
0.8641 (0.0409) 0.9423 (0.0202) 0.6388 (0.1103)
∆ 0.0115 (0.0043)
Panel 2 Mean equation
0.0013(0.0032) -0.0158 (0.0035) 0.0320 (0.0078)
∆ 0.3775 (0.0457) 0.3528 (0.0604) 0.6320 (0.1153)
∆ -0.2310 (0.0951) -0.2122 (0.1188) -0.3753 (0.2241)
Variance equation
0.0006 (0.0002) -0.0000(0.0000) 0.0016 (0.0009)
RESID^2 0.2129 (0.0788) -0.0159 (0.0019) 0.2866 (0.0975)
0.6029 (0.1066) 1.0108 (0.0002) 0.6365 (0.1102)
∆ -0.0088 (0.0019) 0.0060 (0.0019)
Note:
,
,
are Net Buy Ratio of All Foreigners, UK and U.S. Funds, respectively.
Period: Nov. 1998 to Dec. 2020 Parenthesis are standard errors.
*, **, *** indicate significance at 10%, 5% and 1% levels, respectively.
Table 3. Effect of KOSPI Returns on Net Buy Ratio by Nationality
∆ ∆ ∆ ∆
Panel 1 Mean equation
0.0183(0.0208) -0.0056(0.0238) 0.0020(0.0300) -0.0467 (0.0192)
∆ -1.1456 (0.5370) -0.3483(0.2202) -1.8209 (0.2767) -1.4192 (0.5612)
∆ 0.2439(1.1721) 2.2129 (0.0102) 2.5958 (0.0057) -0.8493(0.5779) Variance equation
0.0169(0.0204) 0.0050 (0.0021) 0.0083 (0.0026) 0.0342 (0.0073)
RESID^2 0.1874(0.2693) -0.2852 (0.0593) -0.2850 (0.0781) -0.3173 (0.0576)
0.2644(0.6810) 1.1615 (0.1079) 1.1468 (0.1140) 0.9472 (0.0593) Panel 2
Mean equation
0.0161(0.0204) 0.0118(0.0258) -0.0250(0.0277) -0.0445(0.0345)
∆ -1.0608 (0.5396) -1.2833 (0.3174) -1.6657 (0.0269) -0.8930 (0.5052)
∆ 0.4469(1.0706) 1.5977 (0.7020) 2.4122 (0.0010) 0.1349(0.1475)
Variance equation
0.0168(0.0188) 0.0080 (0.0020) 0.0088 (0.0022) 0.0296 (0.0121)
RESID^2 0.1976(0.2591) -0.1965 (0.0491) -0.2959 (0.0539) -0.2480 (0.1066)
0.2586(0.6214) 1.0178 (0.0609) 1.1456 (0.0813) 0.9066 (0.1604) Note: ∆ , ∆ , ∆ , ∆ are ∆ Trade Value of All Foreigners, Luxembourg, Ireland, and Cayman Islands Funds, respectively.
Period: Jul. 2015 to Dec. 2020 Parenthesis are standard errors.
*, **, *** indicate significance at 10%, 5% and 1% levels, respectively.
Table 4. Effects of NASDAQ and Exchange Rates on Trade Values of Tax Haven Zone Funds
selected as a representative variable. [Table 4]
shows the effects of NASDAQ and the exchange rates on the trade values of tax haven zone funds, using GARCH(1,1). Generally,
∆has a negative effect on the trade values of foreign investors.
∆and
∆are sensitive to
∆
and
∆, but
∆and
∆are not. The conditional volatilities of
∆and
∆
display a higher degree of persistence than
∆
and
∆.
The results imply that the investment behaviors of tax haven zone funds may be different from those of other foreign investors, even though the behavior of Cayman Islands funds, which are estimated to include many Korean investors, may not be different than other tax haven zone funds. In other words, Cayman Islands funds are not significantly different from the investment behaviors of total foreigner investors.
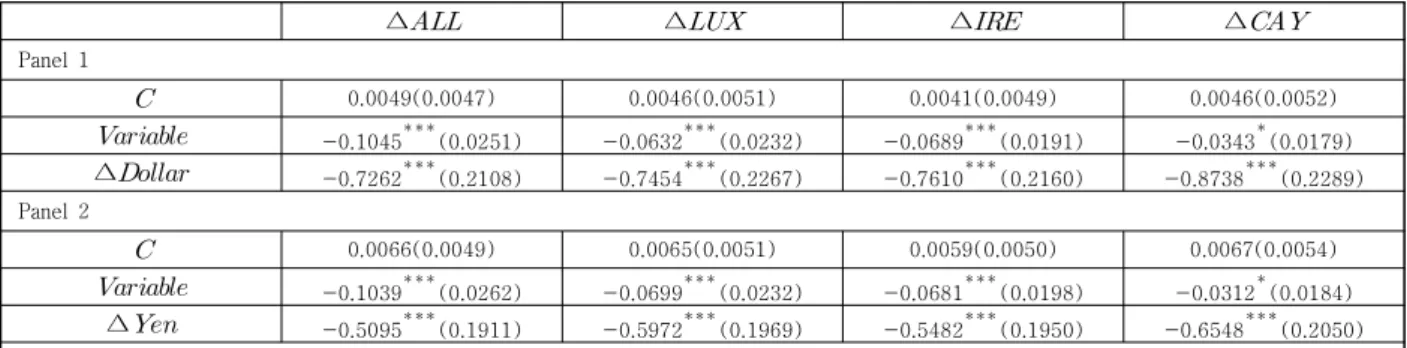
[Table 5] shows that the increase in trade value by total foreign investors and tax haven zone funds has a negative effect on KOSPI returns, using multiple regression. It is interesting that such negative effects do not differ significantly by nationality. Considering [Table 2]
and [Table 4] together, it can be said that foreign investors show common strong herd behavior regardless of nationality. In particular, if the NASDAQ falls and exchange rates rise, the trade
values of Luxembourg and Ireland funds would be increased so that they have a negative effect on
∆. But this linkage structure does not apply to
∆and
∆. This means that the two nations' tax haven funds, the Luxembourg and Ireland funds, are more sensitive to exchange rate changes than other foreign investors.
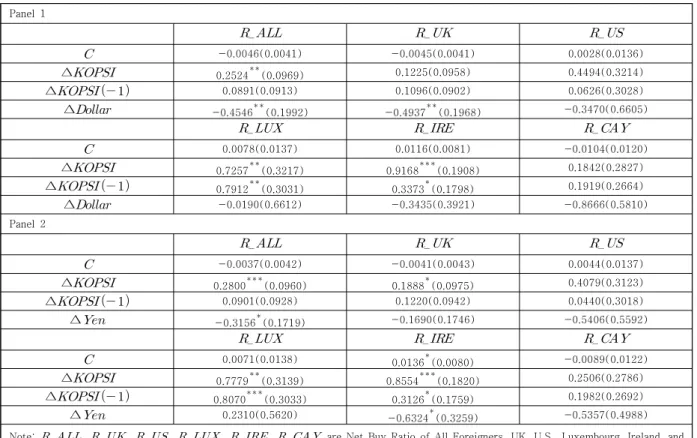
[Table 6] shows the effect of the KOSPI returns on net buy ratios including tax haven zone funds, using the distributed lag model.
∆and
∆
have meaningful positive effects on
and
. It implies that the two nations' tax haven funds are still positive feedback investors.
∆or
∆ has also a positive effect on
and
(Panel 2). On the other hand,
∆and
∆ do not have a statistically significant positive effect on
(Panel 1),
and
. It is confirmed again that the behavior of Cayman Islands funds is different from that of the two nation's tax haven funds and is similar to that of all foreigners. The finding that
(Panel 1),
and
do not show statistically significant positive feedback trading can be evaluated to have some implications, considering some recent studies showing that foreigners' investment behavior is changing. Also, the Korean economy has recently become less dependent on Japan for trade. Therefore, there is no tendency for the yen to be more explainable than the dollar
∆ ∆ ∆ ∆
Panel 1
0.0049(0.0047) 0.0046(0.0051) 0.0041(0.0049) 0.0046(0.0052)
-0.1045 (0.0251) -0.0632 (0.0232) -0.0689 (0.0191) -0.0343 (0.0179)
∆ -0.7262 (0.2108) -0.7454 (0.2267) -0.7610 (0.2160) -0.8738 (0.2289)
Panel 2
0.0066(0.0049) 0.0065(0.0051) 0.0059(0.0050) 0.0067(0.0054)
-0.1039 (0.0262) -0.0699 (0.0232) -0.0681 (0.0198) -0.0312 (0.0184)
∆ -0.5095 (0.1911) -0.5972 (0.1969) -0.5482 (0.1950) -0.6548 (0.2050)
Note: : ∆ Trade Value of All Foreigners, Luxembourg, Ireland, and Cayman Islands Funds, respectively.
Period: Jul. 2015 to Dec. 2020 Parenthesis are standard errors.
*, **, *** indicate significance at 10%, 5% and 1% levels, respectively.
Table 5. Effect of Trade Value of Tax Haven Zone Funds on KOSPI Returns
in analyzing the Korean stock market.
5. Conclusion
This study is the first and only one to analyze whether information on trade amount by nationality has specific characteristics. The findings are summarized as follows.
First, information on the trade amounts of foreign investors is identified as a meaningful variable. The increase in trading by foreign investors has a negative effect on stock returns.
There is no significant difference in these negative effects by nationality. This implies that foreign investors show strong herd behavior regardless of nationality.
Second, foreigners' investment activities increase stock price volatility, but the impact is
not significant.
Third, the behavior of foreign investors is still positive feedback. However, this study found signs that positive feedback behavior may be changing, especially for funds of the United States and the Cayman Islands. Considering some recent studies suggesting that positive feedback behavior is changing, this finding has some implications.
Finally, tax haven zone funds may have different investment strategies than other foreign investors. However, Cayman Islands funds, which are estimated to be closely related to Korea, are different from Luxembourg and Ireland funds. In other words, Cayman Islands funds are not significantly different than the investment behaviors of all foreigners.
These findings undermine the fundamentals of the equity home bias theory. In practice, it can
Panel 1
-0.0046(0.0041) -0.0045(0.0041) 0.0028(0.0136)
∆ 0.2524 (0.0969) 0.1225(0.0958) 0.4494(0.3214)
∆ 0.0891(0.0913) 0.1096(0.0902) 0.0626(0.3028)
∆ -0.4546 (0.1992) -0.4937 (0.1968) -0.3470(0.6605)
0.0078(0.0137) 0.0116(0.0081) -0.0104(0.0120)
∆ 0.7257 (0.3217) 0.9168 (0.1908) 0.1842(0.2827)
∆ 0.7912 (0.3031) 0.3373 (0.1798) 0.1919(0.2664)
∆ -0.0190(0.6612) -0.3435(0.3921) -0.8666(0.5810) Panel 2
-0.0037(0.0042) -0.0041(0.0043) 0.0044(0.0137)
∆ 0.2800 (0.0960) 0.1888 (0.0975) 0.4079(0.3123)
∆ 0.0901(0.0928) 0.1220(0.0942) 0.0440(0.3018)
∆ -0.3156 (0.1719) -0.1690(0.1746) -0.5406(0.5592)
0.0071(0.0138) 0.0136 (0.0080) -0.0089(0.0122)
∆ 0.7779 (0.3139) 0.8554 (0.1820) 0.2506(0.2786)
∆ 0.8070 (0.3033) 0.3126 (0.1759) 0.1982(0.2692)
∆ 0.2310(0.5620) -0.6324 (0.3259) -0.5357(0.4988)
Note:
,
,
,
,
,
are Net Buy Ratio of All Foreigners, UK, U.S., Luxembourg, Ireland, and Cayman Islands Funds, respectively.
Period: Jul. 2015 to Dec. 2020 Parenthesis are standard errors.
*, **, *** indicate significance at 10%, 5% and 1% levels, respectively.
Table 6. Effect of KOSPI Returns on Net Buy Ratio Including Tax Haven Zone Funds
be said that the usefulness of the behavioral economics approach of trend following is diminishing because there are signs of change in the positive feedback trading of foreign investors.
This paper has limitations because data on tax haven zone funds are short-circuited in the middle and these time series are much shorter than those of the UK and United States. If more data are compiled in the future, it is expected that a more in-depth analysis will be possible. In addition, although this study only analyzed the KOSPI market, it is expected that more useful information on the investment trends of foreigners by nationality can be obtained if the KOSDAQ market is also analyzed.
REFERENCES
[1] K. Ardalan. (2019). Equity Home Bias: A Review Essay, Journal of Economic Surveys, 33(3), 949-967.
DOI: 10.1111/joes.12302.
[2] H. Choe, B. C. Kho & R. M. Stulz. (2005). Do Domestic Investors Have an Edge? The Trading Experience of Foreign Investors in Korea, The Review of Financial Studies, 18(3), 795-829.
DOI: 10.1093/rfs/hhi028.
[3] L. Sun. (2016). Foreign Equity Investors and Momentum Profits: Evidence from Korea, Journal of Money & Finance, 30(1), 27-58.
DOI: 10.21023/JMF.30.1.2.
[4] S. Gulzar, G. M. Kayani, H. Xiaofeng, U. Ayub & A.
Rafique. (2019). Financial Cointegration and Spillover Effect of Global Financial Crisis: A Study of Emerging Asian Financial Markets, Economic research-Ekonomska Istraživanja, 32(1), 187-218.
DOI: 10.1080/1331677X.2018.1550001.
[5] U. E. Habiba, S. Peilong, W. Zhang & K. Hamid. (2020).
International Stock Markets Integration and Dynamics of Volatility Spillover between the USA and South Asian Markets: Evidence from Global Financial Crisis, Journal of Asia Business Studies, 14(5), 779-794.
DOI: 10.1108/JABS-03-2019-0071.
[6] Y. G. Shin. (2007). A Study of Lead-Lag Relationship between Stock Trading Value of Foreign Investor and Stock Index Using Cross-Correlation Analysis, Journal of the Korean Data Analysis Society, 9(6), 2815-2823.
[7] J. H. Min. (2009). Analysis of Changes in Foreigners' Stock Investment Behavior according to Changes in
the International Investment Environment, Monthly Bulletin, March, Bank of Korea. 50-79.
[8] K. S. Ko & K. H. Kim. (2010). The Dynamic Relationship between Stock Returns and Investors' Behavior: Trading Hour and Non-trading Hour Analysis, The Korean Journal of Financial Management, 27(2), 145-167.
[9] J. H. Kim. (2013). An Analysis on the Impact of Investor's Information Superiority and Negative Feedback Trading on Stock Return, Korean Journal of Financial Studies, 42(4), 667-698.
[10] S. Y. Jung, S. H. Jin & S. K. Cha. (2016). Investment Propensity of Foreign Investors and Information Asymmetry, Korean International Accounting Review, 68, 71-101.
[11] C. W. Yang. (2015). The Impact of Capital Flows from Tax Havens on the Korean Stock Market, Asian Review of Financial Research, 28(2), 195-234.
[12] Y. M. Kim & G. J. Jo. (2019). The Impact of Foreign Investors on the Stock Price of Korean Enterprises during the Global Financial Crisis, Substainability, 11(6), 1-13.
DOI: 10.3390/su11061576.
[13] O. Onishchenko & N. Ülkü. (2019). Foreign Investor Trading Behavior Has Evolved, Journal of Multinational Financial Management, 51, 98-115.
DOI: 10.1016/j.mulfin.2019.04.005.
[14] A. Khanthavit. (2020). Foreign Investors' Abnormal Trading Behavior in the Time of COVID-19, Journal of Asian Finance, Economics and Business, 7(9), 63-74.
DOI: 10.13106/jafeb.2020.vol7.no.9.063.
[15] K. B. Park & K. I. Park. (2015). Th Analysis of Herding Behavior among Each Type of Investors in Korean Stock Market, International Business Review, 19(4) 135-153.
[16] Y. H. Lee & K. S. Han. (2013). Foreign Investors Behavior and Financial Market Instability during the Global Financial Crisis, Journal of Korean Economics Studies, 31(3), 145-167.
[17] Y. W. Jeong & H. C. Chung. (2014). The Effect of Investors' Net Investments on Korean Stock Prices, The Korean Journal of Financial Management, 31(1), 105-143.
[18] M. Merli & T. Roger. (2013). What Derives the Herding Behavior of Individual Investors?, Finance, 34, 67-104.
DOI: 10.3917/fina.343.0067.
[19] S. Bikhchandani, D. Hirshleifer & I. Welch. (1992) A Theory of Fads, Fashion, Custom, and Cultural Change as Informational Cascades, The Journal of Political Economy, 100(5), 992-1026.
[20] B. J. Park. (2016). Investors' Herd Behavior and Its
Relation with Volatility in the Korean Stock Market,
Economic Analysis, 22(3), 70-93.
[21] H. Shefrin & M. Statman. (1985). The Disposition to Sell Winners Too Early and Ride Losers Too Long:
Theory and Evidence, The Journal of Finance, 40(3), 777-790.
DOI: 10.2307/2327802.
[22] S. K. Kang. (2013). The Impact of the Yen Carry Trade on the Korea Stock Price Volatility: Focused on Global Financial Crisis, The Korean Journal of Financial Management, 30(4), 65-85.
조 재 호(Jae-HoCho) [정회원]