Further Empirical Analysis on Corporate R&D Intensity for KOSDAQ Listed SMEs in the Era of the Post Global Economic Crisis
Hanjoon Kim
Division of Business Administration, Hoseo University
국제금융위기 이후의 코스닥 상장 중소기업들의 연구개발비에 대한 실증적 심층분석
호서대학교 경영대학 경영학부 김한준
Abstract The study analyzed the financial determinants of corporate R&D intensity that require more attention from academics and practitioners in the Korean capital market. Domestic small and medium enterprises (SMEs) may face with developing substitutes by making more R&D investments in scale and scope, given the unprecedented economic conditions such as the limitation of importing core components and materials from other nation(s). KOSDAQ-listed SMEs were selected as sample data, whose R&D expenditures may be less than those of large firms during the post-global financial turmoil period (2010~2018). Static panel data model was applied, along with Tobit and stepwise regression models, for examining the validity of results. Logit, probit, and complementary log-log regressions were also employed for a relative analysis. R&D expenditures in the prior year, the interaction effect between the previous R&D intensity and high-tech sector, firm size, and growth rate were significant to determine R&D intensity. Moreover, a majority of explanatory variables were found to change between the years 2011 and 2018, while time-lagged effects between the R&D intensity and growth rate exist. Results of the study are expected to be used for future research to detect optimal levels of R&D expenditures for the value maximization of SMEs.
요 약 본 논문은 국내 자본시장에서 이론적 그리고 실무적인 측면에서 추가적 연구가 필요하다고 판단되는 기업의 연구개발비 비중에 대한 재무적 결정요인에 대한 분석이다. 최근 국내에 수입되는 핵심 부품 및 재료 등에 대한 다른 국가(들)의 전례없는 제한과 관련된 경제 상황을 감안하여, 국내 중소기업들도 규모와 범위의 측면에서 적극적인 연구개 발비 투자를 통한 대체재 개발문제에 당면하고 있다고 판단된다. 연구개발비 투자가 대기업들과 비교하여 상대적으로 미약하다고 판단되는 코스닥 상장 중소기업들을 표본자료로 선정하였고, 연구기간은 국제금융위기 이후의 기간 (2010 넌~2018년)으로 설정되었다. 패널자료모형이 활용되었고, 토빗모형과 단계적회귀분석모형도 응용되었다. 상대적인 분 석으로서 로짓, 프로빗, 보충적 로그-로그모형 등이 활용되었다. 전년도 연구개발비 지출 변수, 그리고 동 변수와 고부가 가치 산업 간의 교호작용, 기업 규모 그리고 성장성 등이 연구개발비 비중에 유의미한 영향을 주었다. 전체 설명변수들 중, 대다수의 변수들이 비교 연도들 (즉, 2011년과 2018년)간에 유의미한 차이를 나타내었고, 표본기업들의 연구개발비 투자가 매출액 변화로 실현되기 위한 시간적 차이가 통계적으로 존재함이 판명되었다. 본 연구의 결과들이 향후 국내 중소기업들의 기업가치 극대화를 위한 최적의 연구개발비 수준에 대한 분석에서도 유익하게 활용될 수 있기를 기대한다.
Keywords : Financial Characteristics, Industry Influence, Korean Capital Market, Research &
Development, Time-lagged Effect
*Corresponding Author : Hanjoon Kim(Hoseo Univ.) email: [email protected]
Received October 15, 2020 Revised December 7, 2020
Accepted February 5, 2021 Published February 28, 2021
1. Introduction
The study addresses one of the subjects in modern finance in relation to corporate research
& development (henceforth, R&D) expenditures for the firms with headquarters in the Korean capital market. That is, given that unprecedented situation of the ongoing restrictions on importing core components or materials from other nation(s), that are required to domestically produce finished or work-in-process goods, vast amounts of R&D investments are scheduled to be made at the government and corporate levels.
Accordingly, it seems to be of concern to empirically detect factors or components composing R&D expenditures for the domestic firms, which may eventually be used to attain the optimal level of R&D expenditures. As for the recent data or information on the domestic R&D activities, it was summarized by Ministry of Science and ICT (Information, Communication and Technology) of the Korean government that the total amount of R&D investments were domestically estimated at KRW69.4055 trillion (about US$ 59.8billion) during year 2016, which has made south Korea positioned in the top 5th rank among total OECD (Organization for Cooperation and Development) member countries[1]. The ratio of R&D expenditures scaled by national GDP (Growth Domestic Product) was recorded as 4.24% in the year, which ranked 2nd on a global basis. The Ministry also recently announced one of the upcoming plans that, in the total amount of KRW335.9 billion (about US$ 27.99 million) scheduled to be invested in the sectors of core components, parts and equipment developments in the year 2020, 70% of the total amounts is planned to be made for R&D investments esp. to develop the “NANO and Core-component”[2].
Primary motivations to conduct this empirical study are as follows: First, as an extension of the previous literature inclusive of Kim [3], further
investigations inclusive of industry effects and other primary hypothesis postulations are empirically analyzed and tested to identify financial determinants or differences for the sample firms. It was presented by Ministry of Science and ICT [1] that the percentage of R&D expenditures in total sales in corporate sector was estimated at 3.17%, in which the proportion of R&D investments made by domestic large corporations was counted as 75.52%, in comparison with that of counterparts of small and medium enterprises (SMEs). Accordingly, there seems to be less research conducted so far for the sample dataset of the domestic SMEs in terms of R&D activities, when compared to those of the previous literature utilizing large enterprises (LEs) in the international or domestic perspectives. Therefore, the SMEs with headquarters in the domestic capital market and listed on the KOSDAQ (Korea Securities Dealers Association Automated Quotation) exchange are chosen to be the sample of this particular study.
Moreover, in comparison with counterparts of
KOSPI (Korea Composite Stock Price Index),
KOSDAQ listed firms that belong to a wide
spectrum of high-tech sectors including IT
industries, may be dependent upon the higher
level of R&D expenditures to achieve corporate
goal of maximizing profits. Second, three
hypotheses to identify industry effects are
postulated and empirically tested on an absolute
and a relative bases. In the first and last
hypotheses, each qualitative variable to represent
total sample domestic industries are employed in
each relevant model and results obtained from
the tests are compared with the findings of the
preceding studies for validity. Various
econometric methodologies are applied in each
model for estimation and the sample period for
this study is chosen to cover the era of the post
global economic (or financial) crisis to mitigate
or reduce financial spillover or after effects
arising from the turmoil. Lastly, besides the
aforementioned limitations of supply-demand chain to import core components or parts from other nation(s), it is essential or even imperative to identify financial antidotes of corporate R&D intensity for the SMEs in the domestic capital market. In other words, when compared to the LEs, they may be more vulnerable to possible recessionary or stagnant economic conditions that seem to be, in large part, attributable to the ongoing global pandemic of COVID-19.
Therefore, given the trade-off relationship between benefits and risks of R&D expenditures, in-depth analyses on financial components of the expenditures for the SMEs may contribute to achieving their optimal levels of R&D intensity, which may, in turn, enhance firm value or shareholders’ wealth.
2. Literature Review
In the section, previous literature in the subject of R&D expenditures, that has also frequently been cited in the previous studies including Kim [3], is reviewed in a chronological order.
In the study by Chan et al. [4], expected benefits and risks of corporate R&D investments in relation to share price was tested for the sample data of U.S. firms during the period of 1979 to 1985. They tested existence of systematic factors to account for a change of share price, based on type of R&D expenditures. The authors found that announcement on the increase of R&D expenditures for the sample firms were overall positive factor to increase market capitalization, while positive and negative earnings were not to be statistically different in determining firm value in the long-term run. In the study implemented by Perry and Grinaker [5], hypotheses were postulated that corporate earnings may be adjusted by incumbent management in the short term, if projected
earnings (in the current fiscal year) is estimated to deviate from its original objective. By using U.S. sample dataset for the period of 1972 to 1983, the author tested that changes in R&D expenditures may statistically be related with those in corporate earnings, on condition that management controls R&D spending to achieve a planned goal of earings. Lev and Sougiannis [6]
found that there seems to be a vast increase in
R&D investments for firms with headquarters in
developed or developing capital markets
inclusive of U.S. firms. Tthey presented that the
average duration of benefits from R&D
investment for the chemical and pharmaceutical
industries was 9 years, while that of the scientific
instruments industry was overall the shortest at 5
years. In the study by Chan et al. [7], a
relationship between a firm’s stock returns and
its R&D expenditures was empirically tested,
which consisted of all U.S. firms listed on the
NYSE, AMEX, and NASDAQ. On the market
reaction or stock returns, the results of the study
revealed that there was no difference between
the sample firms making R&D investments and
counterparts not investing in R&D activities from
a statistical viewpoint. In the meantime, Everhart
et al. [8] tested a relationship between long-term
corporate stock returns and operating
performance after announcement of corporate
R&D investments. The alphas in the estimated
models revealed their significance as a measure
for the abnormal return across models with
different sample groups. Moreover, based on the
sample data classified as high-tech, low-tech,
high-growth and low-growth firms, there were
generally statistically significant abnormal rates
of returns across all subsets of the sample firms,
where returns were estimated by using a
equal-weighted method. In another study by
Everhart et al. [9], a hypothesis such that the net
effects of corporate R&D expenditures are
beneficial to enhance firm value and also the
wealth of both shareholders and bondholders.
Definition Symbol Measurement R&D intensity in
the prior fiscal year
Lag_RD (R&D expensest-1) / salest-1
Squared variable
of Lag_RD Slag_RD (Lag_RD)2
Interaction between high-tech
firm and Lag_RD INTERRD
Categorical (or Dummy) variable between high-tech firm
and Lag_RD Firm size SIZE Natural logarithm of
sales amount
Market-value
Based Leverage: MLEVER
Book value of liabilities / (Book value of liabilities + Book Value of preferred equity +
Market value of common equity)
Profitability PFT
[EBIT (= Earnings before interest & taxes)
+ depreciation + amortization + R&D
expenses] / Total assets
Growth GROWTH
(Market value of common equity + Book
value of preferred equity) / Book value of
equity Change in cash
holdings CHOLD
(Cash & cash equivalentst - Cash &
cash equivalentst-1) / Total assetst
Foreign ownership FOS Foreign ownership in common equity
Business Risk VOLAT
3.3 x (EBIT / Total assets) + 1.0 x (Sales /
Total assets) + 1.4 x (Net income / Total assets) + 0.6 x (Market value of equity / Book
value of equity) Change in
tangible assets TASSET (Tangible assetst – Tangible assetst-1) /
Total assetst
Advertising
expenses ADVERT Advertising expenses / Total assets Table 1. Description of symbols and definitions for
explanatory variables (IDV)
Regarding the results, all of the returns from
stocks, bonds and firms revealed their statistically significant and positive abnormal returns for the announced increase sample during the sample period. As one of the recent studies, Kim [10]
tested the existence of the optimal level of corporate R&D spendings in the Korean capital market. Whereas KOSPI listed sample firms overall were not likely to possess an optimal level of R&D expense at the intra-industry level, statistically significant differences were detected at the inter-industry level. Lastly, Kim [3]
empirically tested to identify financial attributes that may statistically affect corporate R&D intensity (DV) for the KOSDAQ listed SMEs in the domestic capital market. The variables of R&D spending made in the prior year (Lag_DV) and the interaction effect between Lag_DV and a high-tech sector were found to be significant effects on R&D expenditures. Moreover, results from the study also provided evidence that there may exist a non-linear relationship between Lag_DV and DV and also a about or less than 3-year duration between corporate R&D investments and profitability realized for the SMEs.
3. Empirical Research Settings 3.1 Sampling Dataset and Proposed Variables
Sampling criteria to finalize KOSDAQ listed SMEs are described below, along with the proposed variables in Table 1. As presented earlier, they are analogous to those adopted for the preceding study of Kim [3] as an extension of the previous study for the purposes of comparability and consistency. First, data for all financial variables are available to cover at least from the year 2010 to 2018 (for 9 years) in the post global financial turmoil period. (For reference, the year 2010 was adopted as a baseline year.) Second, sample firms are listed on the KOSDAQ exchange at the end of the fiscal
year of 2018 and their data are included in the database of Kisvalue compiled by the NICE.
Third, data are collected on the basis of consolidated financial statements, if available.
and sample firms in the financial and regulated industries are excluded.
To recap, total number of sample firms are
finalized as 838, each of which belongs to one of the 25 domestic industries defined by the KSIC (Korea Standard Industry Code) or the KRX (Korea Exchange) classifications. Among the entire sample firms, large enterprises (LEs) and small and medium enterprises (SMEs) are grouped into 350 and 488 firms, respectively, that are divided by the criteria set by the Kisvalue database as of the fiscal year-end of 2019, which are also in accordance with those of the “Enforcement Decree of the Framework Act on Small and Medium Enterprises”. Followings are definitions and descriptions of the proposed variables to account for a dependent variable (DV), that is defined by the ratio of R&D expenditures to sales.
When selecting proposed or explanatory variables in Table 1, following considerations are empirically given to lessen or eliminate mis-specification or omission of relevant variables employed in each model, as described in Kim [3]. First, variables adopted in this study overall were empirically found to share commonalities with the previous literature.
Second, all the variables are supported by modern finance theory, Lastly, data for each proposed variable are available during the study period. To specify, the variable of Slag_RD is employed in the model of the study to investigate a non-linear relationship between Lag_RD and the level of corporate R&D expenses in the previous fiscal year. Business risk (VOLAT) is estimated by employing the measurement of Shi [11] which was derived from the well known Altman‘s Z-score in finance. As in study of Kim [3], INTERRD is adopted to represent an interaction effect between corporate R&D intensity of the prior fiscal year (i.e., Lag_RD) and classification of a firm in the high-tech sector. The criteria to categorize the sample firms between high-tech and low-tech sectors, follows the classifications done by Czarnitzki and S. Thorwarth [12], that are related to the
guidelines by the OECD (Organization for Economic Co-operation and Development).
3.2 Postulation of Hypotheses
In the section, three hypotheses are postulated to test for financial components to determine corporate R&D intensity for the sample firms.
<First Hypothesis>
H1: During the post global financial turmoil period (i.e., from 2011 to 2018), KOSDAQ listed SMEs (or LEs) may possess, on average, significant financial determinants (inclusive industry effects) to determine their corporate R&D intensity from a statistical perspective.
To conduct the hypothesis test, several econometric methodologies such as a static panel data model, Tobit regression model, robust regression model and stepwise regression model are separately applied for a robustness check.
Robust regression model was also applied for the purpose of winsorizing extreme values (i.e., outliers) while Tobit regression model was adopted by considering the dependent variable (i.e., DV) whose value is bounded from “0” to positive. Moreover, stepwise regression model was used to mitigate or limit the legitimate econometric problems of multicollinearity and autocorrelation related to error variance, as presented in Palenzuela and Bobillo [13].
<Second Hypothesis>
H1: Financial characteristics of KOSDAQ listed SMEs have significantly changed between the two comparison years (i.e., the year 2011 vs. 2018), both of which are included in the entire sample period after the global financial turmoil.
To detect any changes in financial profile
during the sample period (i.e., between the year
2011 and 2018) on a relative basis, binary
(dependent) choice models such as logistic
regression, probit regression, complementary
log-log (Clog-log) models were applied to test for
the hypothesis. General outline of the logistic
regression model is described as follows. [14]
P (the year 2018) = e
a+b¢x/ ( 1+ e
a+b¢x), where P (the year 2018) is the probability that a KOSDAQ listed sample firm has financial attributes in terms of the year 2018 and this probability is bounded between 0 and 1. It labels α and β as the intercept and vector of slope parameters, respectively. x is a vector of explanatory variables at each sample year.
By setting a probability to model as “1” for the year 2018 in comparison with the year 2011, financial components inclusive of industry dummy variables were statistically compared in each binary choice model. For reference, since the dataset for the year 2010 was used as a baseline one to calculate each relevant proposed variable, two separate years (i.e., 2011 vs. 2018) were made a comparison to detect changes in financial attributes.
<Third Hypothesis>
H1: In the investigated period, there may be time lagged effects between R&D intensity and corporate growth in sales, that may overall enhance the profitability of KOSDAQ listed SMEs.
It may be important to identify how long current or previous R&D investments may take in time to increase (or decrease) corporate sales.
Four time lagged variables for R&D intensity that represent each previous fiscal year (i.e., from Lag_RD to Lag_RD4) as well as the current one (DV) were employed in the models. The dependent variable of sales growth employed in the hypothesis test, is defined as annual growth rate of sales during the sample period. Moreover, the rationale to adopt a 5-year duration to test for time lagged effects (i.e., to use five time-lagged variables from DV to Lag_RD4) is consistent with the finding by Bowen et al. [15], such that financial ratios have, on average, a tendency to revert to industry means on a 5 year interval, as also described in Kim [3].
4. Analysis and Discussion 4.1 Results of First Hypothesis
The outcomes obtained form the first hypothesis test to detect financial components of R&D expenditures for KOSDAQ listed SMEs and LEs, are reported in Table 2 and Table 3, respectively.
IDV
Estimated coefficient (Random
effects)
Estimated coefficient (Tobit model)
Estimated coefficient
(Stepwise model)
Constant 0.555* 0.489* 0.396*
Lag_RD 0.261* 0.387* 0.334*
INTERRD 0.200* 0.201* 0.223*
SIZE -0.022* -0.020* -0.015*
MLEVER -0.014 -0.020 -0.021*
PFT 0.004 0.069* <N.A.>
GROWTH 0.001* 0.001* 0.001*
CHOLD -0.011 -0.021 <N.A.>
FOS 0.044 0.011 <N.A.>
VOLAT -0.001 -0.001 <N.A.>
TASSET -0.006 -0.008 <N.A.>
ADVERT 0.142 0.225* <N.A.>
IND15 0.067* 0.030 0.051*
IND19 0.142* 0.088* 0.135*
<Note> * indicates a statistical significance at the 5% and level.
<N.A> denotes a insignificance of the estimated coefficient at the 5% entry and deletion levels.
Table 2. Results of financial determinants to determine corporate R&D intensity for the SMEs during the era of the post global financial turmoil.
As described in the preceding section, five econometric methodologies were applied, but only three models are presented in Table 2, due to the limitations of the space in the table. The other two outcomes are available upon request.) As for the random effects and the pooled OLS models in the static panel data model, both of them are congruent in terms of identifying statistically significant financial factors at the 5%
level. To illustrate, only random effects model
and pooled OLS model in the static panel data
analysis were applied to test for the hypothesis
with a prior specification test of Breusch-Pagan test. The other panel data model of fixed effects one was not adopted due to time invariant characteristic of industry qualitative variable.
R-squred values of the models for the random effect model and the pooled OLS are 35.82% and 49.13% for the sample group of the SMEs, while those for the LEs are 36% and 69.54%, respectively. Moreover, for the former sample firms, the VIF (Variance Inflaltion Factor) for the explanatory variables finalized in the stepwise regression model is ranged from 1.02167 (for GROWTH) to 8.49473 (for Lag_RD), which are below 10 as a conventional criteria. Likewise, the range of the VIF for the LEs is between 1.06679 (for IND9 as the electric and electronic industry) and 4.44490 (for Lag_RD). Four variables (Lag_RD, INTERRD, SIZE and GROWTH) were found to be important to determine the R&D intensity for the SMEs. Considering the results across the models (inclusive of the other models such as Tobit, robust regression and stepwise regression models), these four variables were overall identified as significant financial determinants.
Moreover, only the industries such as IND15 (the professional, science and technology service industry) and IND19 (the transportation and shipping industry) seem to be significant factors to determine the level of R&D expenditures across models. For reference, the food and beverage industry was set as a baseline one.
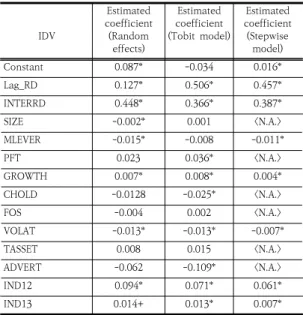
In comparison with the outcomes for the SMEs, financial factors to significantly affect corporate R&D expenses for the subset of the LEs were found to be Lag_RD, INTERRD, GROWTH and VOLAT across all or a majority of the models, as reported in Table 3. Accordingly, two subsets of the sample groups (i.e., SMEs and LEs) seem to have common components such as Lag_RD, INTERRD and GROWTH, all of which have positive relationship with the R&D intensity. Among the sample industries where the LEs belonged to, IND12 (the agriculture, mining
and fishing industry) and IND13 (the wholesale industry) showed positive influence to the dependent variable.
IDV
Estimated coefficient (Random
effects)
Estimated coefficient (Tobit model)
Estimated coefficient
(Stepwise model)
Constant 0.087* -0.034 0.016*
Lag_RD 0.127* 0.506* 0.457*
INTERRD 0.448* 0.366* 0.387*
SIZE -0.002* 0.001 <N.A.>
MLEVER -0.015* -0.008 -0.011*
PFT 0.023 0.036* <N.A.>
GROWTH 0.007* 0.008* 0.004*
CHOLD -0.0128 -0.025* <N.A.>
FOS -0.004 0.002 <N.A.>
VOLAT -0.013* -0.013* -0.007*
TASSET 0.008 0.015 <N.A.>
ADVERT -0.062 -0.109* <N.A.>
IND12 0.094* 0.071* 0.061*
IND13 0.014+ 0.013* 0.007*
<Note> * and + indicate statistical significances at the 5% and less than 6% levels. <N.A> denotes a insignificance of the estimated coefficient at the 5% entry and deletion levels.
Table 3. Results of financial determinants to determine corporate R&D intensity for the LEs
4.2 Results of Second Hypothesis
In the analysis for the SMEs to detect financial changes between the fiscal year 2011 to 2018, the results are reported in Table 4.
As presented in Table 4, most of the variables seem to have financially changed between the two comparison years for the SMEs, after controling industry effects. That is, except the variables of Lag_RD, INTERRD, TASSEET and ADVERT, they did reveal statistical significances to discriminate financial profile in a majority of the models between the year 2011 and 2018.
(The outcome of Clog-log with ascending order
was not reported in the table, but, the results are
mostly consistent with the findings of the other
models.) There may exist a non-linear
relationship between Lag_RD and the level of
corporate R&D expenditures in the previous
IDV Logit Probit Clog-log
Constant -28.534* -16.596* -17.567*
Slag_RD -2.221* -1.366* -1.141
Lag_RD 4.063 2.538 2.457
INTERRD 0.367 0.191 -0.168
SIZE 1.263* 0.732* 0.757*
MLEVER -3.872* -2.277* -2.374*
PROF -4.126* -2.558* -1.385
GROWTH 0.761* 0.418* 0.495*
CHOLD 2.785* 1.672* 1.882*
FOS 3.817* 2.260* 2.189*
VOLAT -1.276* -0.698* -0.848*
TASSET -1.008 -0.579 -0.508
ADVERT -3.170 -2.028 -2.534
Goodness of Fit 238.724* 234.369* 219.068*
<Note> * denotes a statistical significance at the 5% level in terms of the chi-square test. Each coefficient was estimated by the method of maximum likelihood (ML). The test for overall goodness of fit was performed by the likelihood ratio (LR) test and the Wald test was used for the significance of each coefficient.
Table 4. Results of binary choice models for the SMEs to identify financial factors changed between the year 2011 and 2018 in R&D intensity
IDV
Estimated coefficient (Random
effects model)
Estimated coefficient (Robust reg. model)
Estimated coefficient
(Stepwise reg. model)
Constant -4.074* -1.632* -2.234*
DV -1.133* -0.580* -1.111*
Lag_RD 2.436* 1.234* 2.256*
Lag_RD2 1.449* -0.213* 1.575*
Lag_RD3 0.605* 0.217* <N.A.>
Lag_RD4 -0.952* -0.378* -0.593*
INTERRD -1.798* -0.092 -1.571*
SIZE 0.163* 0.064* 0.093*
MLEVER -0.137 -0.057 <N.A.>
PROF 0.618* 0.766* 0.689*
CHOLD .0.436* 0.116* 0.457*
FOS -0.131 -0.151* <N.A.>
VOLAT 0.001 0.001 <N.A.>
TASSET 0.275 0.204* 0.334*
ADVERT -0.547 -0.125 <N.A.>
IND13 0.468* 0.105* 0.275*
<Note> * indicates a statistical significance at the 5% and level.
<N.A> denotes a insignificance of the estimated coefficient at the 5% entry and deletion levels.
Table 5. Results of time lagged effects of corporate R&D investments on growth in sales for the SMEs
fiscal year. Moreover, even if the results are not presented in the table, it was found that there were no changes in industry classifications for the sample firms between the two years, that are indicated by no statistical significances of the industry dummy variables across all the models.
4.3 Results of Third Hypothesis
Concerning the results of corporate R&D investments that may be realized in growth in sales with time lagged effects, analogous econometric methodologies also used as in the first hypothesis, whose results are presented in Table 5.
It was found that there exist time lagged effects between the R&D investments and growth rate for the SMEs. That is, after controling for the industry effects, Lag_RD, Lag_RD4 as well as DV showed statistically significant impacts on the annual growth in sales with consistent signs of the estimated coefficients across all models. Only
one industry of the wholesale one (IND13) had a positively significant influence on the growth rate amongst the sample domestic industries. The constant term of each model was found to be significant, as reported in Table 5. The adjusted R-square in the stepwise regression model was also relatively small as 0.1187, even if overall goodness of fit of the model was significant with F-value of 27.28 (p-value < 0.0001). Therefore, there may be alternatives to adopt other variables employed in the models, on condition that financial data are available and degree of freedom is not significantly affected by additional variables.
4.4 Discussion
With respect to the first hypothesis test, the
findings of the preceding studies seems to be
empirically corroborated by this study. In the
present study as an extension of Kim [3], the
proxy variables such as Lag_RD, INTERRD and GROWTH consistently showed pronounced effects to determine corporate R&D intensity for the subsets of the SMEs and the LEs, even after controling industry possible influence. To illustrate, Lag_RD as prior year’s R&D expenditures representing corporate investment opportunity set had been adopted by the study of Perry and R. Grinaker [5]. It presented that firms with a larger R&D growth opportunities tend to spend more in the following years on R&D activities than their counterparts that are similar in all aspects except the intensity of R&D.
Therefore, the variable of Lag_RD that was found to be consistently significant across the present and the previous studies of Kim [3] and Perry and R. Grinaker [5], may suggest that a firm’s level of R&D expenditures in the previous year is positively associated with that of the current year in the U.S. and Korea, regardless of controling unique influence of each industry in the models.
Second, based on the positive effect of GROWTH on the R&D intensity as reported in Table 2 and Table 3, it seems that firm’s growth potentials are, on a virtuous cycle, supported by the R&D investments made by both subsets of the sample firms during the investigated period. Third, in comparison with the SMEs, one of the distinguished phenomena applicable to the LEs is that corporate R&D activities are inversely related to VOLAT as listed in Table 3. In accordance with the theory of modern finance, business risk of a firm in a mature stage is lessened by stable cash flows and also the mature firm becomes large in size through diversification or takeover activities. Accordingly, the finding of the negative relationship between VOLAT and R&D intensity for the LEs may imply that they are in more mature stage that requires less R&D expenditures due to a lower level of investment opportunities than their counterparts of the SMEs. Finally, it is interesting to identify that, among the sample domestic industries, only
a few industries revealed their positive influence on R&D intensity, as previously described. The phenomenon may imply that most KOSDAQ listed firms across the domestic industries may not, on average, attain to the optimal level of R&D expenditures yet due to a few or weak significant differences among the industries, as presented by Varela and Limmack [16].
As for second hypothesis, there may exist a non-linear relationship between Lag_RD and a classification of financial profile. As corporate R&D spending in the prior year becomes larger, the probability of the SMEs to be in a financial profile of the year 2018, increases. But, the odds decrease if the intensity of the previous R&D expenditures reaches beyond a certain point.
The phenomenon suggests that, in terms of the optimal level of R&D expenditures, the SMEs are likely to have spent relatively excessive R&D expenses, even after the global financial crisis than those in the year 2018. Moreover, the SMEs overall seem to recover financial conditions, as the effects of the global economic turmoil gradually disappeared. That is, the results indicate that SIZE, FOS and CHOLD increased, while MLEVER decreased from the year 2011 to 2018. However, it is of concern to find that corporate profitability for the SMEs appears to be lower in the year 2018 than in 2011, as indicated by the significant variable of PROF with a negative sign in Table 4. This phenomenon seems to be corroborated by the finding of lower business risk (VOLAT) as a financial profile in the year 2011. Consequently, one of the current financial issues that the SMEs face with, is to enhance financial profitability at least more that the previous level in the onset of the financial turmoil crisis. Moreover, the SMEs seem to maintain a higher level of cash holding (CHOLD) in the year 2018 as precautionary motive to prevent possible shortage of liquidity.
Finally, the results of the third hypothesis test
are reported in Table 5. In the study of Lev and
Sougiannis [6], the average duration of benefits of R&D expenditures was found to be 9 years for the chemical and pharmaceutical industry (as the longest year), while the scientific instruments industry had the shortest duration of 5 years. In this study, two variables to represent current R&D intensity (DV) and Lag_RD4 had negatively significant impacts on corporate growth in sales.
These may arise from that R&D investments made in the two separate years did not function as originally planed, to enlarge market shares (in sales) to increase profitability. Consequently, benefits of the R&D expenditures made by the SMEs in the years appear to be more than offset by the risk of the R&D spendings associated by premature or obsolete products that may not contribute to increasing growth in sales. In contrast, the average time lagged effect of the R&D investments has a duration of one year to be realized in sales for the SMEs. Therefore, given the ongoing plans on R&D investments at the government or corporate level as presented in Kim [17], that are larger in scale and scope than ever, the relatively short time lagged effect may suggest an important catalyst for the SMEs to continue their R&D activities for maximizing corporate profit.
5. Concluding Remarks
This study addresses one of the financial issues in modern finance, which may need to draw more attention to academics and practitioners.
As an extension of the previous literature inclusive of Kim [3], three separate hypotheses, are postulated for further investigations. Lag_RD, INTERRD, SIZE and GROWTH were found to be significant factors to determine the R&D intensity for the SMEs, whereas Lag_RD, INTERRD, GROWTH and VOLAT showed importance on the dependent variable for the LEs. Also, a majority of the variable other than
Lag_RD, INTERRD, TASSEET and ADVERT, were financially changed between the two comparison years for the SMEs. Finally, time-lagged variables of Lag_RD, Lag_RD4 as well as DV had statistically significant effects on corporate growth rate in sales for the SMEs. The study may suffer from the legitimate and redundant weaknesses by adopting different empirical research settings such as employing different sample data and time reference, when compared with those of the previous research. However, the results of this study may provide financial catalysts for the SMEs to maximize profits by attaining to the optimal level of R&D expenditures, which are beneficial to interested parties at the governmental and corporate levels.
References
[1] Ministry of Science and ICT (2017). Report on the 2016 R&D Activities [Internet]. Available From:
https://www.msit.go.kr/web/msipContents/contentsVi ew.do?cateId=_policycom2&artId=1368919 (accessed July 20, 2020)
[2] Ministry of Science and ICT (2019). Report on the Plan of Technological Development of NONO and Core Components in 2020 [Internet]. Available From:
https://www.msit.go.kr/web/msipContents/contentsVi ew.do?cateId=_policycom2&artId=2429173 (accessed July 31, 2020)
[3] H. Kim, “Empirical Analyses on Financial Attributes of Research and Development Expenditure for KOSDAQ-listed SMEs”,
Journal of SME Policy, Vol.5, No.1, pp.43-88, Spring 2020.
[4] S. Chan, K. Martin, J. Kensinger, “Corporate Research and Development Expenditures and Share Value”,
Journal of Financial Economics,Vol.26, pp. 255-276, 1990.
DOI: https://doi.org/10.1016/0304-405X(90)90005-K [5] S. Perry and R. Grinaker, “Earnings Expectations and
Discretionary Research and Development Spending”,
Accounting Horizons, Vol.8, No.4, pp. 43-51. 1994.
[6] B. Lev and T. Sougiannis, “The Capitalization, Amortization, and Value-relevance of R&D”,
Journal of Accounting and Economics, Vol.21, pp.107-138, 1996.
DOI: https://doi.org/10.1016/0165-4101(95)00410-6
[7] L. Chan, J. Lakonishok, T. Sougiannis, “The Stock
Market Valuation of Research and Development Expenditures”,
Journal of Finance, Vol.56, No.6, pp.
2431-2456, 2001.
DOI: https://doi.org/10.1111/0022-1082.00411 [8] A. Everhart, W. Maxwell, A. Siddique, “An Examination
of Long-term Abnormal Stock Returns and Operating Performance Following R&D Increases”,
Journal of Finance, Vol.59, No.2, pp. 623-650, 2004.
DOI: https://doi.org/10.1111/j.1540-6261.2004.00644.x [9] A. Everhart, W. Maxwell and A. Siddique, “A
Reexamination of the Tradeoff between the Future Benefit and Riskiness of R&D Increases”,
Journal of Accounting Research, Vol.46, No.1, pp.27-52, 2008.
DOI: https://doi.org/10.1111/j.1475-679X.2007.00264.x [10] H. Kim, “Evidence on the Optimal Level of Research
& Development (R&D) Expenses for KOSPI-listed Firms in the Domestic Capital Market”,
Journal of International Trade & Commerce,Vol.14, No.1, pp.147-165, 2018.
DOI: https://dx.doi.org/10.16980/jitc.14.1.201802.147 [11] C. Shi, “On the Trade-off between the Future Benefits
and Riskness of R&D: a Bondholders' Perspective”,
Journal of Accounting and Economics, Vol. 35, pp.227-254, 2003.
DOI: https://doi.org/10.1016/S0165-4101(03)00020-X [12] D. Czarnitzki and S. Thorwarth, “Productivity Effects
of Basic Research in Low-Tech and High-Tech Industries”,
Research Policy, Vol.4, No.9, pp.1555-1564, 2012.
[13] V. Palenzuela and A. Bobillo, “Financial Structures of Spanish Firms: Multinational vs. Domestic”,
Multinational Business Review, Vol.2, No.2, pp. 64-79, 1994.
[14] R. Ramanathan. Introductory Econometrics with Applications (2nd ed.). Harcourt Brace & Company, 1992, pp.520-522.
[15] R. Bowen, L. Daley, H. Charles, "Evidence on the Existence and Determinants on Inter-industry Differences in Leverage",
Financial Management, Vol.11, No.4, pp.10-20, 1982.
[16] O. Varela and R. Limmack, “Financial Structure and Industry Classification in the United Kingdom Empirical Research Findings”,
Journal of Financial Management and Analysis,Vol.11, No.1, pp.1-9, 1998.
[17] H. Kim, “Financial Analysis by Conditional Quantile Regression on Corporate Research & Development Intensity for KOSDAQ-listed Firms in the Korean Capital Market,”,
Journal of the Korea Academia-Industrial Cooperation Society, Vol.21, No.5, pp. 179-190, 2020.
DOI: https://doi.org/10.5762/KAIS.2020.21.5.179
Hanjoon Kim [regular member]
• Feb., 1985 : Yonsei Univ., Seoul.
• Sept., 1987 : The George Washington Univ., MBA, U.S.A.
• Jan., 1999 : Boston University DBA (Major: Finance), U.S.A.
• Mar. 2010 ∼ Present: Hoseo Univ., Professor
<Research Interests>
Corporate Finance, M&A