ORIGINAL ARTICLE
Evaluation of CO
2Storage and Uptake by Forest Landscapes in the Middle Region of Korea
Hyun-Kil Jo*, Tae-Won Ahn1)
Department of Landscape Architecture, Kangwon National University, Chuncheon 200-701, Korea
1)Plant Environmental Research Station, Suppro Nursery Co., Ltd, Seoul 137-787, Korea
Abstract
Anthropogenic increases in greenhouse gas concentrations, primarily through radiative forcing from carbon dioxide, continue to challenge earth’s climate. This study quantified CO2 storage and uptake by dominant forest types and age classes in the middle region of Korea. In addition, the role of forest landscapes in reducing atmospheric CO2 against CO2 emissions based on energy consumption was evaluated. Mean CO2 storage and uptake per unit area by woody plants for three forest types and four age classes were estimated applying regression equations derived to quantify CO2 storage and uptake per tree;
and computations per soil unit area were also performed. Total CO2 storage and uptake by forest landscapes were estimated by extrapolating CO2 storage and uptake per unit area. Results indicated mean CO2 storage per unit area by woody plants and soils was higher in older age classes for the same forest types, and higher in broadleaved than coniferous forests for the same age classes, with the exception of age class II (11-20 years). CO2 storage by broadleaved forests of age class V (41-50 years) averaged 662.0 t/ha (US$331.0 hundred/ha), highest for all forest types and age classes evaluated. Overall, an increased mean CO2 uptake per unit area by woody plants was evident for older age classes for the same forest types.
However, decreased CO2 uptake by broadleaved forests at age class V was observed, compared to classes III and IV with an average of 27.9 t/ha/yr (US$14.0 hundred/ha/yr). Total CO2 storage by woody plants and soils in the study area was equivalent to 3.4 times the annual CO2 emissions, and woody plants annually offset the CO2 emissions by 17.7%. The important roles of plants and soils were associated with 39.1% of total forest area in South Korea, and CO2 emissions comprised 62.2% of the total population. Therefore, development of forest lands may change CO2 sinks into sources. Forest landscape management strategies were explored to maintain or improve forest roles in reducing atmospheric CO2 levels.
Key words : Forest type, Age class, Equation, CO2 emission, Offset, Strategy
1.1)Introduction
Carbon dioxide is one of the primary greenhouse gases resulting in climate change, and a serious concern for the earth’s future. Atmospheric CO2 concentrations were approximately 379 ppm in 2005, a 35% increase over preindustrial levels, and showed a 1.9 ppm increase per year from 1995 to 2005 (IPCC, 2007).
Continued climate change poses serious threats to global ecological and socio- economic systems unless measures are explored to mitigate the increasing accumulation of atmospheric CO2 (IPCC, 2007; Karl et al., 1997; Kemp, 1990; Melillo et al., 1990).
Increased atmospheric CO2 is primarily the result of fossil fuel combustion and deforestation (Detwiler and Hall, 1987; Schneider, 1990).
Received 20 November, 2012; Revised 4 February, 2013;
Accepted 18 February, 2013
*Corresponding author : Hyun-Kil Jo, Department of Landscape Architecture, Kangwon National University, Chuncheon 200-701, Korea
Phone: +82-33-250-8345 E-mail: [email protected]
ⓒ The Korean Environmental Sciences Society. All rights reserved.
This is an Open-Access article distributed under the terms of the Creative Commons Attribution Non-Commercial License (http://
creativecommons.org/licenses/by-nc/3.0) which permits unrestricted non-commercial use, distribution, and reproduction in any medium, provided the original work is properly cited.
Forest landscapes contribute to a reduction in atmospheric CO2 concentration in the following two ways: i) forest trees and shrubs directly sequester and accumulate atmospheric CO2 during growth via photosynthetic processes; atmospheric CO2 sequestration continues until the plants are cut or die; and ii) soils store CO2 in litter fall until it is returned to the atmosphere through decomposition; the majority of soil carbon is derived from fallen plant organic matter, biomass accumulated during photosynthetic processes.
Rising concerns regarding climate change have generated studies evaluating the effects of forest ecosystems on atmospheric CO2 levels. Birdsey (1990) reported that United States forest ecosystems stored approximately 190 Gt of CO2, which was equivalent to 4% of the CO2 stored in the world's forests (Atjay et al., 1979). Approximately 59% of the estimate was stored in soils, 31% in trees, 9% in above soil litter surfaces, and 1% in understory vegetation (Birdsey, 1990). Milne and Brown (1997) estimated the respective amount of CO2 stored in vegetation and soils in Great Britain was 418 Mt and 36,073 Mt; and broadleaved woodlands and Scottish peat soils were major sinks for CO2. Jo (2002) determined that total CO2 storage by woody plants and soils equaled about 57% of the total CO2 emissions from fossil fuel consumption in Chuncheon, a city in middle Korea, and suggested forest lands with significant CO2 storage per unit area should be conserved. The urban forests in Hangzhou, China annually offset 18.6% of the amount of CO2 emitted by industrial energy use within the city (Zhao et al., 2010).
Forest landscapes clearly play an important role in reducing atmospheric CO2 levels, however it is likely the role of forest landscapes varies with type, age, and productivity. Quantifying CO2 storage and uptake for different forest types and ages will contribute to determining the relative values among forest types
and ages, and consequently serve in preservation, conservation, and in the decision making process, as a part of a low carbon, green growth policy. In Korea, little information is available regarding the effects of forest landscapes on offsetting CO2 emissions at local, regional, and national levels. The purpose of this study was to quantify CO2 storage and uptake by forest type and age class, and evaluate the role of forest landscapes in reducing atmospheric CO2 levels against CO2 emissions based on energy consumption in the middle region of Korea.
2. Materials and Methods
2.1. Study area and biomass equation selection Temperate forest landscapes in the middle region of Korea were selected as the study area, including the following seven administrative provinces: Chungbuk, Chungnam, Daejeon, Gangwon, Gyeonggi, Incheon, and Seoul (Fig. 1). The provinces largely fall in the 85-100oC warmth index (Yim, 1977). Daejeon, Incheon, and Seoul are metropolises with high population density in Korea (see population in Results and Discussion), and each of the other provinces contains various cities or counties with lower population density.
Fig. 1. Location of seven study provinces in the middle region of Korea and Yongin City in which forest structure was field-surveyed.
Quercus and Pinus are the dominant native genera in the region (Song and Jang, 1997); Quercus is comprised of deciduous species, and Pinus species are evergreen. The species representative of these genera, and the community types (broadleaved, mixed, or evergreen) will be determined as a part of this study (see Forest structure ground sampling).
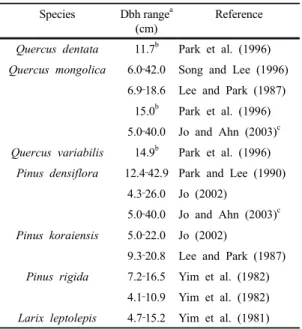
Various biomass equations for the major species, which were derived from trees growing in the study area, were obtained from the literature (Table 1) to estimate CO2 storage and uptake. The biomass equations were tested and verified against different references, to exclude any equation with extreme deviations from the median biomass estimates of a given species and to enhance the reliability of biomass estimates. All equations selected had r2 values of 0.97-0.99.
Table 1. Biomass equation sources selected to calculate CO2 storage and uptake of major tree species in the study provinces
Species Dbh rangea (cm)
Reference
Quercus dentata 11.7b Park et al. (1996) Quercus mongolica 6.0‐42.0 Song and Lee (1996)
6.9‐18.6 Lee and Park (1987) 15.0b Park et al. (1996) 5.0‐40.0 Jo and Ahn (2003)c Quercus variabilis 14.9b Park et al. (1996)
Pinus densiflora 12.4‐42.9 Park and Lee (1990) 4.3‐26.0 Jo (2002)
5.0‐40.0 Jo and Ahn (2003)c Pinus koraiensis 5.0‐22.0 Jo (2002)
9.3‐20.8 Lee and Park (1987) Pinus rigida 7.2‐16.5 Yim et al. (1982)
4.1‐10.9 Yim et al. (1982) Larix leptolepis 4.7‐15.2 Yim et al. (1981)
a Dbh denotes stem diameter at breast height of 1.2 m (see Table 4)
b Mean value
c Equation for CO2 uptake, not biomass
2.2. Forest structure ground sampling
Forest structure data was field-surveyed in Yongin City within the study provinces (Fig. 1), which contains diverse forest types and age classes in large natural forest areas. The data was collected in 100-m2 quadrats, which were located using a systematic random sample of grid points. Following delineation of forest types and age classes on a 1:25,000-scale map, a grid was established by latitude and longitude at 250 m intervals. A total of 120 grid points was randomly selected with 20-39 samples for each forest age class. This sample size was a compromise between competing concerns for a desirable level of statistical significance, and labor and funding limitations.
Survey data included species, stem diameter, height, crown width, and density of woody plants.
Stem diameter was measured at breast height of 1.2 m (dbh) for trees, and at 15 cm above ground for shrubs (woody plants 2 cm or less in dbh). Plot data was used to generate estimates of CO2 storage and uptake per tree and unit area.
2.3. Estimates of CO2 storage and uptake by woody plant species
The biomass equations obtained for each tree species were used to calculate average dry-weight biomass based on dbh growth of the same species ground-sampled in forest areas of Yongin City.
Biomass was converted to carbon storage by multiplying by 0.5 (Ajtay et al., 1979; Chow and Rolfe, 1989; Ovington, 1956; Pingrey, 1976; Reichle et al., 1973; Song et al., 1997), and subsequently to CO2 storage by multiplying by 3.6667. Based on these CO2 estimates, regression equations to easily quantify CO2 storage per broadleaved and coniferous tree species were developed using dbh as the independent variable. An iterative linear and nonlinear approach was applied to determine the most appropriate equation. Shrub CO2 storage was
estimated applying the biomass equations for each species derived by Jo (2002).
Tree CO2 uptake was computed applying the annual dbh growth rates and regression equations of Jo and Ahn (2003) (Table 1). Equations were derived from seasonal CO2 exchange rate measurements using a portable Infrared Gas Analyzer. In the former case, stem diameter in year y-1 (y: present year) was calculated using growth rate; and biomass in year y-1 was calculated applying stem diameter to the biomass equation. Biomass in year y-1 was subtracted from biomass in year y to estimate CO2 uptake. Mean annual dbh growth rates of 0.67 cm (Chung et al., 1983; Jo, 2002; Son et al., 1997) and 0.64 cm (Chung, 1985; Jo, 2002; Park, 1987; Son et al., 1997) were applied to broadleaved and coniferous tree species, respectively. Complete foliage CO2 was subtracted for deciduous species, and 25% foliage CO2 was subtracted for evergreen species assuming three-year leaf retention (Dirr, 1977; Rowntree and Nowak, 1991). Consistent with CO2 storage, regression equations to quantify average CO2 uptake per broadleaved and coniferous tree species were developed using dbh as the independent variable.
Shrub CO2 uptake was estimated for each species using biomass equations derived by Jo (2002), and annual stem diameter growth rates at 15 cm above ground. Data for Korea was unavailable for several shrubs, therefore annual growth rates for forest-grown shrubs in the United States were substituted (Harrington et al., 1989; Whittaker, 1962; Whittaker and Marks, 1975; Whittaker and Woodwell, 1968).
The derived CO2 equations were applied to each field-surveyed woody plant to quantify CO2 storage and uptake per unit area. The CO2 estimates per unit area per woody plant were rated across forest types and age classes via statistical analyses; the level of significance (p-value) was determined through an ANOVA and a t test using SPSS 12.0 (SPSS Inc., 2004).
2.4. Soil CO2 storage estimates
Soil samples were collected from within the grid points established in Yongin City for ground sampling of forest structures; 85 points were randomly selected for soil sampling that included different forest types and age classes. The soils were cored to a depth of 60 cm during spring using a multi-stage soil sampler (AMS, Idaho, USA) of 5.1 cm in diameter. Soil samples were air-dried for one-week, sieved through a 2 mm size mesh, and weighed to 0.1 g. Soil organic CO2 was analyzed per sample using the Walkley-Black method (Jackson, 1958). Significant differences in soil CO2 storage per unit area was assessed among forest types and age classes via above-mentioned statistical analyses.
3. Results and Discussion
3.1. Study provinces: population and forest area Total area and population in the study provinces (Table 2) was approximately 4,530 thousand ha and 30,942 thousand people, respectively with a population density of 6.8 people/ha (Korea Ministry of Public Administration and Security, 2010). The area and population comprised 45.2% and 62.2% of South Korea, respectively. Total forest area in the study provinces was roughly 2,828 thousand ha (Korea Forest Service, 2010), which occupied 45.8%
of the total forest area in South Korea, and 62.4% of the total study province area. Mean annual temperatures and precipitation during a 30-year period from 1971 to 2000 ranged from 8.5oC (Taebaek City in Gangwon Province) to 12.9oC (Gangneung City in Gangwon Province), and from 1,114 mm (Inje County in Gangwon Province) to 1,402 mm (Gangneung City) (Korea Meteorological Administration, 2010).
Mean tree density by forest type field surveyed in Yongin City showed a decreased trend as age classes increased, which was particularly notable for age class
Species Dbh (cm)
5 10 15 20 25 30 35 40
Broadleaved Storagea 12.7 69.8 189.2 384.0 664.9 1,041.6 1,522.4 2,115.1
Uptakeb 2.8 12.7 22.8 33.2 43.7 54.5 65.6 76.8
Coniferous Storagec 11.0 48.6 116.4 214.9 344.3 521.6 726.9 940.2
Uptaked 2.7 8.9 16.2 24.5 33.7 44.0 55.3 67.5
a Equation: lnCO2 = ‐1.4134 + 2.4581 lndbh (r2 = 0.99) b CO2 = ‐6.8539 + 1.9082 dbh + 0.0046 dbh2 (r2 = 0.99)
c lnCO2 = ‐1.0470 + 2.1436 lndbh (r2 = 0.99) d CO2 = ‐2.6257 + 0.9572 dbh + 0.0199 dbh2 (r2 = 0.99) Table 4. CO2 storage (kg) and uptake (kg/yr) per tree by diameter growth in the study provinces
V (age classes are delimited in Table 3). Tree density was similar between broadleaved and coniferous forests within the same age class, with higher density exhibited
Table 2. Population and forest area for the study provinces Province Administrative
area (ha)
Population Forest area (ha)
Chungbuk 743,317 1,527,478 476,552
Chungnam 862,898 2,037,582 421,198
Daejeon 53,986 1,484,180 29,804
Gangwon 1,687,394 1,512,870 1,342,683 Gyeonggi 1,018,675 11,460,610 506,183
Incheon 102,701 2,710,579 37,812
Seoul 60,528 10,208,302 13,672
Total 4,529,499 30,941,601 2,827,904 As of Dec. 31, 2009 (Korea Ministry of Public Administration and Security, 2010; Korea Forest Service, 2010)
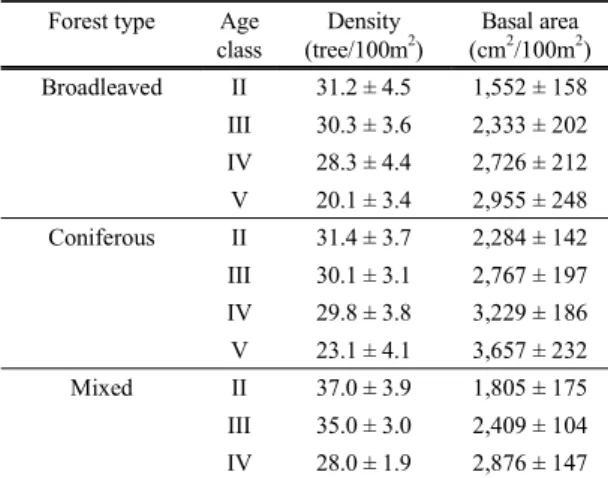
Table 3. Density and basal area of trees by forest type and age class in Yongin City
Forest type Age class
Density (tree/100m2)
Basal area (cm2/100m2) Broadleaved II 31.2 ± 4.5 1,552 ± 158 III 30.3 ± 3.6 2,333 ± 202 IV 28.3 ± 4.4 2,726 ± 212 V 20.1 ± 3.4 2,955 ± 248 Coniferous II 31.4 ± 3.7 2,284 ± 142 III 30.1 ± 3.1 2,767 ± 197 IV 29.8 ± 3.8 3,229 ± 186 V 23.1 ± 4.1 3,657 ± 232
Mixed II 37.0 ± 3.9 1,805 ± 175
III 35.0 ± 3.0 2,409 ± 104 IV 28.0 ± 1.9 2,876 ± 147 Figures indicate mean ± standard error. II: 11‐20 years, III: 21‐
30, IV: 31‐40, V: 41‐50 (the same with subsequent tables)
in mixed forest relative to broadleaved and coniferous forests for age classes II and III. Older age classes exhibited decreased tree density; however mean basal area per unit area increased with age, consistent with diameter growth. Dominant tree species included Quercus mongolica, Q. aliena, Q. variabilis (mean importance values of 37.7%), Pinus rigida, P. densiflora (17.4%), Rhus trichocarpa (5.5%), Larix leptolepis (4.6%), and Castanea crenata (4.4%). Rhododendron mucronulatum (5.6%) and R. schlippenbachii (4.0%) comprised the dominant shrub species.
3.2. CO2 storage and uptake by woody plants Carbon dioxide storage and uptake per broadleaved and coniferous tree species were positively correlated to diameter growth (dbh in cm) (Table 4). The increase in CO2 storage between diameter classes was relatively higher at larger tree diameters. For example, CO2 storage for a 10 cm dbh coniferous tree increased by approximately 68 kg with 5 cm growth, but by 205 kg with 5 cm growth in a 30 cm dbh tree (3-times higher). Carbon dioxide storage and uptake for broadleaved species was higher than coniferous species of the same diameter, and differences increased as diameters increased, particularly in CO2
storage. The storage and uptake of a 20 cm dbh broadleaved tree was a respective and approximate 1.8 and 1.4 times higher than a coniferous tree of the same dbh. One liter of gasoline consumption emits approximately 2.12 kg of CO2 (Ahn, 2010); therefore the CO2 storage of a 20 cm dbh broadleaved tree was equivalent to the amount of CO2 emitted from the use
Forest type/age class n Uptake (t/ha/yr)
p
BL/II, CN/II, M/II 32 21.0 ± 0.6 0.0412 0.0328 0.0441
CN/III 13 23.4 ± 1.2
BL/V, CN/IV & V, M/III 38 26.1 ± 0.7 BL/III & IV, M/IV 31 27.9 ± 0.8 of approximately 181 liter of gasoline.
Mean CO2 storage per unit area by woody plants in Yongin City was higher in older age classes within the same forest types, and was higher in broadleaved forests than coniferous or mixed forests of the same age classes, with the exception of age class II (Table 5). CO2 storage by broadleaved forests of age classes IV and V averaged 367.1 t/ha, significantly higher than all other forest types and age classes evaluated (p < 0.01). This CO2 storage level was roughly 2.5 times higher than all forest types of age class II, 1.4 times higher than broadleaved forests of age class III, mixed forests of age class IV, and coniferous forests of age class V. Mean CO2 uptake per unit area by woody plants tended to be higher at older age classes for the same forest types (Table 6). However, CO2
uptake by broadleaved forests was lower at age class V than age classes III and IV. A higher respiration rate of woody organs (Jo and Ahn, 2003) and lower tree density at age class V are a plausible explanation for this result. Carbon dioxide uptake in broadleaved forests age classes III and IV, and mixed forests age
Table 5. CO2 storage per ha by woody plants for each forest type and age class in Yongin City
Forest type/age class n Storage (t/ha)
p BL/II, CN/II, M/II 32 148.6 ± 6.3
< 0.0001
< 0.0001
< 0.0002 CN/III & IV, M/III 32 207.7 ± 7.3
BL/III, CN/V, M/IV 32 261.4 ± 10.3 BL/IV & V 18 367.1 ± 23.3
BL: Broadleaved, CN: Coniferous, M: Mixed. n denotes the number of samples (the same with subsequent tables)
Table 6. CO2 uptake per ha by woody plants for each forest type and age class in Yongin City
class IV averaged 27.9 t/ha/yr, significantly higher than all forest types and age classes (p < 0.05).
3.3. CO2 soil storage
Forest soil bulk density in Yongin City averaged 1.3 ± 0.0 (standard error) g/cm3, and moisture and gravel mean content (> 2 mm in diameter) were 12.9
± 0.4% and 18.8 ± 1.6%, respectively. Mean soil pH was 4.8 ± 0.0, and organic matter averaged 2.0 ± 0.1%. Mean soil CO2 storage per unit area was higher at older age classes for each forest type (Table 7), consistent with CO2 storage by woody plants. Soil CO2 storage for the same age classes was higher in mixed forests than in broadleaved or coniferous forests, with the exception of age class II. Mean soil CO2 storage in mixed forests of age class IV, and broadleaved forests of age class V averaged 294.9 t/ha, exhibiting the highest value of all forest types and age classes evaluated (p < 0.05). This estimate was 1.3-1.5 times greater than for broadleaved and coniferous forests of age classes II and III.
Table 7. CO2 storage per ha in soils for each forest type and age class in Yongin City
Forest type/age class n Storage (t/ha)
p
BL/II, CN/II, M/II 20 200.6 ± 5.4 0.0110
0.0241 0.0463 BL/III, CN/III 14 226.3 ± 8.6 BL/IV, CN/IV & V, M/III 31 250.6 ± 8.0 BL/V, M/IV 17 294.9 ± 23.2
Carbon dioxide storage for forest soils in Korea averaged approximately 246 t/ha (Jeong et al., 1998), which fell in the middle range of estimates for forest types and age classes in this study. Mean CO2 storage for agricultural soils in Korea were determined at 110 t/ha from fields and orchards (Korea Institute of Agricultural Science and Technology, 1999; Korea Rural Development Administration, 1989), and urban soils from gardens, streets, and parks in a middle Korean city were approximately 92 t/ha (Jo, 2002).
Soil CO2 storage in agricultural and urban lands was
Forest type Age class
II III IV V
BL 174.6 243.9 308.9 331.0
CN 174.6 217.0 229.2 256.0
M 174.6 229.2 278.2 ‐
much lower than even forest types of age class II, which was the lowest of the forest types and age classes assessed in this study. This indicates that changes in land use from forest lands to agricultural or urban lands have the potential to act as a significant source of CO2 release.
3.4. Role of forest landscapes to reduce atmospheric CO2 levels
Broadleaved forests of age class V exhibited the highest CO2 storage per unit area by woody plants and soils with an average of 662.0 t/ha, followed by broadleaved (617.7 t/ha) and mixed (556.3 t/ha) forests of age class IV. Recent annual CO2 emissions per capita from energy consumption were 11.3 t/yr in Korea (Korea Energy Economics Institute, 2010).
The CO2 storage per ha for broadleaved forests of age class V was equivalent to the amount of CO2 annually emitted by approximately 59 people.
Based on a control cost of nearly US$50/t CO2
(Korea Forest Research Institute, 2007), economic values of CO2 storage from woody plants and soils ranged from $174.6 hundred/ha for forest types of age class II to $331.0 hundred/ha for broadleaved forests of age class V (Table 8). Economic values of CO2 uptake by woody plants ranged from $10.5 hundred/ha/yr for forest types of age class II to $14.0 hundred/ha/yr for broadleaved forests of age classes III and IV, and mixed forests of age class IV. This information is clearly valuable in evaluating forest loss costs and benefits from various development projects, and in securing budgets for reforestation and management.
Table 8. Economic value of CO2 storage by woody plants and soils for each forest type and age class in Yongin City (US$ hundred/ha)
Urban sprawl associated with residential development and industrial facilities has caused forest tree removal and reduction in forest landscapes. For example, Chuncheon forest area, one of the cities in the study provinces decreased by approximately 33% during the past 31 years (i.e. 1974 to 2005) (Ahn, 2010; Jo and Kim, 2001). If forest land disturbances are inevitable due to developmental pressures, appropriate land use policies are required to minimize adverse impacts. Policy should reflect the relative capacity of CO2 storage and uptake among forest types and age classes.
It is essential to avoid haphazard development and preserve broadleaved forests of age classes III-V and mixed forests of age class IV, which exhibited increased CO2 storage or uptake. Alternatively, a conservative development approach could be instituted for age class II forest types and age class III coniferous forests. However, younger forests have the potential to grow into important CO2 reservoirs, therefore it is desirable to levy a reforestation or replacement cost equivalent to the above economic values to offset young forest losses. This measure is similar to a system of CO2 emission trading.
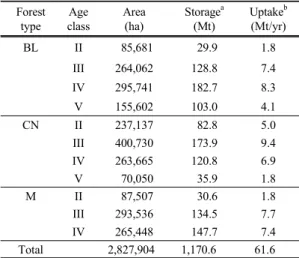
Based on extrapolation of the average CO2
estimates per unit area by forest type and age class, total woody plant and soil CO2 storage in forest areas of the study provinces was estimated at 1,171 Mt, and total CO2 uptake by woody plants was 61.6 Mt/yr (Table 9). Total annual CO2 emissions from fossil fuel consumption were recently measured at 348 Mt/yr in the study provinces (Korea Energy Economics Institute, 2010). Forest landscapes distributed in the study provinces stored a CO2 amount equivalent to approximately 3.4 times the CO2 emissions, and annually offset the CO2 emissions by 17.7% (Fig. 2).
These important interactions were associated with 39.1% of the total South Korean forest area, and CO2
emissions from 62.2% of the total population. Total CO2 storage and uptake did not include ground-
sampling of each forest type of age classes I and VI, and mixed forest of age class V due to rare or small distributions in Yongin City. These forest types and age classes accounted for 14.5% of the total forest area in the study provinces. Therefore, the addition of these samples might result in an increased reduction in atmospheric CO2 levels.
Table 9. Total CO2 storage and uptake by forest landscapes in the study provinces
Forest type
Age class
Area (ha)
Storagea (Mt)
Uptakeb (Mt/yr)
BL II 85,681 29.9 1.8
III 264,062 128.8 7.4
IV 295,741 182.7 8.3
V 155,602 103.0 4.1
CN II 237,137 82.8 5.0
III 400,730 173.9 9.4
IV 263,665 120.8 6.9
V 70,050 35.9 1.8
M II 87,507 30.6 1.8
III 293,536 134.5 7.7
IV 265,448 147.7 7.4
Total 2,827,904 1,170.6 61.6
a Storage by woody plants and soils
b Uptake by woody plants
Fig. 2. The role of total CO2 storage and uptake by forest landscapes in offsetting total CO2 emissions in the study provinces.
The results from this study indicated forest landscapes significantly contribute to CO2 uptake and storage, which should aid in curbing the effects of climate change. However, destruction of forest lands
due to urban expansion could accelerate the rising accumulation of atmospheric CO2 by reducing potential CO2 uptake by trees and releasing CO2
stored in trees and soils. Establishing a target for CO2
emissions offset by forests is required at the local and regional scales to control development pressures on forest lands. A designated target is vital to establish the magnitude of forest conservation, preservation, or the number of plantings to maintain or improve the effects of CO2 reduction. This study provides the indicators to evaluate CO2 storage and uptake per tree, and per unit area for forest landscapes. These indicators can serve, in part, as decision-making criteria for forest management, including CO2 offset targets, land use regulations, and reforestation policies.
4. Conclusion
Reduction of atmospheric CO2 concentration is one of the most challenging and controversial issues our society faces for environmental soundness and economic progress. Quantifying CO2 reduction in forest landscapes at the local and regional scales is necessary to develop desirable management policies with improved value systems for higher-level CO2 emission trading between governments. This study put an emphasis on answering environmental concerns about what CO2
storage and uptake by forest type and age class are, and what the effects of forest landscapes on atmospheric CO2 reductions against CO2 emissions are in the middle region of Korea. Woody plants and soils in the forested areas of the study region stored an amount of CO2 equivalent to approximately 3.4 times the annual CO2 emissions from energy consumption, and woody plants annually offset the CO2 emissions by 17.7%. These significant roles were associated with 39.1% of the total forest area in South Korea, and CO2 emissions from 62.2% of the total population.
The results of this study result in the recommendation of three management strategies to maintain or improve the roles of forest landscapes. First, a CO2
emissions target offset by forests to control development pressures on forest lands should be established.
Forest land development will likely accelerate atmospheric CO2 levels by releasing the CO2 stored in trees and soils, and limiting CO2 uptake opportunities by trees. The target for CO2 offset will serve to determine an areal size of forest preservation for sustainable development. The CO2 storage and uptake per unit area by forest type and age class from this study can be applied to establish a target.
Second, forest management must place high priority on preservation of forest types and age classes with higher levels of CO2 storage and/or uptake, such as broadleaved forests of age classes III-V, and mixed forests of age class IV (in this study). Inevitably, land use must be permitted for forest types and age classes with lower CO2 storage and/or uptake, such as age class II forest types and age class III coniferous forests. However, mitigation measures, including soil conservation and immediate replantation are required for developers to compensate for losses.
Third, replacement with broadleaved trees is preferable to coniferous species, particularly for the study region, because the former sequester more CO2
annually for comparable age classes. Carbon dioxide storage and uptake per tree by diameter growth of broadleaved and coniferous species can be easily calculated and compared using the regression equations derived for species in this study. Assuming heterogeneous landscape diversity, it is desirable to establish mixed forests partially including coniferous species.
Climate change is the result of continuing cumulative CO2 emissions worldwide. Mitigation or curbing climate change requires comprehensive measures for national and regional reductions in CO2 emissions.
The measures should not only include a reduction in
the use of fossil fuels and alternative energy development, but forest preservation, conservation, and replantation. Forest planning and management has great potential as a more time-saving and cost-effective means to reduce atmospheric CO2
levels, compared to the development of alternative energy. The results of this study are expected to be useful in evaluating CO2 storage and uptake capacity by forest type and age class, and to guide forest landscape policy and improve the effects of atmospheric CO2 reduction.
Total CO2 storage and uptake by forest landscapes in the study region were estimated based on field surveys of species composition, tree size, and tree density in a city with relatively diverse forest types and age classes. In Korea, detailed information from ground surveys is still limited regarding spatial distributions of tree stem diameters and density by forest type and age class. The total CO2 storage and uptake need to be compared with additional studies that include wider sampling of forest structures and soils spanning the entire study region. Research on annual litterfall and soil decomposition is also required to help understand annual CO2 accumulation in soils by forest type and age class, which was not considered in this study. In particular, similar forest landscape research should be conducted in the southernmost region of Korea to elucidate the impacts of forest landscapes on atmospheric CO2 reduction at the national scale.
References
Ahn, T. W., 2010, A study on establishment of greenspace planning indicators to accomplish low carbon green city: in the case of Chuncheon, Ph.D.
Dissertation, Kangwon National University, Chuncheon.
Ajtay, L. L., Ketner, P., Duvigneaud, P., 1979, Terrestrial production and phytomass, in: Bolin, B., Degens, E.
T., Kempe, S., Ketner, P. (eds.), The Global Carbon Cycle, SCOPE Report No 13, John Wiley & Sons,
New York, 129-181.
Birdsey, R. A., 1990, Carbon budget realities at the stand and forest level, Proceedings of the 1990 Society of American Foresters National Convention, Are Forests the Answers?, Society of American Foresters, Bethesda, MD, 181-186.
Chow, P., Rolfe, G. L., 1989, Carbon and hydrogen contents of short rotation biomass of five hardwood species, Wood and Fiber Science, 21(1), 30-36.
Chung, S. H., 1985, A study on the diameter increment of major conifers in middle area of Korea, J Korean Forestry Society, 68, 52-59.
Chung, S. H., Choi, M. G., Lee, G. S., 1983, A study on the diameter increment of major hardwoods in middle area of Korea, J Korean Forestry Society, 60, 24-29.
Detwiler, R., Hall, C., 1987, Tropical forests and the global carbon cycle, Science, 239, 42-47.
Dirr, M. A., 1977, Manual of Woody Landscape Plants.
Stipes Publishing Company, Champaign, IL.
Harrington, R. A., Brown, B. J., Reich, P. B., Fownes, J.
H., 1989, Ecophysiology of exotic and native shrubs in Southern Wisconsin II: annual growth and carbon gain, Oecologia, 80, 368-373.
IPCC, 2007, Climate Change 2007: Synthesis Report, Intergovernmental Panel on Climate Change Fourth Assessment Report, http://www.ipcc.ch (accessed 1/11).
Jackson, M. L., 1958, Soil Chemical Analysis, Prentice- Hall, Inc, New Jersey.
Jeong, J. H., Kim, C., Lee, W. K., 1998, Soil organic carbon content in forest soils of Korea, Korea Forestry Research Institute Journal of Forest Science, 57, 178-183.
Jo, H. K., 2002, Impacts of urban greenspace on offsetting carbon emissions for middle Korea, J Environmental Management, 64, 115-126.
Jo, H. K., Ahn, T. W., 2003, Atmospheric CO2 uptake by Pinus densiflora and Quercus mongolica, J the Environmental Sciences, 12(8), 853-860.
Jo, H. K., Kim, S. H., 2001, Analyzing structures and changes of urban landscape by landscape ecological approach: in the case of Chuncheon, Proceedings of the 2001 Korean Institute of Landscape Architecture National Convention (Fall Season), 10-12.
Karl, T. R., Nicholls, N., Gregory, J., 1997, The coming climate, Scientific American, 5, 78-83.
Kemp, D. D., 1990, Global Environmental Issues: A Climatological Approach, Routledge, New York.
Korea Energy Economics Institute, 2010, Emission Trends of Greenhouse Gases, http://www.keei.re.kr/
main.nsf/index.html (accessed 7/10).
Korea Forest Research Institute, 2007, A Study on Quantification of Forest Functions, Research Report 07-05.
Korea Forest Service, 2010, Forest Area of Administrative Provinces, http://www.forest.go.kr/kfsweb/kfi/kfs/
s t at s / l ocal St at s . do ?mn=KFS_ 05_ 09_ 01_ 01 (accessed 7/10).
Korea Institute of Agricultural Science and Technology, 1999, A Study on Measures for Agricultural Environmental Change, Report of Korea Rural Development Administration's Research Project.
Korea Meteorological Administration, 2010, A 30-year Weather Data, http://www.kma.go.kr/weather/climate/
average_30years.jsp (accessed 7/10).
Korea Ministry of Public Administration and Security, 2010, Area and Population of Administrative Provinces, Pub. No.: 11-1311000-000342-10.
Korea Rural Development Administration, 1989, Synthetic Report of 10-year Project for Agricultural Soil Improvement, Rural Study Series 18.
Lee, K. J., Park, I. H., 1987, Primary production and nutrients distribution in 22 year-old Pinus koraiensis and Quercus mongolica stands in Kwangju district, J Korean Forest Energy, 7(1), 11-21.
Melillo, J. M., Callaghan, T. V., Woodward, F. I., Salati, E., Sinha, S. K., 1990, Effects on ecosystems, in:
Houghton, J. T., Jenkins, G. J., Ephraums, J. J. (eds.), Climate Change, Cambridge University Press, Cambridge, 285-310.
Milne, R., Brown, T. A., 1997, Carbon in the vegetation and soils of Great Britain, J Environmental Management, 49, 413-433.
Ovington, J. D., 1956, The composition of tree leaves, Forestry, 29, 22-29.
Park, I. H., Lee, D. K., Lee, K. J., Moon, G. S., 1996, Growth, biomass and net production of Quercus species (I), J Korean Forestry Society, 85(1), 76-83.
Park, I. H., Lee, S. M., 1990, Biomass and net production
of Pinus densiflora natural forests of four local forms in Korea, J Korean Forestry Society, 79(2), 196-204.
Park, W. G., 1987, A study on the diameter growth and key year for Pinus koraiensis and Pinus densiflora, Master Thesis, Kangwon National University, Chuncheon.
Pingrey, D. W., 1976, Forest products energy overview, in: Energy and the Wood Products Industry, Forest Products Research Society, Madison, WI, 1-14.
Reichle, D. E., Dinger, B. E., Edwards, N. T., Harris, W.
F., Sollins, P., 1973, Carbon flow and storage in a forest ecosystem, in: Woodwell, G. M., Pecan, E. V.
(eds.), Carbon and the Biosphere, Proceedings of the 24th Brookhaven Symposium in Biology, US Atomic Energy Commission, Office of Information Services, Upton, NY, 345-365.
Rowntree, R. A., Nowak, D. J., 1991, Quantifying the role of urban forests in removing atmospheric carbon dioxide, J Arboriculture, 17(10), 269-275.
Schneider, S. H., 1990, The changing climate, in:
Managing Planet Earth, W.H. Freeman and Company, New York, 25-36.
Son, Y. M., Lee, K. H., Chung, Y. G., 1997, Stand growth estimation using nonlinear growth equations, J Korean Forestry Society, 86(2), 135-145.
Song, C. Y., Chang, K. S., Park, K. S., Lee, S. W., 1997, Analysis of carbon fixation in natural forests of Quercus mongolica and Quercus variabilis, J Korean Forestry Society, 86(1), 35-45.
Song, C. Y., Lee, S. W., 1996, Biomass and net primary productivity in natural forests of Quercus mongolica and Quercus variabilis, J Korean Forestry Society,
85(3), 443-452.
Song, H. K., Jang, K. K., 1997, Study on the DBH analysis and forest succession of Pinus densiflora and Quercus mongolica forests, J Korean Forestry Society, 86(2), 223-232.
Whittaker, R. H., 1962, Net production relations of shrubs in the Great Smoky Mountains, Ecology, 43(3), 357-377.
Whittaker, R. H., Marks, P. L., 1975, Methods of assessing terrestrial productivity, in: Lieth, H., Whittaker, R. H. (eds.), Primary Productivity of the Biosphere, Springer-Verlag, New York, 55-118.
Whittaker, R. H., Woodwell, G. M., 1968, Dimension and production relations of trees and shrubs in the Brookhaven forest, New York, J Ecology, 56(1), 1-25.
Yim, K. B., Kim, K. D., Lee, K. J., Kim, Y. S., Park, I.
H., Kwon, T. H., Lee, S. H., Park, H. S., 1981, Biomass study of a 15 year-old Larix leptolepis stand, J Korean Forest Energy, 1(1), 4-12.
Yim, K. B., Lee, K. J., Kwon, T. H., Park, I. H., 1982, Distribution of biomass and production in man-made pitch pine plantation in Korea, J Korean Forest Energy, 2(2), 1-12.
Yim, Y. J., 1977, Distribution of forest vegetation and climate in the Korean peninsula (IV): zonal distribution of forest vegetation in relation to thermal climate, Japanese Journal of Ecology, 27, 269-278.
Zhao, M., Kong, Z., Escobedo, F. J., Gao, J., 2010, Impacts of urban forests on offsetting carbon emissions from industrial energy use in Hangzhou, China, J Environmental Management, 91, 807-813.