Correlation of Patient Weight and Cross-Sectional Dimensions with
Subjective Image Quality at Standard Dose Abdominal CT
Objective: We evaluated the association between patients’ weight and abdom- inal cross-sectional dimensions and CT image quality.
Materials and Methods: We prospectively evaluated 39 cancer patients aged more than 65 years with multislice CT scan of abdomen. All patients underwent equilibrium phase contrast-enhanced abdominal CT with 4 slices (from top of the right kidney) obtained at standard tube current (240 280 mA). All other scanning parameters were held constant. Patients’ weight was measured just prior to the study. Cross-sectional abdominal dimensions such as circumference, area, aver- age anterior abdominal wall fat thickness and, anteroposterior and transverse diameters were measured in all patients. Two subspecialty radiologists reviewed randomized images for overall image quality of abdominal structures using 5- point scale. Non-parametric correlation analysis was performed to determine the association of image quality with patients’ weight and cross-sectional abdominal dimensions.
Results: A statistically significant negative linear correlation of 0.46, 0.47, 0.47, 0.58, 0.56, 0.54, and 0.56 between patient weight, anterior abdominal fat thick- ness, anteroposterior and transverse diameter, circumference, cross-sectional area and image quality at standard scanning parameters was found (p <0.01).
Conclusion: There is a significant association between image quality, patients’
weight and cross-sectional abdominal dimensions. Maximum transverse diame- ter of the abdomen has the strongest association with subjective image quality.
oncerns have been raised in recent publications about the radiation expo- sures to patients from medical diagnostic techniques most notably from CT scans (1 4). Studies emphasizing modulation of tube current accord- ing to patients’ weight have been performed in the past (5, 6). However, a systematic analysis of relationship between patients’ thickness parameters and weight and image quality at same tube currents has not been sufficiently investigated. To investigate the significance of these parameters for development of optimum scanning protocols, we evaluated the association of patient’s morphological characteristics including weight and cross-sectional dimensions with subjective image quality with standard CT proto- col (kVp and mAs).
MATERIALS AND METHODS
We evaluated consecutive 39 subjects aged more than 65 years, with history of can- cer who were referred for abdominal CT study, in an Institutional Review Board (IRB) approved project. The study population consisted of 24 women and 15 men with an Mannudeep K. Kalra, MD,
DNB
Michael M. Maher, MD, FRCR, FFR (RCSI) Srinivasa R. Prasad, MD M. Sikandar Hayat, MD Michael A. Blake, MRCPI,
FFR (RCSI), FRCR Jose Varghese, MD Elkan F. Halpern, PhD.
Sanjay Saini, MD
Index terms :
Computed tomography (CT)
Korean J Radiol 2003;4:234-238 Received May 20, 2003; accepted after revision July 11, 2003.
All authors: Department of Radiology, Massachusetts General Hospital and Harvard Medical School, U.S.A.
Address reprint requests to :
Sanjay Saini, MD, Department of Radiology, Massachusetts General Hospital and Harvard Medical School, 55, Fruit Street, Boston, MA 02114, U.S.A.
Telephone: (617) 726-3937 Fax: (617) 726-4891 e-mail: [email protected]
C
age range of 65 to 88 years (mean age of 71 years).
Informed consent was obtained from all participating sub- jects.
All studies were performed with multislice helical CT scanner (LightSpeed, QX/i, General Electric Medical Services, Waukesha, WI) with four-detector rows.
Following standard contrast enhanced CT study, a set of four additional images was obtained in the equilibrium phase, centered at the upper pole of right kidney. The im- ages were obtained as per the standard scanning protocol at tube voltage (140 kVp) and tube current (240 280 mA). The images were acquired in a single breath-hold, with 2.5 mm detector configuration, table speed of 15 mm/gantry rotation based on 6:1 non-overlapping slice- pitch and 0.8 seconds tube rotation time. Five millimeter thick contiguous slices were reconstructed with standard soft tissue algorithm for image analysis.
Weights of all patients were recorded just prior to the study. Cross-sectional abdominal area, circumference, an- teroposterior and transverse diameters of abdomen were measured with PACS diagnostic workstation software (AGFA Impax RS 3000 1K review station, AGFA Technical Imaging Systems, Richfield Park, NJ, U.S.A.).
Average anterior abdominal wall fat thickness was estimat- ed from the measurements of anterior abdominal wall fat thickness at three different sites (midline and 10-cm lateral to the midpoint on both sides) at the level of upper pole of right kidney. Root mean square dimension was calculated as the root of the sum of squares of the maximum perpen- dicular anteroposterior and transverse diameters of ab- domen. Two subspecialty radiologists with expertise in ab- dominal imaging evaluated image sets qualitatively on a PACS diagnostic workstation with a standard five-point scale at a fixed window level and window width. The im- ages were presented to the readers in random order.
Qualitative image quality scores were given on the basis of image noise, soft-tissue contrast and sharpness of organ boundaries for the liver, adrenals, kidneys, pancreas, and
abdominal wall. Image quality was scored as 1=not accept- able; 2= substandard; 3=acceptable; 4=above average; 5=
excellent.
Non-parametric correlation (Spearman) analysis was per- formed using SAS/STAT software (SAS Institute Inc., Cary, NC), to determine correlation of image quality at standard dose radiation with patient weight and cross-sec- tional abdominal dimensions. Confidence level of statistical association was determined by p-value of less than 0.01 (99% confidence limit). Cohen’s Kappa test was performed to determine interobserver concordance using SAS/STAT software (SAS Institute Inc., Cary, NC). Weighted kappa co-efficient values for interobserver agreement were con- sidered as slight, < 0.2; fair, = 0.21 0.40; moderate, = 0.41 0.60; substantial, = 0.61 0.80; or almost perfect, = 0.81 1.00.
RESULTS
In the randomized review, mean scores and standard er- ror of means for image quality of the CT studies by readers 1 and 2 were 3.8 0.05 and 3.75 0.05, respectively.
There was moderate interobserver agreement in the image quality scores as determined by weighted kappa coefficient of 0.57 (p<0.05).
The range of patients’ weights in our study was 41.77 to 102.15 kg (median weight = 77.18 kg) (Fig. 1). The range of cross-sectional transverse abdominal diameters was 25 to 42 cm with average diameter of 33 cm (Fig. 2). The range of measurements for the average anterior abdominal fat thickness, anteroposterior diameter, circumference and cross-sectional area of abdomen were 0.1 3.2 cm (aver- age = 1.77 cm), 15.5 34.2 cm (average = 25.86 cm), 72 125 cm (average = 97.57 cm) and 386 1187 cm2 (average = 727.33 cm2), respectively. Data documenting correlation between image quality and patients’ abdominal dimensions are summarized in table 1. Significant negative correlation was found between image quality and patients’
Fig. 1. Scatter graph depicting distribution of patients’ weight. Fig. 2. Scatter graph depicting distribution of patients’ transverse diameter.
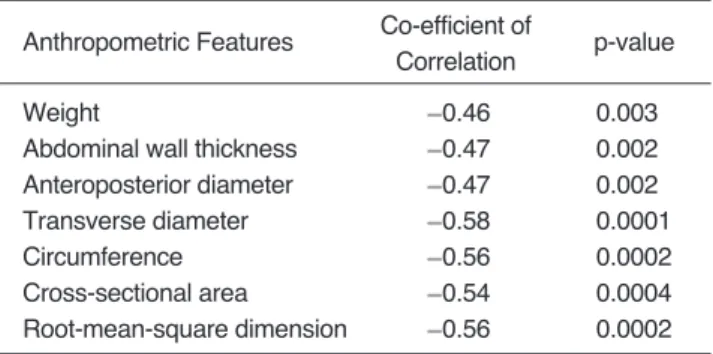
weight, anterior abdominal fat thickness anteroposterior and transverse diameter, circumference, and cross-section- al area (p < .01). With standard protocol abdominal CT studies, the transverse diameter of the patients had the strongest negative correlation with subjective image quali- ty (p =.0001). A negative linear correlation of 0.56 be- tween subjective image quality and root mean square di- mension and circumference of abdomen was found (p<.002).
DISCUSSION
More than 80% of man-made sources of radiation are ac- counted by diagnostic and therapeutic ionizing radiation and radionuclides (3). Increased clinical utilization of diag- nostic radiological studies is responsible for the increase in radiation doses to society. Though CT constitutes about 5% of all radiological procedures, it contributes more than 30% of radiation exposure from medical x-ray sources (4).
Contrary to other x-ray based examinations, scanning pa- rameters in CT studies are uniform for most patients and not appropriately modulated depending on patient size, body part being examined and indication of the study (5).
Various technical advances to decrease radiation dose from CT have been evaluated (7 10). Prior studies have suggested that it is possible to reduce tube currents based on the part of the body being scanned and weight of the patient without jeopardizing image quality (11 13).
Diverse approaches have been utilized to address the issue of radiation dose optimization such as limiting CT scans to carefully identified indications, restricting multiphase pro- tocols to obtain specific clinical information, judicious use of repeat and follow-up studies, and appropriate adjust- ments in scanning parameters (6). Tube voltage, tube cur- rent, scanning time, slice thickness, pitch and scan volume are important major scanning parameters that influence ra- diation dose on CT (6). Several studies have implied that increasing pitch decreases radiation dose by reducing the
scan time (14, 15). However, higher pitch can result in le- sions being missed due to slice broadening and consequent volume averaging effects. Tube current settings are often not appropriately modulated according to patient body habitus, weight, and body part to be examined (6). Some clinical investigations have actively advocated use of pa- tients’ weight for optimizing scan parameters and reducing radiation dose without compromising image quality (16, 17).
In a study of 4881 subjects, Han et al. reported that waist (abdominal) circumference was the best predictor of ab- dominal fat and had greater correlation with regional fat distribution than both weight and body mass index (weight (kg)/ height (m2)) (18). Based on this large patient cohort study, we assumed that the distribution of fat and regional constitution (muscle and other tissue bulk) might reflect more accurately in the regional anthropometric dimensions than in the overall weight of the subject. Consequently, we also anticipated that a subject with height of 145 cm might have weight equivalent to a subject with height of 165 cm, and as a result, the cross-sectional abdominal dimensions of patients would be more reliable for prediction of scan- ning protocols. Therefore, we investigated association be- tween image quality and the aforementioned abdominal dimensions. Indeed, we found a statistically significant neg- ative correlation between subjective image quality and pa- tients’ abdominal dimensions and weight. Transverse diam- eter, circumference, cross-sectional area, and root-mean- square dimension had greater correlation with image quali- ty than weight, anteroposterior diameter, and anterior ab- dominal fat thickness. In view of the fact that the beam at- tenuation and thus, image quality is determined by body distance traversed by the x-ray beam, our presumption that thickness of the body portion rather than weight cor- relates better with image quality was proven to be valid (12, 13). Consequently, our findings support the con- tention of Haaga who has strongly advocated that patient diameter is a better predictor of the milliampere-second re- quirement than body weight because diameter better cor- relates with the distance of the pathway traversed by the X-ray beam (13). In our study, maximum transverse diam- eter of abdomen had greatest correlation with image quali- ty. In addition, these cross-sectional dimensions, i.e. maxi- mum transverse diameter, circumference, cross-sectional area, and root-mean-square dimension are also representa- tive of accurate regional abdominal constitution and can be used to predict the image quality at given CT scanning pa- rameters. Thus, if modulation of scanning parameters to optimize radiation dose in individual patient is to be con- sidered, the modification should be made with reference to findings of this study. Though we measured these dimen-
Table 1. Statistical Correlation of Weight and Abdominal Dimensions with Image Quality Score
Anthropometric Features Co-efficient of
p-value Correlation
Weight 0.46 0.003
Abdominal wall thickness 0.47 0.002
Anteroposterior diameter 0.47 0.002
Transverse diameter 0.58 0.0001
Circumference 0.56 0.0002
Cross-sectional area 0.54 0.0004
Root-mean-square dimension 0.56 0.0002
sions from CT images, these measurements can be easily obtained prior to CT scan with a measuring tape or caliper.
Alternatively, these dimensions may be measured on the scout images or a cross-sectional image obtained at a pre- determined level.
In addition, a lesser degree of correlation between weight and image quality was found in comparison with transverse diameter, circumference, cross-sectional area and root-mean-square dimension of abdomen. This obser- vation supports the findings reported by Han et al. that ab- dominal fat distribution was more accurately related to the waist circumference than body mass index (18).
Furthermore, lesser degree of negative statistical correla- tion between image quality and average anterior abdomi- nal wall fat thickness observed in our study may be ex- plained on the basis of CT evaluation of abdominal fat de- pots reported by Seidell et al. (19). These investigators had documented that intra-abdominal fat area best correlated with the waist circumference while it showed weaker asso- ciations with abdominal skin-fold thickness. In concor- dance with this report, our findings suggest that anterior abdominal wall fat thickness may not be truly representa- tive of total abdominal fat and thus cannot be used as accu- rately to predict CT image quality at given scanning para- meters.
Overall, while our data do establish significant negative correlation between abdominal dimensions and image quality, there are some internal variations within our data.
There were two patients in our study that had “thin” ab- dominal dimensions (abdominal circumference less than 28-cm) but poor subjective image quality score.
Conversely, two patients with abdominal circumference more than 28-cm had better image quality score. These contradictory observations may be explained by the previ- ously described fact that fat enhances tissue contrast and sharpness. Some images with more fat, despite increased thickness, were in fact found to have higher image quality scores despite the beam hardening artifacts and noise, pos- sibly due to greater tissue contrast and sharpness apprecia- tion. For the same reason, images of some patients with less fat were found qualitatively less acceptable because of decreased tissue contrast and sharpness. This explains why we found less than perfect correlation between subjective image quality and other dimensions of the patients. This finding stresses the need for greater emphasis on objective measurement of image quality for radiation dose optimiza- tion as increase in radiation to patients would not necessar- ily lead to enhanced diagnostic efficacy of the study.
There are several limitations of our study. Considering the implications of the study, our sample size was relative- ly small especially for patients with greater abdominal di-
mensions. Therefore, results of our study may not reflect overall patient population. The statistical results may have been affected by inhomogeneous patient distribution be- tween different sets of abdominal measurements. In addi- tion, we acquired the images in equilibrium phase of con- trast enhancement and the results may not be valid for the dynamic phase imaging. Objective parameters of image quality and relation of these parameters with cross-section- al dimensions of patients were not evaluated in our study.
In addition, our data show that there is less than perfect statistical correlation between image quality and anthropo- metric parameters and in some patients “spurious” results of image quality were obtained for these anthropometric parameters. This suggests that in some patients modulation of scanning parameters based on these parameters may not give optimum and desired image quality.
In conclusion, our study shows that there is good correla- tion between cross-sectional dimensions and subjective im- age quality. Further investigations should determine whether these dimensions can be used to optimize scan- ning protocols in individual patients based on body habitus and reduce radiation dose to patient population without significant compromise in image quality. Of the cross-sec- tional dimensions evaluated, maximum transverse diame- ter of abdomen is the most accurate predictor of image quality. These studies should, therefore, address feasible means of measuring maximum transverse abdominal diam- eter that will be acceptable in a typical busy daily CT schedule.
References
1. Brenner DJ, Elliston CD, Hall EJ, Berdon W. Estimated risks of radiation-induced fatal cancer from pediatric CT. AJR Am J Roentgenol 2001;176:289-296
2. Nickoloff EL, Alderson PO. Radiation exposure to patients from CT: reality, public perception, and policy. AJR Am J Roentgenol 2001;176:285-287
3. United Nations Scientific Committee on the Effects of Atomic Radiation: Sources and effects of ionizing radiation. UNSCEAR 1993 report. United Nations, New York
4. Rehani MM, Berry M. Radiation doses in computed tomogra- phy. The increasing doses of radiation need to be controlled.
BMJ 2000;320:593-594
5. Rehani MM, Bongartz G, Kalender W, et al. Managing X-ray dose in Computed Tomography. ICRP Special Task Force Report 2000
6. McCollough CH, Zink FE. Performance evaluation of a multi- slice CT system. Med Phys 1996;26:2223-2230
7. Toth TL, Bromberg NB, Pan TS, et al. A dose reduction x-ray beam positioning system for high-speed multislice CT scanners.
Med Phys 2000;27:2659-2668
8. Kalender WA, Wolf H, Suess C. Dose reduction in CT by anatomically adapted tube current modulation. II. Phantom measurements. Med Phys 1999;26:2248-2253
9. Kalra MK, Wittram C, Maher MM, et al. Can noise reduction fil-
ters improve low radiation dose chest CT images? Pilot Study.
Radiology 2003;228:257-264
10. Kalra MK, Maher MM, Sahani DV, et al. Low-dose abdominal CT: Evaluation of image improvement from noise reduction fil- ters-pilot study. Radiology 2003;228:251-256
11. Cohnen M, Fischer H, Hamacher J, Lins E, Kotter R, Modder U.
CT of the head by use of reduced current and kilovoltage: rela- tionship between image quality and dose reduction. AJNR Am J Neuroradiol 2000;21:1654-1660
12. Haaga JR, Miraldi F, MacIntyre W, LiPuma JP, Bryan PJ, Wiesen E. The effect of mAs variation upon computed tomogra- phy image quality as evaluated by in vivo and in vitro studies.
Radiology 1981;138:449-454
13. Haaga JR. Radiation Dose Management: weighing risk versus benefit. AJR Am J Roentgenol 2001;177:289-91
14. Vade A, Demos TC, Olson MC, et al. Evaluation of image quali- ty using 1:1 pitch and 1.5:1 pitch helical CT in children: a com- parative study. Pediatr Radiol 1996;26:891-893
15. Diel J, Perlmutter S, Venkataramanan N, Mueller R, Lane MJ, Katz DS. Unenhanced helical CT using increased pitch for sus- pected renal colic: an effective technique for radiation dose re- duction? J Comput Assist Tomogr 2000;24:795-801
16. Naidich DP, Marshall CH, Gribbin C, Arams RS, McCauley DI.
Low-dose CT of the lungs: preliminary observations. Radiology 1990;175:729-731
17. Donnelly LF, Emery KH, Brody AS, et al. Minimizing radiation dose for pediatric body applications of single-detector helical CT: Strategies at a Large Children’s Hospital. AJR Am J Roentgenol 2001;176:303-306
18. Han TS, van Leer EM, Seidell JC, Lean ME. Waist circumfer- ence action levels in the identification of cardiovascular risk fac- tors: prevalence study in a random sample. Br Med J 1995;311:
1401-1405
19. Seidell JC, Oosterlee A, Deurenberg P, Hautvast JG, Ruijs JH.
Abdominal fat depots measured with computed tomography.
Eur J Clin Nutr 1998;42:805-815