Effects of Physician Volume on Readmission and Mortality in Elderly Patients with Heart Failure:
Nationwide Cohort Study
Joo Eun Lee
1,2, Eun-Cheol Park
2,3, Suk-Yong Jang
4, Sang Ah Lee
1,2, Yoon Soo Choy
1,2, and Tae Hyun Kim
2,5Departments of 1Public Health and 3Preventive Medicine, Yonsei University College of Medicine, Seoul;
2Institute of Health Services Research, Yonsei University College of Medicine, Seoul;
4Department of Preventive Medicine, Eulji University College of Medicine, Daejeon;
5Department of Hospital Administration, Graduate School of Public Health, Yonsei University, Seoul, Korea.
Purpose: Readmission and mortality rates of patients with heart failure are good indicators of care quality. To determine whether hospital resources are associated with care quality for cardiac patients, we analyzed the effect of number of physicians and the combined effects of number of physicians and beds on 30-day readmission and 1-year mortality.
Materials and Methods: We used national cohort sample data of the National Health Insurance Service (NHIS) claims in 2002−2013.
Subjects comprised 2345 inpatients (age: >65 years) admitted to acute-care hospitals for heart failure. A multivariate Cox regres- sion was used.
Results: Of the 2345 patients hospitalized with heart failure, 812 inpatients (34.6%) were readmitted within 30 days and 190 (8.1%) had died within a year. Heart-failure patients treated at hospitals with low physician volumes had higher readmission and mortality rates than high physician volumes [30-day readmission: hazard ratio (HR)=1.291, 95% confidence interval (CI)=1.020−1.633;
1-year mortality: HR=2.168, 95% CI=1.415−3.321]. Patients admitted to hospitals with low or middle bed and physician volume had higher 30-day readmission and 1-year mortality rates than those admitted to hospitals with high volume (30-day readmis- sion: HR=2.812, 95% CI=1.561−5.066 for middle-volume beds & low-volume physicians, 1-year mortality: HR=8.638, 95%
CI=2.072−36.02 for middle-volume beds & low-volume physicians).
Conclusion: Physician volume is related to lower readmission and mortality for heart failure. Of interest, 30-day readmission and 1-year mortality were significantly associated with the combined effects of physician and institution bed volume.
Key Words: Readmission, mortality, heart failure, physician volume
INTRODUCTION
Quality assessment, based on readmission and mortality rate of inpatients, in teaching hospitals and hospitals with 500 or
more beds has been initiated by Health Insurance Review and Assessment service of Korea (HIRA) since 2015 expecting to reduce unnecessary admission. Since 2009, penalties or in- centives have been applied in the Unites States to hospitals ac- cording to the ‘Assessment criteria for readmission rate.’ The indices of healthcare quality assessment in Korea include 5 areas; patient safety and healthcare quality, public function, healthcare delivery system, education, and research. In HIRA’s new amendment, more patient safety and healthcare quality’
area are emphasized, showing highest and moreover in- creased weight (from 60% to 65%). This revision represents the Korean governmental side of view on the importance of patient safety and healthcare quality area, especially emphasized the number of doctors per inpatient. On the other hand, the exe- cution plan has encountered strong criticism of medical spe- Received: June 16, 2017 Revised: December 13, 2017
Accepted: December 19, 2017
Corresponding author: Prof. Tae Hyun Kim, Department of Hospital Administra- tion, Graduate School of Public Health, Yonsei University, 50-1 Yonsei-ro, Seodae- mun-gu, Seoul 03722, Korea.
Tel: 82-2-2188-1521, Fax: 82-2-392-8133, E-mail: [email protected]
•The authors have no financial conflicts of interest.
© Copyright: Yonsei University College of Medicine 2018
This is an Open Access article distributed under the terms of the Creative Com- mons Attribution Non-Commercial License (http://creativecommons.org/licenses/
by-nc/4.0) which permits unrestricted non-commercial use, distribution, and repro- duction in any medium, provided the original work is properly cited.
pISSN: 0513-5796 · eISSN: 1976-2437 Yonsei Med J 2018 Mar;59(2):243-251
https://doi.org/10.3349/ymj.2018.59.2.243
cialists, who suggested that the policy is one sided and hasn’t reflected their opinions. Thus, there remain so far conflicting views on quality assessment for readmission and mortality rate. Globally, heart failure is the leading cause of readmission and death in individuals over 65 years of age.1-3 The preva- lence of heart failure in South Korea rose from 94421 in 2009 to 115063 in 2013, an increase of 4.5% per 100000, and treatment cost increased from 718 hundred million won in 2009 to 963 hundred million in 2013, a 1.3-fold increase.4 Despite its impor- tance, however, few epidemiological studies have been carried out to examine readmission and mortality for heart failure in Korea.5 Nevertheless, a Korean Acute Heart Failure Registry study found a 90-day readmission rate of 7.1% and 1-year mor- tality rate of 15%.6
Readmission can be avoidable, and financial and social bur- dens of 30-day readmissions are enormous.7 A 2009 meta-anal- ysis found that urgent readmissions are often preventable and the most common investigation period was 30 days post-dis- charge.8 Since readmission involves unnecessary medical costs, the reduction of avoidable readmission appears to be urgently needed to improve the quality of healthcare.9
Physician volume may significantly affect outcomes of care for heart-failure patients.10 Although heart-failure patients’ re- admission is an important national concern, most previous studies have focused on surgeon volume and surgical care out- comes.11-13 Only a limited number of studies have investigated the relationship between physician volume and heart-failure outcomes (readmission and mortality) with nationwide data.
An indirect evidence suggests that physician volume influences heart failure outcomes: hospitals with greater capacity as well as high physician volume are more likely to have better out- comes. However, these two indexes are distinct; the relation- ship between the number of hospital beds and health out- comes may differ from the relationship between physician volume and health outcomes. Better health outcomes in hos- pitals with a greater capacity may reflect a superior system.
Thus, we attempted to verify the effect of physician volume on health outcomes in heart-failure patients (30-day readmis- sion and 1-year mortality) and the combined effects of num- ber of physicians and beds, using nationwide cohort data from 2003 to 2013. Because the financial and social burden of heart- failure readmission and mortality is of national concern, it is necessary to examine hospital-related determinants to improve the quality of care through institutional intervention.
MATERIALS AND METHODS
Data source and study sample
This study used nationwide cohort sample data of National He- alth Insurance Service (NHIS) claims in 2003−2013. NHIS is obligatory and covers the entire Korean population. Cohort NHIS sample data include approximately one million patients
as representative of the Korean population. Data of randomly sampled individuals were classified according to gender, age, income level, region, and individual medical costs at the base- line and follow-ups until 2013. Data included subjects’ demo- graphics (gender, age, income level, and region) and medical care history [International Classification of Disease (ICD-10) diagnoses, medical treatment, and health examination], and hospital characteristics (ownership, number of beds, and num- ber of doctors). In addition, numbers were assigned for pa- tients’ mortality data from the Korea National Statistical Office to maintain confidentiality.
We selected patients over 65 years of age who had been ad- mitted to acute-care hospitals for heart failure in 2003–2013.
For inclusion, subjects had to be over 65 years of age with a pri- mary diagnosis of heart failure, identified by ICD-10 code I50.x.
This is because older patients with heart failure differ from younger patients. We excluded patients in clinics/physician of- fices and long-term-care hospitals for homogeneity. We, there- fore, identified 1392 heart-failure patients who met these criteria.
Outcome measures
Outcome variables were 30-day readmission and 1-year mor- tality for heart failure as readmission and mortality, respec- tively.14,15 In this study, 30-day readmission was defined as re- admission for any cause within 30-days post-discharge at the hospital where the individual received treatment for heart fail- ure. In the current study, we analyzed the readmission as re- peated event. Discharge and readmission information was obtained from medical records. Finally, 1-year mortality was defined as death by any cause within a year after the admis- sion date for heart failure. The observation period for mortality was longer than one year.
Covariates
The main independent variable was the number of physicians in acute-care hospitals. This study grouped the number of phy- sicians into tertile. For the combined effect analysis, physician volume was classified as low (≤16), medium (17−165), and high (>165). Bed volume was also divided into three categories:
low (≤500), medium (501−1000), and high (>1000). Individual variables included demographics (gender, age, income level), admission pathway, and comorbidity [Charlson comorbidity index (CCI) which was calculated with all the medical records of comorbidities in 2002−2013, acute myocardial infarction (AMI), vascular or circulatory disease, chronic obstructive pul- monary disease (COPD), pneumonia, and diabetes]. Institu- tional variables included hospital ownership (public or pri- vate), number of beds, and number of physicians.
Statistical analysis
Categorical variables were expressed as frequencies and per- centages, and continuous variables were described as means and standard deviations. Chi-square tests and t-tests were used
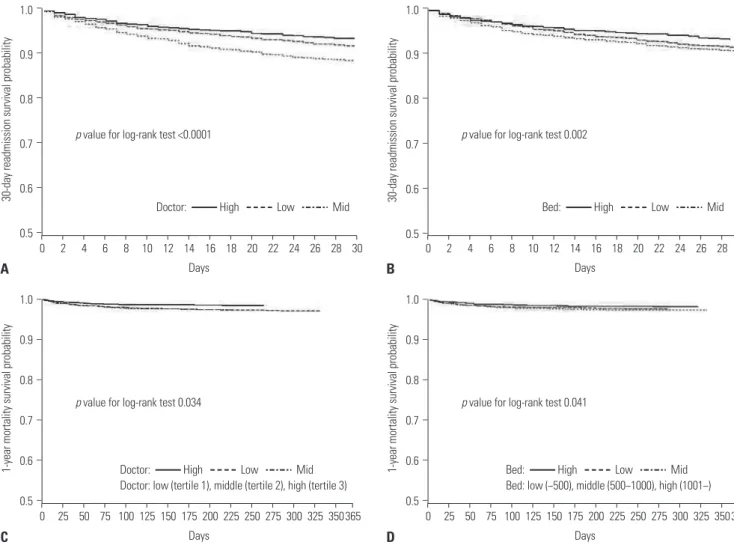
to assess differences in characteristics according to readmis- sion and mortality rates. Kaplan-Meier survival curves were constructed for physician volume (high, medium, and low), and comparisons were made using log-rank tests. We used Cox proportional hazard models using a shared-frailty model. SAS 9.4 software (SAS Institute Inc., Cary, NC, USA) was used for all analyses.
RESULTS
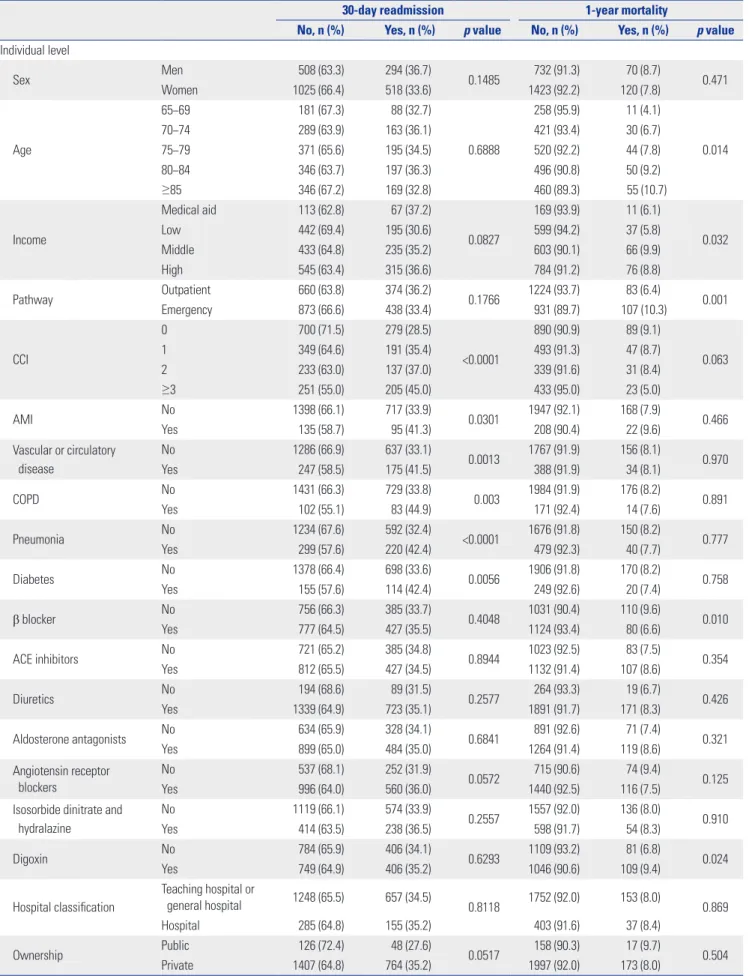
The analysis of the sample’s characteristics by 30-day readmis- sion and 1-year mortality are shown in Table 1. Of the 2345 subjects (patients hospitalized with heart failure in 2002−2013), 812 (34.6%) were readmitted within 30 days and 190 (8.1%) died within one year. High physician volume was lower for those who were readmitted within 30 days or died within one year than those who were not readmitted or had survived lon- ger than a year. A significantly greater number of patients with high CCI scores had a greater likelihood of 30-day readmis- sion than those with low CCI scores. Patients readmitted within 30 days had a higher likelihood of AMI, vascular or circulatory disease, COPD, pneumonia, and diabetes than those who were not readmitted. Patients who were readmitted within 30 days or who died within one year were more likely to have been ad- mitted to hospitals with fewer beds than those with greater ca- pacity. The proportions of 30-day readmission and 1-year mor- tality by year are shown in Supplementary Fig. 1 (only online).
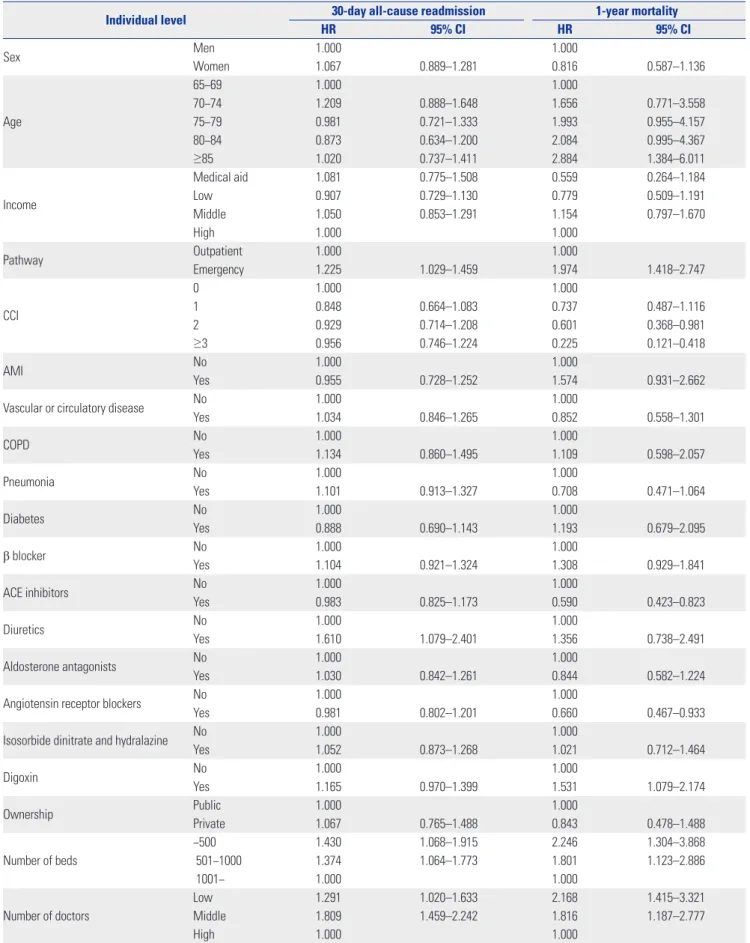
According to the Cox proportional hazard models, physician volume was significantly associated with 30-day readmission and 1-year mortality [30-day readmission: hazard ratio (HR)=
1.291, 95% confidence interval (CI)=1.020−1.633 for low num- ber of doctors, HR=1.809, 95% CI=1.459−2.242 for middle num- ber of doctors; 1-year mortality: HR=2.168, 95% CI=1.415−3.321 for low number of doctors, HR=1.816, 95% CI=1.187−2.777 for middle number of doctors] (Table 2). Patients who were ad- mitted in hospitals with low bed volume were more likely to be readmitted within 30 days (HR=1.430, 95% CI=1.068−1.915), and die within 1-year (HR=2.246, CI=1.304−3.868).
Patients admitted to hospitals with high bed and physician volume had low 30-day readmission and 1-year mortality rates than those admitted to hospitals with low or middle volume (Fig. 1).
Fig. 2 shows the results of a multivariate Cox proportional hazard model for the combined effects of number of physi- cians and beds on 30-day readmission and 1-year mortality.
Patients admitted in hospitals with higher numbers of physi- cians and beds were less likely to be readmitted within 30 days or die within 1-year after discharge. Similarly, the likelihood of 30-day readmission and 1-year mortality was lower in hospi- tals with high physician volumes and low capacity. Generally, 30-day readmission and 1-year mortality were negatively re- lated to both the numbers of physicians and beds together.
This study found significant effects of physician and bed vol- ume on readmission and mortality: in hospitals with low or middle physician and bed volume, both 30-day readmission and 1-year mortality were higher than in hospitals with high numbers of physicians and beds (30-day readmission: HR=
2.812, 95% CI=1.561−5.066 for middle-volume beds & low- volume physicians, HR=3.781, 95% CI=2.119−6.746 for mid- dle-volume beds & middle-volume physicians; 1-year mortal- ity: HR=8.638, 95% CI=2.072−36.02 for middle-volume beds &
low-volume physicians, HR=6.156, 95% CI=1.488−26.176 for middle-volume beds & middle-volume physicians).
DISCUSSION
Despite advanced and reliable healthcare service quality in South Korea, the imbalance between human and material re- sources remains as a problem to be solved. The number of hos- pital beds in Korea has been doubled during 2004−2013 while OECD average increase was only 10%. On the other hand, the number of medical doctors per 1000 populations remains the lowest among the OECD members average, 2.2 vs. 3.3.16 This imbalance may lead to adverse effect of healthcare quality in- cluding readmission and mortality.
We, therefore, examined whether physician volume was as- sociated with cardiac-related readmission and mortality, as they are considered good indicators of quality of care. Of the 2345 elderly patients with heart failure admitted to acute-care hospitals, 34.6% were readmitted within 30 days and 8.1%
died within a year of the initial hospitalization. The 30-day re- admission rate for heart failure in the United States (US) was 21.3% in 2003−2006,17 and 24.8% in 2007−2009.18 Moreover, the 30-day mortality rate was 11.2% in 2005−2008.19 In Russia, the 60-day readmission rate was 6.4%, and the 60-day mortality rate was 8.1%, whereas, the corresponding values in Eastern Europe were 19.4% and 9.9%.20 Heart-failure readmission and mortality rates in South Korea have been shown to be high in comparison to other countries. However, the study population, outcomes, and inclusion criteria in the present study are dif- ferent from those in these studies.
In the present study, elderly patients with heart failure who were treated at acute-care hospitals with low physician vol- umes were more likely to be readmitted within 30 days or die within a year. Moreover, the combined effects of number of physicians and beds on 30-day readmission and 1-year mor- tality were significant: in general, patients admitted in hospi- tals with low or middle number of physicians and beds were more likely to be readmitted within 30 days or die within 1-year after discharge compared to those in hospitals with high physician and bed volumes. However, the condition of patients admitted in hospitals with low physician volume and low ca- pacity might less severe than those with high volume and high capacity. Patients admitted in hospitals with miidlephysician
Table 1. Characteristics according to 30-day Readmission and 1-year Mortality among Inpatients with Heart Failure in 2002–2013
30-day readmission 1-year mortality
No, n (%) Yes, n (%) p value No, n (%) Yes, n (%) p value Individual level
Sex Men 508 (63.3) 294 (36.7)
0.1485 732 (91.3) 70 (8.7)
0.471
Women 1025 (66.4) 518 (33.6) 1423 (92.2) 120 (7.8)
Age
65−69 181 (67.3) 88 (32.7)
0.6888
258 (95.9) 11 (4.1)
0.014
70−74 289 (63.9) 163 (36.1) 421 (93.4) 30 (6.7)
75−79 371 (65.6) 195 (34.5) 520 (92.2) 44 (7.8)
80−84 346 (63.7) 197 (36.3) 496 (90.8) 50 (9.2)
≥85 346 (67.2) 169 (32.8) 460 (89.3) 55 (10.7)
Income
Medical aid 113 (62.8) 67 (37.2)
0.0827
169 (93.9) 11 (6.1)
0.032
Low 442 (69.4) 195 (30.6) 599 (94.2) 37 (5.8)
Middle 433 (64.8) 235 (35.2) 603 (90.1) 66 (9.9)
High 545 (63.4) 315 (36.6) 784 (91.2) 76 (8.8)
Pathway Outpatient 660 (63.8) 374 (36.2)
0.1766 1224 (93.7) 83 (6.4)
0.001
Emergency 873 (66.6) 438 (33.4) 931 (89.7) 107 (10.3)
CCI
0 700 (71.5) 279 (28.5)
<0.0001
890 (90.9) 89 (9.1)
0.063
1 349 (64.6) 191 (35.4) 493 (91.3) 47 (8.7)
2 233 (63.0) 137 (37.0) 339 (91.6) 31 (8.4)
≥3 251 (55.0) 205 (45.0) 433 (95.0) 23 (5.0)
AMI No 1398 (66.1) 717 (33.9)
0.0301 1947 (92.1) 168 (7.9)
0.466
Yes 135 (58.7) 95 (41.3) 208 (90.4) 22 (9.6)
Vascular or circulatory disease
No 1286 (66.9) 637 (33.1)
0.0013 1767 (91.9) 156 (8.1)
0.970
Yes 247 (58.5) 175 (41.5) 388 (91.9) 34 (8.1)
COPD No 1431 (66.3) 729 (33.8)
0.003 1984 (91.9) 176 (8.2)
0.891
Yes 102 (55.1) 83 (44.9) 171 (92.4) 14 (7.6)
Pneumonia No 1234 (67.6) 592 (32.4)
<0.0001 1676 (91.8) 150 (8.2)
0.777
Yes 299 (57.6) 220 (42.4) 479 (92.3) 40 (7.7)
Diabetes No 1378 (66.4) 698 (33.6)
0.0056 1906 (91.8) 170 (8.2)
0.758
Yes 155 (57.6) 114 (42.4) 249 (92.6) 20 (7.4)
β blocker No 756 (66.3) 385 (33.7)
0.4048 1031 (90.4) 110 (9.6)
0.010
Yes 777 (64.5) 427 (35.5) 1124 (93.4) 80 (6.6)
ACE inhibitors No 721 (65.2) 385 (34.8)
0.8944 1023 (92.5) 83 (7.5)
0.354
Yes 812 (65.5) 427 (34.5) 1132 (91.4) 107 (8.6)
Diuretics No 194 (68.6) 89 (31.5)
0.2577 264 (93.3) 19 (6.7)
0.426
Yes 1339 (64.9) 723 (35.1) 1891 (91.7) 171 (8.3)
Aldosterone antagonists No 634 (65.9) 328 (34.1)
0.6841 891 (92.6) 71 (7.4)
0.321
Yes 899 (65.0) 484 (35.0) 1264 (91.4) 119 (8.6)
Angiotensin receptor blockers
No 537 (68.1) 252 (31.9)
0.0572 715 (90.6) 74 (9.4)
0.125
Yes 996 (64.0) 560 (36.0) 1440 (92.5) 116 (7.5)
Isosorbide dinitrate and hydralazine
No 1119 (66.1) 574 (33.9)
0.2557 1557 (92.0) 136 (8.0)
0.910
Yes 414 (63.5) 238 (36.5) 598 (91.7) 54 (8.3)
Digoxin No 784 (65.9) 406 (34.1)
0.6293 1109 (93.2) 81 (6.8)
0.024
Yes 749 (64.9) 406 (35.2) 1046 (90.6) 109 (9.4)
Hospital classification
Teaching hospital or
general hospital 1248 (65.5) 657 (34.5)
0.8118 1752 (92.0) 153 (8.0)
0.869
Hospital 285 (64.8) 155 (35.2) 403 (91.6) 37 (8.4)
Ownership Public 126 (72.4) 48 (27.6)
0.0517 158 (90.3) 17 (9.7)
0.504
Private 1407 (64.8) 764 (35.2) 1997 (92.0) 173 (8.0)
and bed volumes were more likely to be readmitted within 30 days or die within 1-year than those patients admitted in hos- pitals with low number of physicians.
Consistent with previous studies,21,22 the present findings show that patients admitted in hospitals with a high physician volume had a significantly lower risk of readmission and death than those admitted in hospitals with low physician volume.
A previous study has found that higher physician volume is
associated with lower risk of mortality for heart failure.10 Fur- thermore, studies on combined effects showed that high phy- sician volume and hospital-bed ratio has better outcomes (post-surgery mortality).23,24 However, some studies found that high physician volume is not significantly associated with mor- tality and even found a positive relationship to readmission.13,25 The present study has several limitations. Readmission and mortality rates could be underestimated since this study in- Table 1. Characteristics according to 30-day Readmission and 1-year Mortality among Inpatients with Heart Failure in 2002–2013
30-day readmission 1-year mortality
No, n (%) Yes, n (%) p value No, n (%) Yes, n (%) p value Number of beds
−500 648 (65.3) 345 (34.7)
0.6466
903 (91.1) 88 (8.9)
0.057
501−1000 538 (64.7) 294 (35.3) 761 (91.3) 73 (8.8)
1001− 347 (66.7) 173 (33.3) 491 (94.4) 29 (5.6)
Number of doctors
Low 480 (62.9) 283 (37.1)
<0.0001
687 (89.9) 77 (10.1)
0.003
Middle 367 (53.1) 324 (46.9) 628 (91.0) 62 (9.0)
High 686 (77.0) 205 (23.0) 840 (94.3) 51 (5.7)
Combined variable
Low-volume beds &
low-volume physicians 124 (72.1) 48 (27.9)
<0.0001
161 (93.6) 11 (6.4)
<0.0001 Low-volume beds &
middle-volume physicians 176 (52.5) 159 (47.5) 298 (89.5) 35 (10.5)
Low-volume beds &
high-volume physicians 348 (71.6) 138 (28.4) 444 (91.4) 42 (8.6)
Middle-volume beds &
low-volume physicians 201 (63.0) 118 (37.0) 279 (87.2) 41 (12.8)
Middle-volume beds &
middle-volume physicians 132 (49.4) 135 (50.6) 243 (90.7) 25 (9.3)
Middle-volume beds &
high-volume physicians 205 (83.3) 41 (16.7) 239 (97.2) 7 (2.9)
High-volume beds &
low-volume physicians 155 (57.0) 117 (43.0) 247 (90.8) 25 (9.2)
High-volume beds &
middle-volume physicians 59 (66.3) 30 (33.7) 87 (97.8) 2 (2.3)
High-volume beds &
high-volume physicians 133 (83.7) 26 (16.4) 157 (98.7) 2 (1.3)
Hospital level
Hospital classification
Teaching hospital or
general hospital 107 (32.4) 223 (67.6)
<0.0001 229 (69.4) 101 (30.6)
<0.0001
Hospital 283 (66.0) 146 (34.0) 394 (91.8) 35 (8.2)
Ownership Public 16 (37.2) 27 (62.8)
0.0788 29 (67.4) 14 (32.6)
0.018
Private 374 (52.2) 342 (47.8) 594 (83.0) 122 (17.0)
Number of beds
−500 367 (59.3) 252 (40.7)
<0.0001
545 (88.1) 74 (12.0)
<0.0001
501−1000 22 (19.8) 89 (80.2) 62 (55.9) 49 (44.1)
1001− 1 (3.5) 28 (96.6) 16 (55.2) 13 (44.8)
Number of doctors
Low 207 (62.5) 124 (37.5)
<0.0001
165 (79.7) 42 (20.3)
0.004
Middle 77 (33.3) 154 (66.7) 167 (76.6) 51 (23.4)
High 106 (53.8) 91 (46.2) 291 (87.1) 43 (12.9)
Total (individual level) 1533 (65.4) 812 (34.6) 2155 (91.9) 190 (8.1)
Total (hospital level) 390 (51.4) 369 (48.6) 623 (82.1) 136 (17.9)
SD, standard deviation; CCI, charlson comorbidity index; AMI, acute myocardial infarction; COPD, chronic obstructive pulmonary disease; ACE, angiotensin con- verting enzyme.
Table 2. Multivariate Cox Proportional Hazard Models with 30-day Readmission and 1-year Mortality in 2002−2013
Individual level 30-day all-cause readmission 1-year mortality
HR 95% CI HR 95% CI
Sex Men 1.000 1.000
Women 1.067 0.889–1.281 0.816 0.587–1.136
Age
65−69 1.000 1.000
70−74 1.209 0.888–1.648 1.656 0.771–3.558
75−79 0.981 0.721–1.333 1.993 0.955–4.157
80−84 0.873 0.634–1.200 2.084 0.995–4.367
≥85 1.020 0.737–1.411 2.884 1.384–6.011
Income
Medical aid 1.081 0.775–1.508 0.559 0.264–1.184
Low 0.907 0.729–1.130 0.779 0.509–1.191
Middle 1.050 0.853–1.291 1.154 0.797–1.670
High 1.000 1.000
Pathway Outpatient 1.000 1.000
Emergency 1.225 1.029–1.459 1.974 1.418–2.747
CCI
0 1.000 1.000
1 0.848 0.664–1.083 0.737 0.487–1.116
2 0.929 0.714–1.208 0.601 0.368–0.981
≥3 0.956 0.746–1.224 0.225 0.121–0.418
AMI No 1.000 1.000
Yes 0.955 0.728–1.252 1.574 0.931–2.662
Vascular or circulatory disease No 1.000 1.000
Yes 1.034 0.846–1.265 0.852 0.558–1.301
COPD No 1.000 1.000
Yes 1.134 0.860–1.495 1.109 0.598–2.057
Pneumonia No 1.000 1.000
Yes 1.101 0.913–1.327 0.708 0.471–1.064
Diabetes No 1.000 1.000
Yes 0.888 0.690–1.143 1.193 0.679–2.095
β blocker No 1.000 1.000
Yes 1.104 0.921–1.324 1.308 0.929–1.841
ACE inhibitors No 1.000 1.000
Yes 0.983 0.825–1.173 0.590 0.423–0.823
Diuretics No 1.000 1.000
Yes 1.610 1.079–2.401 1.356 0.738–2.491
Aldosterone antagonists No 1.000 1.000
Yes 1.030 0.842–1.261 0.844 0.582–1.224
Angiotensin receptor blockers No 1.000 1.000
Yes 0.981 0.802–1.201 0.660 0.467–0.933
Isosorbide dinitrate and hydralazine No 1.000 1.000
Yes 1.052 0.873–1.268 1.021 0.712–1.464
Digoxin No 1.000 1.000
Yes 1.165 0.970–1.399 1.531 1.079–2.174
Ownership Public 1.000 1.000
Private 1.067 0.765–1.488 0.843 0.478–1.488
Number of beds
−500 1.430 1.068–1.915 2.246 1.304–3.868
501−1000 1.374 1.064–1.773 1.801 1.123–2.886
1001− 1.000 1.000
Number of doctors
Low 1.291 1.020–1.633 2.168 1.415–3.321
Middle 1.809 1.459–2.242 1.816 1.187–2.777
High 1.000 1.000
HR, hazard ratio; CCI, charlson comorbidity index; AMI, acute myocardial infarction; COPD, chronic obstructive pulmonary disease; ACE, angiotensin converting enzyme.
cluded only patients with heart failure admitted in acute-care hospitals. Furthermore, since only patients over 65 years of age were included in this study, the results cannot be extended to patients 65 years or younger. We were unable to account for
severity of heart failure, reasons for readmission, and cause of death, as the NHIS data did not include these informations.
Inaccuracy of risk adjustment may lead to skewed results be- cause severe cases of heart failure tend to be concentrated in 1.0
0.9 0.8 0.7 0.6 0.5
1.0 0.9 0.8 0.7 0.6 0.5
1.0 0.9 0.8 0.7 0.6 0.5 1.0 0.9 0.8 0.7 0.6 0.5
−
−
−
−
−
−
−
−
−
−
−
−
−
−
−
−
−
−
−
−
−
−
−
−
30-day readmission survival probability 1-year mortality survival probability 1-year mortality survival probability 30-day readmission survival probability
0
0 0
0 2
25 25
2 4
50 50
4 6
75 75
6 8
100 100
8 10
125 125
10 12
150 150
12 14
175 175
14 16
200 200
16 18
225 225
18 20
250 250
20 22
275 275
22 24
300 300
24 26
325 325
26 28
350 350
28 30
365 365
30 Days
Days Days
A Days
C
B
D Doctor: High Low Mid
Doctor: High Low Mid Doctor: low (tertile 1), middle (tertile 2), high (tertile 3)
Bed: High Low Mid Bed: low (−500), middle (500−1000), high (1001−)
Bed: High Low Mid p value for log-rank test <0.0001
p value for log-rank test 0.034 p value for log-rank test 0.041
p value for log-rank test 0.002
Fig. 1. Kaplan-Meier curves of 30-day heart failure all-cause readmission and 1-year mortality according to number of physicians and number of beds.
HR
10.000 9.000 8.000 7.000 6.000 5.000 4.000 3.000 2.000 1.000 0.000
Low-volume beds
& low-volume physicians
Low-volume beds
& middle-volume physicians
Low-volume beds
& high-volume physicians
Middle-volume beds & low- volume physicians
Middle-volume beds & middle- volume physicians
Middle-volume beds & high- volume physicians
High-volume beds
& low-volume physicians
High-volume beds
& middle-volume physicians
High-volume beds
& high-volume physicians Fig. 2. HR and 95% confidence intervals for 30-day readmission and 1-year mortality associated with combined effects of number of physicians and number of beds: adjusted for patient characteristics and hospital characteristics. *p<0.05. HR, hazard ratio,
30-day readmission 1-year mortality
1.119
3.676
*
2.462
* 2.812
* 3.781
*
1.175
2.264
*
1.418
1.000 3.686
7.573
*
5.430
*
8.638
*
6.156
*
0.959
4.705
*
1.665
1.000
−
−
−
−
−
−
−
−
−
−
−
large hospitals with a large number of physicians. Therefore, we controlled for admission pathway, CCI scores, and several diseases related to heart failure. Moreover, since the sample data were limited in scope, we were unable to consider all pos- sible covariates associated with readmission and mortality for heart failure, as well as physician specialization. While this study examined the effects, the results do not prove the causality.
Since NHI data has limitation for accuracy of diagnosis, we recommend that the results be interpreted with care.
Despite these limitations, the current study has several st- rengths. Using national data of one million patients and strati- fied random sampling ensured external validity and permit- ted transnational comparisons. To the best of our knowledge, this is the first study to examine the effects of physician volume on heart-failure patients’ readmission and mortality in Korea.
Furthermore, since this is an empirical cohort study, the asso- ciation observed between physician volume and readmission and mortality has greater support than a cross-sectional de- sign would allow. We controlled patients (demographic, so- cioeconomic, and medical factors) and institutional factors, as they affect readmission and ultimately patient outcomes. Most previous studies on readmission did not consider patients’ de- mographics or hospital-related factors. Furthermore, this study used medical-history and mortality data from NHIS claims and reliable national statistics. We attempted to homogenize the study population by using clear inclusion criteria: patients over 65 years of age who were admitted to acute-care hospi- tals for heart failure. Finally, the present findings are useful to policy makers who develop strategies to control hospital read- mission rates and mortality. This ultimately helps improve the quality of care for heart failure, which is of national importance.
Thus, consideration of physician volumes in hospitals when formulating and implementing various health policies is nec- essary.
In conclusion, hospital physician volumes were inversely related to readmission and mortality in patients with heart failure. Furthermore, the combined effect of number of beds and physicians on readmission and mortality was significant.
Therefore, hospital capacity might be a modifier of physician volumes’ effect on readmission and mortality, especially in acute-care hospitals with fewer beds. Thus, the present find- ings provide evidence for developing new strategies to reduce avoidable readmission and mortality. Policy makers should continue to monitor readmission and mortality rates for heart failure and identify hospitals with low physician volumes to en- sure good quality care, especially in those with a smaller capacity.
ACKNOWLEDGEMENTS
National Health Insurance Service provided national level of data.
ORCID
Joo Eun Lee https://orcid.org/0000-0002-3684-4892 Tae Hyun Kim https://orcid.org/0000-0003-1053-8958
REFERENCES
1. Keenan PS, Normand SL, Lin Z, Drye EE, Bhat KR, Ross JS, et al.
An administrative claims measure suitable for profiling hospital performance on the basis of 30-day all-cause readmission rates among patients with heart failure. Circ Cardiovasc Qual Outcomes 2008;1:29-37.
2. Jencks SF, Williams MV, Coleman EA. Rehospitalizations among patients in the Medicare fee-for-service program. N Engl J Med 2009;360:1418-28.
3. Ross JS, Chen J, Lin Z, Bueno H, Curtis JP, Keenan PS, et al. Recent national trends in readmission rates after heart failure hospital- ization. Circ Heart Fail 2010;3:97-103.
4. Jung HJ. Practice patterns for patients with heart failure. National Health Insurance Service;2014. [accessed on 2016 April 20]. Avali- able at: https://eiec.kdi.re.kr/skin_2016/common/epicdown- load.jsp?num=135717&filenum=1.
5. Kim SJ, Park EC, Kim TH, Yoo JW, Lee SG. Mortality, length of stay, and inpatient charges for heart failure patients at public versus private hospitals in South Korea. Yonsei Med J 2015;56:853-61.
6. Choi DJ, Han S, Jeon ES, Cho MC, Kim JJ, Yoo BS, et al. Character- istics, outcomes and predictors of long-term mortality for patients hospitalized for acute heart failure: a report from the Korean Heart Failure Registry. Korean Circ J 2011;41:363-71.
7. Padhukasahasram B, Reddy CK, Li Y, Lanfear DE. Joint impact of clinical and behavioral variables on the risk of unplanned read- mission and death after a heart failure hospitalization. PLoS One 2015;10:e0129553.
8. Korea Health Industry Development Institute. Guidelines for hos- pital evaluation program 2009. Ministry of Health and Welfare;
2009. p.254.
9. Chen Y, Stewart P, Dales R, Johansen H, Scott G, Taylor G. Ecologi- cal measures of socioeconomic status and hospital readmissions for asthma among Canadian adults. Respir Med 2004;98:446-53.
10. Joynt KE, Orav EJ, Jha AK. Physician volume, specialty, and out- comes of care for patients with heart failure. Circ Heart Fail 2013;
6:890-7.
11. Birkmeyer JD, Stukel TA, Siewers AE, Goodney PP, Wennberg DE, Lucas FL. Surgeon volume and operative mortality in the United States. N Engl J Med 2003;349:2117-27.
12. Hu JC, Gold KF, Pashos CL, Mehta SS, Litwin MS. Role of surgeon volume in radical prostatectomy outcomes. J Clin Oncol 2003;21:
401-5.
13. Moscucci M, Share D, Smith D, O’Donnell MJ, Riba A, McNamara R, et al. Relationship between operator volume and adverse out- come in contemporary percutaneous coronary intervention prac- tice: an analysis of a quality-controlled multicenter percutaneous coronary intervention clinical database. J Am Coll Cardiol 2005;
46:625-32.
14. Krumholz HM, Merrill AR, Schone EM, Schreiner GC, Chen J, Bradley EH, et al. Patterns of hospital performance in acute myo- cardial infarction and heart failure 30-day mortality and readmis- sion. Circ Cardiovasc Qual Outcomes 2009;2:407-13.
15. Bueno H, Ross JS, Wang Y, Chen J, Vidàn MT, Normand SL, et al.
Trends in length of stay and short-term outcomes among Medi- care patients hospitalized for heart failure, 1993-2006. JAMA 2010;
303:2141-7.
16. OECD. OECD Health Statistics 2016. 2016.
17. Hernandez AF, Greiner MA, Fonarow GC, Hammill BG, Heiden- reich PA, Yancy CW, et al. Relationship between early physician follow-up and 30-day readmission among Medicare beneficiaries hospitalized for heart failure. JAMA 2010;303:1716-22.
18. Dharmarajan K, Hsieh AF, Lin Z, Bueno H, Ross JS, Horwitz LI, et al. Diagnoses and timing of 30-day readmissions after hospital- ization for heart failure, acute myocardial infarction, or pneumonia.
JAMA 2013;309:355-63.
19. Krumholz HM, Lin Z, Keenan PS, Chen J, Ross JS, Drye EE, et al.
Relationship between hospital readmission and mortality rates for patients hospitalized with acute myocardial infarction, heart failure, or pneumonia. JAMA 2013;309:587-93.
20. Mentz RJ, Cotter G, Cleland JG, Stevens SR, Chiswell K, Davison BA, et al. International differences in clinical characteristics, man- agement, and outcomes in acute heart failure patients: better short-term outcomes in patients enrolled in Eastern Europe and Russia in the PROTECT trial. Eur J Heart Fail 2014;16:614-24.
21. Weller WE, Rosati C, Hannan EL. Relationship between surgeon and hospital volume and readmission after bariatric operation. J Am Coll Surg 2007;204:383-91.
22. Mesman R, Westert GP, Berden BJ, Faber MJ. Why do high-vol- ume hospitals achieve better outcomes? A systematic review about intermediate factors in volume-outcome relationships. Health Pol- icy 2015;119:1055-67.
23. Nuttall M, van der Meulen J, Phillips N, Sharpin C, Gillatt D, Mc- Intosh G, et al. A systematic review and critique of the literature re- lating hospital or surgeon volume to health outcomes for 3 urologi- cal cancer procedures. J Urol 2004;172(6 Pt 1):2145-52.
24. Srinivas VS, Hailpern SM, Koss E, Monrad ES, Alderman MH. Ef- fect of physician volume on the relationship between hospital volume and mortality during primary angioplasty. J Am Coll Cardi- ol 2009;53:574-9.
25. Horwitz LI, Lin Z, Herrin J, Bernheim S, Drye EE, Krumholz HM, et al. Association of hospital volume with readmission rates: a ret- rospective cross-sectional study. BMJ 2015;350:h447.