*Corresponding author: Kwang-Min Choi, Tel: +82-31-209-1206, E-mail: [email protected]
Samsung Health Research Institute(SHRI), 95, Samsung 2-Ro, Giheung-Gu, Yongin-Si, Gyeonggi-Do, 446-811, Korea Received: July 10, 2015, Revised: September 14, 2015, Accepted: September 16, 2015
This is an Open-Access article distributed under the terms of the Creative Commons Attribution Non-Commercial
License(http://creativecommons.org/licenses/by-nc/3.0) which permits unrestricted non-commercial use, distribution, and reproduction in any medium, provided the original work is properly cited.
http://dx.doi.org/10.15269/JKSOEH.2015.25.3.312
PAHs 농도 분포에 따른 GC/MS와 HPLC의 분석특성에 관한 연구
홍좌령ㆍ최광민* 삼성전자 건강연구소
Analytical Characteristics of GC/MS and HPLC according to the Concentration Distribution of PAHs
Jwa-Ryung Hong·Kwang-Min Choi*
Samsung Health Research Institute, Samsung Electronics Co. Ltd.
ABSTRACT
Objectives: The purpose of this study was to determine the best method to analyze PAHs at extremely low concentrations. To this end, 16 PAHswere analyzed simultaneously by GC/MS, HPLC/FLD and HPLC/UVD, and the analytical characteristics of HPLC and GC/MS were compared.
Methods: This study was conducted by GC/MS and HPLC/FLD/UVD, and evaluated linearity, precision and detection limit.
Standard solutions were prepared for 21 samples in the range of 0.00001~1.0 ㎍/mL and the samples were divided into four groups. All samples were made in three sets and analysis was replicated seven times.
Results: Sixteen PAHs could be simultaneously separated by HPLC and GC/MS, and the adequate equipment was HPLC/FLD. The retention times by HPLC were shorter than GC/MS, and HPLC had better separation for most PAHs than GC/MS. The peaks of naphthalene and naphthalene-D8 partially overlapped for GC/MS. HPLC/FLD had a 20-2000 times lower limit of detection than GC/MS and UVD. However FLD was not adequate for analyzing acenaphthylene because it has too low a fluorescence quantum yield to be detected. The precision of HPLC/FLD/UVD and GC/MS showed less than 20% at 0.001 ㎍/mL PAHs and when the concentration was higher, the coefficient of variation was decreased. HPLC/FLD was better for the overall detection of limits.
Conclusions: The results indicate that the HPLC/FLD method has good linear range, precision and a detection of limits from 0.00001~0.0001 ㎍/mL for all 16 PAHs. This study contributes to providing useful data for analysis technology and can be applied to occupational exposure measurement for PAHs in workplaces.
Key words: PAHs, HPLC/FLD, HPLC/UVD, GC/MS
I. 서 론
다환방향족탄화수소(Polycyclic aromatic hydrocarbons, 이하 PAHs)는 2개 이상의 벤젠고리가 선형으로 각을 지어 있거나 밀집된 구조로 이루어져 있는 유기화합물로 화학연료나 유기물의 불완전 연소시 부산물로 발생하는 물질이다(Raiyani et al. 1993). 공기역학적 직경이 2.5
㎛ 미만의 입자상, 가스상 물질로서 공기 중에 방출되며,
비점과 융점이 높으나 증기압이 낮고, 분자량 증가에 따라 극히 낮은 수용해도를 나타내는 것이 일반적인 성질이다(EPA, 1997).
PAHs는 동종 화합물이 수백여 종에 이르며 현재 까지 독성이 알려진 화합물은 benzo[a]pyrene 외 50 여종으로 특히 일부 물질은 유전독성과 발암성을 나 타내는 것으로 알려져 있다(ATSDR, 1995). IARC (International Agency for Research on Cancer)에서는
발암 물질들을 등급별로 각각 Group 1, 2A, 2B, 3 및 4 단계로 구분하고 있으며, 발암 등급 1인 benzo[a]
pyrene을 비롯하여 benzo[k]fluoranthene, dibenz[a,h]
anthracene, indeno -[1,2,3-cd]pyrene, benzo[b]fluoranthene, chrysene, benz[a]anthracene, naphthalene은 인체 발암 가능 물질 2B 이상으로 분류하고 관리를 요하는 물 질로 구분되어 있다(IARC, 2006). 미국 EPA 및 ASTM(American Society for Testing and Material, 1998) 등에서는 PAHs 성분들 중에서 16종 성분을 중점 관리 물질로 지정하여 관리하고 있다(EPA, 1997).
PAHs는 주로 연소과정에서 형성되고, 배출되는 기전은 열분해 과정과 열생성 과정의 두 단계로 이 루어진다. 유기물질이 높은 열을 받으면 부분적으로 분해되어 크기가 작은 불안정한 조각들로 나누어지 고, 이 조각들은 반응성이 매우 큰 라디칼들로 재조 합되어 안정된 PAHs를 만들게 된다(Mastral &
Callean, 2000). 따라서 일반적인 유기화합물에서 열 분해 과정을 통해 PAHs가 생성될 수 있으며, 또한 페닐기가 붙은 화합물은 고온의 조건일 때 PAHs가 생성될 수 있다(Zander & Gollin, 1993).
우리나라 대기 중 PAHs 농도는 공단지역에서 14.52~193.48 ng/m3(Jung et al., 2011)으로 분포하며 다중이용시설 내 실내 공기 중 PAHs 농도는 0.21~
34.57 ng/m3(Jeon et al., 2012)으로 보고되고 있다. 일 반적으로 PAHs 분석법으로는 가스크로마토그래피/
질량분석기(Gas chromatography/Mass spectrometer, GC/MS)와 고성능액체크로마토그래피(High Performance Liquid Chromatography, HPLC) 방법이 많이 사용되 고 있는데 US EPA에서는 TO-13A 방법(GC/MS)을 공정시험방법으로 권장하고 있으며, NIOSH(National Institute for Occupational Safety and Health)에서는 5506법에서 HPLC/UVD 법을 제안하고 있다. HPLC 방법은 이성질체 성분들 간에 분리가 잘 되지 않아 머무름 시간이 겹치는 물질이 있는 단점이 있으며 (Jeon et al., 2012), GC/MS는 peak 뭉침 현상으로 naphthalene, acenaphthylene, acenaphthene, fluorene 등 휘발성이 높은 4종의 PAHs 분석에 제한성을 가진다 고 하였다(Yoon et al., 2008).
PAHs는 반응성, 온도 민감성 및 휘발 특성 등으로 인해 시료 샘플링이나 분석기술에 따라 평가 결과가
40%까지 달라질 수 있으며(International Conference Air quality in Europe, 1999), 특히 극미량일 경우 분 석 오차는 더욱 커지기 때문에(Sloss & Gardner, 1995) 극히 낮은 농도까지 검출 가능한 신뢰도 있는 분석 방법이 필요하다. 따라서 정밀도와 정확도가 낮 은 PAHs의 분석방법에 대한 질을 높이고 저농도에 서도 정확도가 높은 분석 방법의 확인이 요구된다.
본 연구에서는 US EPA에서 관리대상 물질로 선정 한 16종 PAHs 화합물을 대상으로 GC/MS와 HPLC 를 이용한 PAHs 분석 특성을 비교 검토하였다. 또한 농도 범위에 따른 기기의 분석 감도, 선형성 및 정밀 도를 평가하여 저농도 PAHs를 분석하기 위한 최적 의 기기 분석 방법을 제시하고자 한다.
Ⅱ. 연구 방법
1. 연구대상
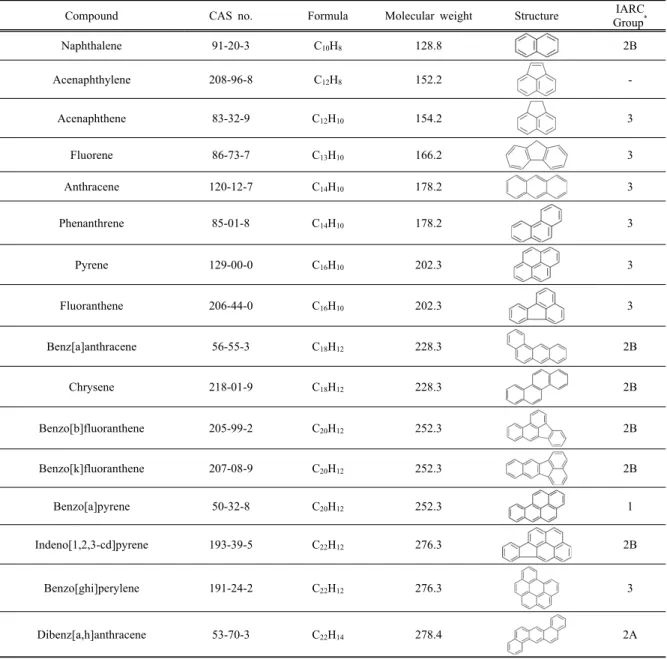
EPA TO-13A에서 지정한 우선관리대상물질 16종 (benzo(a)pyrene, naphthalene 등)을 대상으로 실험 하 였고, 각 물질의 화학식, 분자량, 화학 구조 및 IARC 발암 등급은 Table 1과 같다.
2. 표준물질
PAHs 시약은 Supelco(Sigma-Aldrich, USA)사의 16종 혼합 물질(EPA 610 Polynuclear aromatic hydrocarbon mixture)을 methanol과 acetonitrile을 이용하여 단계별 로 희석하였다. 기기 감도 변화에 따른 보정을 위해 acenaphthene-D10, chrysene-D12, naphthalene-D8, 1,4- dichlorobenzene-D4, perylene-D12, phenanthrene-D10 6 종이 포함된 deuterated 물질(EPA 8270 Semivolatile internal standard mix, Sigma-Aldrich, USA)을 내부표준 물질(Internal standard)로 사용하였다. 분석에 사용된 용매 methanol과 acetonitrile은 Sigma-Aldrich사의 HPLC grade(99.9%)이며, 물질 희석 및 전처리 방법은 EPA TO-13A와 NIOSH 5506 방법을 참고 하였다.
3. GC/MS 분석 장비 및 방법
GC/MS는 가스크로마토그래피(Agilent 7890A, USA) 에 질량분석기(Agilent 5975C, USA)가 연결된 것을 이 용하였고, 물질 분리를 위해 5% phenyl, 95%
methylpolysiloxane이 충진된 HP-5MS(0.25 mm×60 m,
Compound CAS no. Formula Molecular weight Structure IARC Group*
Naphthalene 91-20-3 C10H8 128.8 2B
Acenaphthylene 208-96-8 C12H8 152.2 -
Acenaphthene 83-32-9 C12H10 154.2 3
Fluorene 86-73-7 C13H10 166.2 3
Anthracene 120-12-7 C14H10 178.2 3
Phenanthrene 85-01-8 C14H10 178.2 3
Pyrene 129-00-0 C16H10 202.3 3
Fluoranthene 206-44-0 C16H10 202.3 3
Benz[a]anthracene 56-55-3 C18H12 228.3 2B
Chrysene 218-01-9 C18H12 228.3 2B
Benzo[b]fluoranthene 205-99-2 C20H12 252.3 2B
Benzo[k]fluoranthene 207-08-9 C20H12 252.3 2B
Benzo[a]pyrene 50-32-8 C20H12 252.3 1
Indeno[1,2,3-cd]pyrene 193-39-5 C22H12 276.3 2B
Benzo[ghi]perylene 191-24-2 C22H12 276.3 3
Dibenz[a,h]anthracene 53-70-3 C22H14 278.4 2A
*Group 1-carcinogenic to human; 2A-probably carcinogenic; 2B-possibly carcinogenic; 3-not classifiable as to carcinogenicity to human(IARC Monographs, 2010)
Table 1. Molecular weight and structure about compound of PAHs
0.25 um id)컬럼을 사용하였다. 시료는 EI(Electronic Ionization) mode를 이용하여 70 eV의 에너지로 이온화 하였으며, 분석 감도를 향상시키기 위해 시료의 주입 비율(Split ratio)은 Splitless mode로 하였다. PAHs 16종 의 혼합 표준용액을 먼저 SCAN mode로 분석하여 각 각의 머무름 시간(Retention time)과 질량스펙트럼을
확인하고, 그 결과를 바탕으로 전구이온(Precursor ion)(m/z)을 설정하여 특정 질량을 가지는 이온만을 선 택 하여 검출하는 SIM(Selected Ion Monitoring) mode 를 이용하여 각 물질을 정량하였다. 운반기체로 사용 한 헬륨은 순도 99.999%를 1.0 mL/min의 유속으로 흘 려주었고, 시료는 1 ㎕를 주입하였다. 자세한 분석 조건
Variables Conditions
Instrument HPLC(Agilent 1260)
Detector
UVD 254 nm
FLD (excitation /emission)
13.5 min λ1 245 nm/375 nm
14.8 min λ2 260 nm/420 nm
18.0 min λ3 254 nm/390 nm
21.0 min λ4 260 nm/420 nm
28.0 min λ5 293 nm/498 nm
Column Eclipse 4.5 ×250 mm, 5 ㎛ PAHs C18 column
Mobile condition (Gradient mode)
0 min : 50% ACN 0.05 min : 85% ACN 3 min : 50% ACN 13 min : 85% ACN 15 min : 100% ACN
40 min : 100% ACN(Post time : 3 min)
Flow rate 1.0 mL/min
Injection volume 10 ㎕ Table 3. Conditions of HPLC system
Variables Conditions
GC GC(Agilent 7890A), MS(Agilent 5975C)
Column HP-5MS(60 m×0.25 mm, 0.25 um ID)
Oven 90℃-10℃/min(200℃, 5 min hold) - 5℃/min(250℃, 5 min hold) - 5℃/min(300℃, 15 min hold) Injection 1 ㎕(Splitless mode)
Injector temp. 275℃ Carrier gas He(99.999%) Ionization mode EI(70 eV) Ion source temp. 230℃
MS Quad 150℃
TIC scan range 45~550(m/z) Table 2. Conditions of GC/MS system
은 Table 2와 같다.
4. HPLC/FLD/UVD 분석 장비 및 방법
HPLC는 Agilent사의 1260 Infinity LC system(USA) 로 분석하였고, 자외/가시광선 흡광검출기(UV/VIS absorbance detector, UVD)와 형광검출기(Fluorescence detector, FLD)를 이용하여 검출한계 및 분해능을 비 교하였다. 자외/가시광선 흡광검출기는 분석 시작점 부터 종료시까지 254 nm로 일정하게 유지하고, 형광 검출기는 감도를 높이기 위해 물질별로 파장을 다르 게 하였다.
각 물질의 여기(Excitation) 파장과 방출(Emission) 파
장은 λ1=245 nm / 375 nm(naphthalene, acenaphthene, fluorene), λ2=260 nm / 420 nm(antracene, fluoranthene), λ3=254 nm / 390 nm(pyrene, benzo[a]antracene, chrysene), λ4=260 nm/ 420 nm(benzo[b]fluoranthene, benzo[k]fluoranthene, benzo[a]pyyrene, dibenzo[a,h]anthracene, benzo[g,h,i]
perylene), λ5=293 nm/498 nm(indeno[1,2,3-c,d]pyrene) 로 설정하였다.
검출기 외 컬럼이나 이동상(Mobile phase) 등 다른 조건들은 모두 동일하게 유지하였고 컬럼은 각 물질 의 분리도(Resolution)를 향상시키기 위해 Agilent사의 PAH 전용 컬럼(C18-PAH column, 5 ㎛ ×250 mm, 4.6
㎛)을 사용하였다. Acetonitrile과 증류수를 이용하여
Figure 1. GC/MS chromatogram of PAHs
시간에 따라 이동상의 비율을 조절하는 Gradient eluting system으로 분석하였으며, 유량은 1.0 mL/min 으로 설정하였다. 오븐 온도는 30℃로 하여 이동상의 온도 변화에 따른 머무름 시간의 영향을 최소화 하였 다(Table 3).
5. 평가 방법
기기별 PAHs 분석법 효율 확인을 위해 선형성, 분 석 정밀도 및 검출한계(Limit of detection, LOD)를 평가하였다. 선형성은 PAHs 표준용액을 주입하여 얻어진 피크의 각 농도별 면적 비로 얻어진 검량선 으로부터 직선식의 상관계수(R2)로 검토하였다. 정밀 도는 각 표준물질의 반복 측정에 의한 피크면적의 상대표준편차(Relative standard deviation, RSD)로 평 가하였다. 검출한계는 기기가 검출 가능한 가장 낮은 농도로 표준용액을 분석하여 시료량과 이에 대한 반 응간의 선형회귀식(Linear Regression Equation)과 이 회귀 방정식의 표준오차(Standard error, SE)를 구하 여 계산하였다(NIOSH, 1995).
테스트 시료는 0.00001~1.0 ㎍/mL 농도 범위의 PAHs 표준 용액을 희석하여 총 21개의 시료를 제작하고 농도 별로 4 단계의 그룹으로 나누어 테스트 하였고(Group 1: 0.00001~0.0001 ㎍/mL, Group 2: 0.0001~0.001 ㎍/mL, Group 3: 0.001~0.1 ㎍/mL, Group 4: 0.1~1.0 ㎍/mL), 모든 시료는 3 세트로 만들어 7회 반복 분석하였다.
Ⅲ. 결과 및 고찰
1. GC/MS
SCAN mode로 확인한 Target ion과 SIM mode로 정량한 물질별 머무름 시간 및 크로마토그램은 Table 4와 Figure 1과 같다.
Table 4. Selected ions of PAHs by GC/MS
Compound Selected ion(m/z) RT(min)
Naphthalene 128, 102 8.96
Acenaphthylene 152, 76 12.51
Acenaphthene 153, 76 13.01
Fluorene 166, 83 14.62
Phenanthrene 178, 152 18.81
Anthracene 178, 152 19.03
Fluoranthene 202, 101 24.90
Pyrene 202, 101 26.02
Benzo(a)anthracene 228, 114 33.93
Chrysene 228, 113 34.21
Benzo(b)fluoranthene 252, 126 40.56 Benzo(k)fluoranthene 252, 126 40.68
Benzo(a)pyrene 252, 126 42.22
Indeno(1,2,3)pyrene 276, 138 49.14
Dibenz(a,h)anthracene 127, 139 49.37 Benzo(g,h,i)perylene 276, 138 50.97
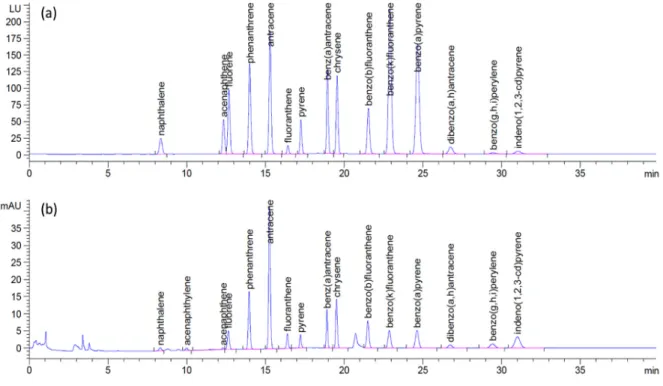
Figure 2. HPLC Chromatogram of 16 PAHs (a: FLD, b: UVD)
내부표준물질 5종을 포함하여 총 21종에 대한 피크 가 검출되었으며, 총 분석시간은 55분이 소요되었다.
Naphthalene과 내부표준물질인 naphthalene-D8은 완전히 분리되지 않고 피크 겹침이 발생하였다. 중수 소로 치환된 내부표준물질은 분석 물질과 머무름 시 간이 비슷하여 분석물질의 피크와 붙어 나오는 경향 이 있는데 특히 naphthalene은 naphthalene-D8과 분리 가 어려웠다. Seo et al.(2014)의 연구결과에서도 naphthalene과 내부표준물질인 naphthalene-D8이 분리 가 되지 않아 피크가 뭉쳐져 나온 것을 확인하였다.
따라서 naphthalene을 분석할 경우 naphthalene-D8이 포함된 내부표준물질은 사용하지 않는 것을 제안한 다. Yoon et al.(2008)의 연구에서는 naphthalene, acenaphthylene, acenaphthene, fluorene 등 휘발성이 높은 4종의 PAHs는 GC/MS로 분석하였을 때 피크 뭉 침 현상이 발생한다고 보고하였지만 본 연구에서는 분석 대상 물질간의 뭉침 현상은 발생되지 않았다.
Group 1은 GC/MS로 검출이 되지 않아 Group 2의 농도부터 15단계(농도 범위: 0.0001~1.0 ㎍/mL)로 제작 된 시료를 분석하여 검량선을 구하고 선형성을 평가하 였다. Group 2에서는 naphthalene, acenaphthylene,
acenaphthene 3종만 검출되었으며 0.95 이상의 상관계 수를 나타내었다. Group 3, 4의 농도에서는 분석 물질 16종이 모두 검출되었고, 0.99 이상의 직선성을 얻었 다. Seo et al.(2014)는 10~500 ng/㎕ 범위의 PAHs를 GC/MS로 분석하였을 때 naphthalene, acenaphthylene, acenaphthene의 선형성이 0.98 이상의 결과를 나타내었 다고 보고하였다.
정밀도 평가를 위해 15 단계(Group 2~4) 농도의 시료 를 각각 7번 반복 분석하였고 결과는 상대표준편차 (relative standard deviation, RSD)로 정량화하였다. 저 농도에서 상대표준편차가 고농도에 비해 상대적으로 높은 것으로 평가되었고, 고농도일수록 반복분석에 의 한 변동 없이 신뢰성 높은 값을 도출하였다.
Group 2에서 반복분석에 의한 상대표준편차는 11.37~15.39%, Group 3은 5.18~13.2% 범위의 정밀도 를 나타내었다. Group 4에서는 연구 대상물질 16종이 4% 이내 수준의 RSD로 정밀도가 높았다. Seo et al.(2014)는 50 ng/㎕의 naphthalene, acenaphthylene, acenaphthene을 반복 분석하였을 때 11~15% 이상의 정 밀도를 나타낸다고 보고하였는데, 본 연구의 가장 높 은 농도인 1.0 ㎍/mL의 시료에서 정밀도는 0.4~1.3%로
Compound Group 1* Group 2† Group 3‡ Group 4§
Naphthalene - - 51.99 33.17
Acenaphthylene - - - -
Acenaphthene - - 134.95 158.60
Fluorene - - 20.38 20.55
Phenanthrene - 10.42 9.15 9.23
Anthracene - 2.11 4.80 5.20
Fluoranthene - - 3.29 3.39
Pyrene - - 15.26 14.52
Benzo(a)anthracene - 10.47 14.33 13.56
Chrysene - 11.35 9.79 9.55
Benzo(b)fluoranthene - - 12.26 9.71
Benzo(k)fluoranthene - 28.00 48.19 45.82
Benzo(a)pyrene - - 34.12 33.78
Indeno(1,2,3)pyrene - - 10.86 11.40
Dibenz(a,h)anthracene - - 1.36 1.31
Benzo(g,h,i)perylene - - 1.27 1.28
* 0.00001~0.0001 ㎍/mL, † 0.0001~0.001 ㎍/mL, ‡ 0.001~0.1 ㎍/mL, § 0.1~1.0 ㎍/mL Table 5. Sensitivity comparison of FLD with UVD
확인되어 비교 대상 시료의 농도수준이 1/50배 수준 임에도 불구하고 정밀도가 우수하였다.
2. HPLC/FLD/UVD
Acetonitrile과 증류수의 비율을 조절하여 PAHs 16 종의 혼합 물질을 분리하는데 총 40분이 소요되었으 며 검출기에 따른 분석 결과는 Figure 2와 같다.
UVD와 FLD 검출기 모두 피크 뭉침이나 머무름 시 간이 겹치는 물질은 없었고, 같은 농도의 샘플에서 FLD 방법이 UVD 방법보다 높은 감도를 나타내는 것 을 확인하였다. FLD에서는 16종 물질 중 acenaphtylene 이 검출되지 않았는데, acenaphthylene은 형광검출법에 극히 낮은 감응도를 가지기 때문에 FLD로 분석하는 것은 불가능하여 UVD나 DAD(Diode Array Detector) 분석방법을 제시하고 있다(Williams et al., 1994). Chiu et al.(1997)는 λ 320 nm / 533 nm(ex/em) 파장에서 20 ppm 이상의 acenaphthylene은 FLD로 피크 확인이 가능 하다고 보고하고 있지만 본 연구에서는 ppb 이하 수준 의 극저농도 PAHs에 대한 분석 감도를 평가 하고자 하므로 acenaphthylene의 FLD 분석은 배제하였다.
검출기에 따른 감도 비교를 위해 물질별로 분석된 area를 이용하였고, FLD로 검출된 area를 UVD로 검
출된 area로 나눠준 값으로 평가하였다. 물질마다 감 도 차이는 있지만 본 연구에서는 검출기에 따라 크게 150배까지 차이가 발생하였는데, 특히 acenaphthene 은 검출기에 따른 감도차가 가장 컸으며 naphthalene, fluorene, benzo(k)fluoranthene, benzo(a)pyrene은 20~
50배까지 FLD가 감도가 높았다(Table 5). Chen et al.
(1996)은 PAHs 물질 분석에서 FLD가 UVD보다 20~320 배 정도 감도가 높다고 하였으며, Guilbault(1990)의 연 구에서도 FLD가 UVD보다 100~1000배 높은 감도를 가 진다고 보고하였다. 검출기에 따른 물질별 농도 범위에 검출기 감도 차이는 Table 5와 같다.
Group 1의 농도는 UVD에서 검출되지 않고, Group 2는 phenanthrene, antrathene, benzo(a)anthracene, chrysene, benzo(k)fluoranthene 5종이 검출되어 0.95 이상의 선형성을 나타내었다. 특히 감도가 낮은 acenaphthene은 Group 3인 0.004 ㎍/mL이하에서도 검출되지 않았지만 나머지 물질들은 Group 3, 4에서 모두 검출되어 0.999 이상의 높은 직선성을 보였다.
FLD는 Group 1의 낮은 농도까지 검출이 가능하지만 dibenz(a,h)antracene, benzo(g,h,i)perylene, indeno(1,2,3)- pyrene 3종에 대해 감도가 낮았으며, 특히 benzo(g,h,i)- perylene과 dibenz(a,h)antracene은 UVD와 감도차이가
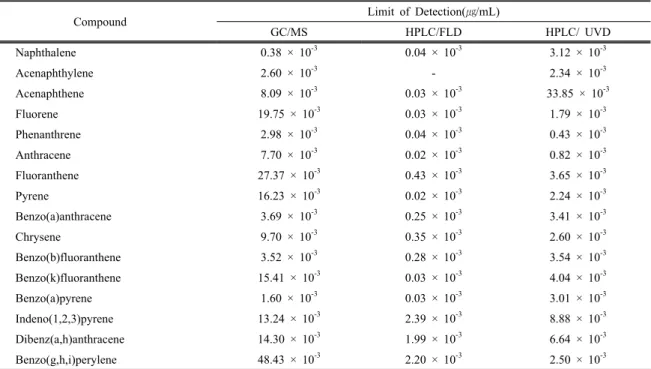
Compound Limit of Detection(㎍/mL)
GC/MS HPLC/FLD HPLC/ UVD
Naphthalene 0.38 × 10⁻³ 0.04 × 10⁻³ 3.12 × 10⁻³
Acenaphthylene 2.60 × 10⁻³ - 2.34 × 10⁻³
Acenaphthene 8.09 × 10⁻³ 0.03 × 10⁻³ 33.85 × 10⁻³
Fluorene 19.75 × 10⁻³ 0.03 × 10⁻³ 1.79 × 10⁻³
Phenanthrene 2.98 × 10⁻³ 0.04 × 10⁻³ 0.43 × 10⁻³
Anthracene 7.70 × 10⁻³ 0.02 × 10⁻³ 0.82 × 10⁻³
Fluoranthene 27.37 × 10⁻³ 0.43 × 10⁻³ 3.65 × 10⁻³
Pyrene 16.23 × 10⁻³ 0.02 × 10⁻³ 2.24 × 10⁻³
Benzo(a)anthracene 3.69 × 10⁻³ 0.25 × 10⁻³ 3.41 × 10⁻³
Chrysene 9.70 × 10⁻³ 0.35 × 10⁻³ 2.60 × 10⁻³
Benzo(b)fluoranthene 3.52 × 10⁻³ 0.28 × 10⁻³ 3.54 × 10⁻³
Benzo(k)fluoranthene 15.41 × 10⁻³ 0.03 × 10⁻³ 4.04 × 10⁻³
Benzo(a)pyrene 1.60 × 10⁻³ 0.03 × 10⁻³ 3.01 × 10⁻³
Indeno(1,2,3)pyrene 13.24 × 10⁻³ 2.39 × 10⁻³ 8.88 × 10⁻³
Dibenz(a,h)anthracene 14.30 × 10⁻³ 1.99 × 10⁻³ 6.64 × 10⁻³
Benzo(g,h,i)perylene 48.43 × 10⁻³ 2.20 × 10⁻³ 2.50 × 10⁻³
Table 6. Detection limits of 16 priority PAHs using GC/MS and HPLC/FLD/UVD
거의 없었다. Group 1의 상관계수는 0.94이상, Group 2는 0.99이상, Group 3과 4는 0.999이상의 높은 상관 계수를 나타내었다.
정밀도 평가에서 FLD를 사용했을 경우 Group 1은 2.37~17.42%, Group 2는 1.60~13.11%, Group 3는 0.85~8.70%, Group 4에서는 0.43~2.2 4%의 범위로 변 동하였다. UVD로 분석하였을 때, Group 2에서 phenanthrene, anthracene, benzo(a)anthracene, chrysene, benzo(k)- fluoranthene만 검출되었고 8.38~12.97%의 변동계수를 나타냈다. Group 3은 3.54~11.49%, Group 4는 0.85~6.60%로 고농도일수록 반복분석에 의한 변 동의 폭이 작았으며, 같은 농도범위에서 UVD보다 FLD의 변이계수가 작았다. Chiu et al.(1997)의 연구결 과에서는 HPLC/FLD로 분석했을 때 4.9~10.5%의 정밀 도를 나타내고 GC/ITD는 3.2~12.3%의 변동폭을 가진 다고 보고하였다. EPA에서는 정밀도의 변동폭이 30%
이내를 유지하도록 권고하고 있으며, 본 연구의 정밀 도는 20% 이내로 양호한 수준인 것으로 판단된다 (EPA, 1999).
3. GC/MS와 HPLC/FLD/UVD 비교
비교 대상 분석 장비 중 HPLC/FLD가 기기검출한
계가 가장 낮았으며, GC/MS와 HPLC/UVD는 물질마 다 감도가 높고 낮음에 차이가 있으나 naphthalene과 acenaphthene을 제외하고 HPLC/UVD가 분석 감도가 더 높았다.
Chiu et al.(1997)는 16종 PAHs에 대한 HPLC/UVD, HPLC/FLD와 GC/ITD의 비교 연구에서 UVD는 0.03~1.54 ng, FLD는 0.8~6.0 pg(acenaphthylene 제외), ITD는 5~25 pg의 검출한계 수준을 나타내어 FLD가 가장 높은 감도를 나타낸다고 보고하였다. PAHs의 형광스펙트럼에 대한 민감성 때문에 HPLC/FLD가 GC/MS보다 약 1000배 정도 낮은 검출한계를 나타낸 다(Hu et al., 2006). Crete et al.(2004)는 chrysene을 GC/MS와 HPLC/FLD로 분석했을 때 FLD가 GC/MS 보다 13배 감도가 높다고 언급하였는데, 본 연구에서 도 유사한 경향을 보였다.
일부 연구에서 GC/MS가 HPLC/FLD보다 높은 감 도를 가진다고 보고하였다(Gerbino&Castello, 1993;
Gratz et al., 2000). 또한 분석물질에 3~4개의 벤젠고 리를 가진 방향족 유기물질이 있을 경우 방해물질로 작용하여 분석이 어려운 단점이 있어(Crete et al., 2004) matrix가 복잡한 시료에서는 정확한 정성 및 정량분석을 위해서는 GC/MS를 이용하는 것이 효과
Compound GC/MS(%) HPLC/FLD(%) HPLC/UVD(%) Group 2† Group 3‡ Group 4§ Group 1* Group 2† Group 3‡ Group 4§ Group 2† Group 3‡ Group 4§ Naphthalene 11.37±6.63 5.18±4.64 1.74±2.10 2.37±0.89 1.60±0.84 1.96±2.31 0.82±0.83 - 8.39±3.87 2.86±5.87
Acenaphthylene 12.99±5.26 8.75±2.20 1.26±1.47 - - - - - 11.49±5.30 3.73±3.52
Acenaphthene 15.39±4.38 11.69±2.89 2.19±3.32 17.42±9.85 7.82±4.75 3.73±6.45 0.54±0.38 - 8.36±4.51 6.60±8.93 Fluorene - 10.86±4.62 1.93±1.98 14.42±2.89 9.55±4.12 2.77±5.13 1.46±3.37 - 5.28±6.23 2.00±2.20 Phenanthrene - 5.85±3.20 2.48±3.00 8.32±3.86 3.73±1.27 1.50±2.81 0.43±0.61 8.96±6.58 6.81±5.86 1.54±3.19 Anthracene - 7.99±4.07 1.71±3.10 14.65±14.20 7.45±7.38 2.16±4.76 0.76±0.43 8.38±7.35 3.54±7.43 1.60±4.26 Fluoranthene - 9.89±4.23 2.86±3.39 5.64 9.43±3.79 7.40±7.06 2.43±3.52 - 10.64±8.88 2.57±3.40 Pyrene - 8.26±5.84 3.46±4.45 5.44±2.33 4.54±1.67 2.35±1.25 0.73±0.91 - 7.66±6.80 4.67±7.16 Benzo(a)anthracene - 7.73±5.44 2.94±3.67 - 13.11±9.58 2.39±5.83 0.73±0.73 11.81±5.10 7.91±8.60 1.57±4.19 Chrysene - 9.67±4.40 2.65±4.40 - 11.70±9.98 2.02±7.47 1.16±2.11 11.46±9.44 3.73±6.10 0.85±2.05 Benzo(b)fluoranthene - 10.15±3.65 3.07±3.65 - 8.54±9.30 3.06±4.92 1.33±2.92 - 9.03±8.76 2.03±2.62 Benzo(k)fluoranthene - 13.20±3.69 1.97±2.61 11.75±3.43 4.65±3.67 0.85±0.97 1.17±1.68 12.97±8.04 6.68±6.14 1.60±4.21 Benzo(a)pyrene - 8.95±4.81 2.28±2.71 13.28±7.05 6.55±4.15 8.70±2.42 2.24±5.08 - 10.21±3.41 3.19±6.32 Indeno(1,2,3)pyrene - 10.84±4.49 2.90±4.39 - 10.86±0.05 4.43±6.39 1.64±1.84 - 9.00±8.86 1.69±3.00 Dibenz(a,h)anthracene - 11.71±7.66 2.95±4.72 - - 6.57±6.75 1.54±3.17 - 8.83±9.17 1.99±3.93
Benzo(g,h,i)perylene - 9.16±3.17 2.53±3.64 - - - - - 5.01±6.00 1.22±1.66
* 0.00001~0.0001 ㎍/mL, † 0.0001~0.001 ㎍/mL, ‡ 0.001~0.1 ㎍/mL, § 0.1~1.0 ㎍/mL Table 7. Precision of PAHs by concentration
적이라고 하였다(Lee et al., 2005).
상대적으로 불순물 함유가 적은 공기 중 샘플 분 석에는 분석 감도를 최대화하기 위해 GC/MS보다 HPLC/FLD를 이용하는 것이 적합하며, FLD로 검출 되지 않는 acenapthylene은 FLD와 UVD가 동시 분석 이 가능하므로 UVD의 분석 데이터를 이용하는 것이 저농도의 PAHs 분석에 최적의 방법이라고 판단된다.
국내외에서 현재까지 여러 가지 물질의 PAHs 동 시 분석에 다양한 방법들이 제시되었다. 하지만 산업 보건분야에서 극미량의 PAHs 분석방법에 대한 고찰 이 부족한 실정이며, 분석 장비들에 대한 비교 데이 터가 없었던 것이 사실이다. 본 연구는 분석 장비가 GC/MS와 HPLC에 한정되어 있고, matrix가 복잡한 실제 샘플 분석을 하지 못했다는 제한점이 있지만 PAHs의 분석에 필요한 기초 데이터를 제공했다는데 의의가 있다.
Ⅳ. 결 론
본 연구에서는 저농도 PAHs 분석에 대한 최적의
방법을 찾기 위해 GC/MS와 HPLC를 이용하여 분석 특성을 비교 검토 하였으며, 결과를 요약하면 다음과 같다.
저농도의 PAHs를 동시분석하기 위해 가장 적합한 장비는 HPLC/FLD로 GC/MS보다 20~2000배까지 감 도가 높았으며, UVD와 비슷한 감도를 가지는 물질 도 있지만 최대 1500배까지 감도가 뛰어났다. HPLC 시스템 가동시 FLD와 UVD의 동시 가동으로 FLD로 검출되지 않는 acenaphthylene은 별도의 추가 분석 없이 UVD로 확인이 가능하였다. 0.001 ㎍/mL 수준 의 저농도에서 비교 대상 장비 모두 20% 이하의 정 밀도를 보였으며, 개별물질의 검량선은 0.95 이상의 직선성을 나타내었다.
PAHs는 물질의 종류가 많을 뿐만 아니라 물질 특 성으로 인해 분석이 까다로운 물질 중 하나이며, 특 히 낮은 농도 수준에서는 정확한 분석을 위해 특성 에 맞는 장비의 선정 및 조작이 필요하다. 본 연구는 산업보건학적 개념에서 PAHs의 공기 중 노출 평가 를 위한 분석 방법에 초점을 두었으며, 산업보건분야 의 분석 기술 기초자료로 활용될 수 있을 것이다.
References
Agency for Toxic Substances and Disease Registry (ATSDR). U.S. Department of health and human services, Toxicological profile for polycyclic aromatic hydrocarbons, 1995
American society for Testing and Materials(ASTM). The Annual Book of ASTM standards, D 4657-92, PA., U.S.A, 1-9, 1998
Chen BH, Wang CY, Chiu CP. Evaluation of analysis of polycyclic aromatic hydrocarbons in meat products by liquid chromatography. J Agric Food Chem 1996;
44(8):2244-2251
Chiu CP, Lin YS, Chen BH. Comparison of GC-MS and HPLC for overcoming matrix interferences in the anlaysis of PAHs in smoked food. J. Chromatogr 1997;44
Crete J, Ingrid C, Jorgensen B, Rolf C. Quantitative determination of de-conjugated chrysene metabolites in fish bile by HPLC-fluorescence and GC-MS.
Chemosphere 2004;54(8):1085-097
Environmental Protection Agency(EPA). Code of Federal Regulation, title 40, part 60, subparts D, Da, Db, Dc.
Washington, DC, 1997:44
Environmental Protection Agency(EPA). Compendium Method TO-13A, EPA, Cincinnati, OH, USA, 1999 Environmental Protection Agency (EPA). Compendium of
methods for the determination of toxic organic compounds in ambient air. Second edition. EPA/625/
R-96/010b, January 1999
Gerbino TC, Castello G. Analysis of polycyclic aromatic hydrocatbons with an ion-trap mass detector and comparison with other gas chromatographic and high performance liquid chromatographic techniques. J.
Chromatogr 1993;642:351-357
Gratz L, Bagley S, Leddy D, Johnson J, Johnson JH et al.
Interlaboratory comparison of HPLC-fluorescence detection and GC/MS: analysis of PAH compounds present in diesel exhaust. J Hazardous Materials 2000;74:37-46
Guilbault G. Practical Fluorecence, 2nd ed., revised and expanded; Marcel Dekker, New york. 1990;23 Hu SJ, Oh NS, Kim SY, Lee HM. Determining of polycyclic
aromatic hydrocarbons in domestic vegetables and fruits. Anal Sci Technol 2006;19(5):415-421
International Agency Research on Cancer(IARC). IARC Monographs on the evaluation of carcinogenic risk of chemicals to human. 2006;7:1-42
International Agency Research on Cancer(IARC). IARC
Monographs in the evaluation of carcinogenic risks to humans. 2010
International Conference Air Quality in Europe; Challenges for the 2000s, Cocheo V, Saeger E, kotzias D, Venice, 1999
Jung JH, Cho SW, Lim HS. Distribution characteristics of environmental contaminant at soil in an industrial complex area. Clean technology 2011;17(4):379-388 Jeon JM, Lim JY, Kim SM, Shin HS. Characteristics of
polycyclic aromatic hydrocarbons from PM 2.5 in the public facilities. J Korean Soc Indoor Environ 2012;9(3):251-269
Mastral AM, Callean MS. A Review on Polycyclic Aromatic Hydrocarbon(PAH) Emissions from Energy Generation. Environ Sci Technol 2000;34(15):3051-3057 Lee TJ, Park KY, Kim JB, Eun JE, Jeong WG et al.
Determination of phenol using solid-phase extraction and high performance liquid chromatography/FLD/
MSD in water. Rep Inst Health & Envion 2005;16:
144-122
National Institute of Occupational Safety and Health (NIOSH). A NIOSH technical report: guidelines for air sampling and analytical method development and evaluation, NIOSH Pub. No. 95-117, Cincinnati, OH:
NIOSH;1995.
Raiyani CV, Shah SH, Desai NM, Venkaiah K, Patel JS et al. Characterization and problems of indoor pollution due to cooking stove smoke. Atmos Environ 27A 1993;1643~1655
Williams R, Meares J, Brooks L, Watts R, Lemieux P.
Priority pollutant PAH analysis of incinerator emission particles using HPLC and optimized fluorescence detection. Intern J Environ Ad Chem 1994;54: 299-314
Sloss L, Gardner CA. Sampling and analysis of trace emissions from coal-fired power stations, IEA Coal Research, IEARC 77: London, 1995
Seo SJ, Seo YK, Hwang YJ, Jung DH, Baek SO.
Application of adsorption sampling and thermal desorption with GC/MS analysis for the measurement of low-molecular weight PAHs in ambient air. J KOSAE 2014;30(4):362-77
Yoon JK, Park JS, Shin SK, Kim TS. Analytical method of polycyclic aromatic hydrocarbons (PAHs) in oil contaminated soils. Anal Sci Technol 2008;21(4):
296-303
Zander M, Gollin G. A review of the significance of polycyclic aromatic chemistry for pitch science. Fuel 1993;72(9):1281-1285