CONTENTS
Ⅰ. INTRODUCTION
Ⅱ. MATERIALS AND METHODS
Ⅲ. RESULTS
Ⅳ. DISCUSSION
Ⅴ. CONCLUSIONS REFERENCES KOREAN ABSTRACT
Ⅰ. INTRODUCTION
Body temperature has been used for the diagnosis of disease since the time of the ancient Greeks. In 400 B.C., Hippocrates used the palm of his hand to judge the skin temperature of sick patients. In 1872, Wunderlich in Germany, introduced fever measure- ments as a routine medical practice. Later, when reliable thermometers were developed, measurement of the core temperature of the body became the primary method for diagnosing fever. Since 1951, it has become customary to take daily body temperature measurements on all hospital patients.
52)If an individual is physiologically normal, i.e.
healthy, then the temperature of the skin surface should be bilaterally symmetrical for any given area of the body. Uemastu et al.
60)analyzed in detail the thermal symmetry of healthy subjects and found that the difference between left versus right over the
trunk was only 0.17±0.042℃ . Even on the fingers and toes, areas which may parallel ambient temperatures, the difference was still only 0.45±0.13℃.
Pathological conditions in joints and muscles are often associated with circulatory disturbances and/or inflammatory reactions located in the synovial membrane of the joint, the tendons, and the connective tissue in muscles and bone.
61,62)When these processes are close to the surface of the body, they influence the skin temperature, which can be measured by thermography.
15,45)Measurements of skin surface temperature may be useful in the assessment of disease activity and progress and in evaluation of treatment results, which otherwise is largely based on subjective observations.
40)Temperature imaging, termed thermography, was introduced as a diagnostic procedure in the 1960s.
Since that time over 4200 scientific studies
9)have employed thermography, involving, many improve- ments in thermographic equipment and technique.
52,65)However, the most widely studied application of thermography to the orofacial region has been in the characterization of craniomandibular disorders, parti- cularly temporomandibular joint(TMJ) dysfunction.
In 1971, Berry and Yemm
6)reported that the temperature overlying an area of tenderness in the masseter muscle was higher than that of the same area on the contralateral side. Some researchers assessed the temperature characteristics of the TMJ,
Reliability of Infrared Thermographic Imaging in the Orofacial Region
Dong-Joon Han, D.D.S.,M.S.D., Ki-Suk Kim, D.D.S.,M.S.D.,Ph.D.
Department of Oral Medicine, College of Dentistry, and Medical Laser Research Center
Dankook University
temporalis anterior and masseter muscle in a normal population. By using thermistors, they reported differences of only 0.3℃ and 0.4℃ for left versus right for the TMJ and masseter muscle, respe- citively.
41)Song et al.
54)evaluated the reproducibility of temperature measurement over the temporalis anterior and the masseter muscle using thermistors in normal individuals and found that the temperature difference for left versus right was less than 0.3℃.
Current technology, incorporating computerized electronic thermography (ET), provides a rapid, noninvasive, nonionizing method of obtaining objective information that reflects various physiologic responses to selected diseases.
Thermography is a generic title for various methods of quantifying the temperature distribution from body surfaces. ET is a technique utilized by a growing number of disciplines within medicine.
3,47,49,53)All object including the human body emit radiation in the infrared spectrum, and, according to Wien's law, the frequency at which the maximum energy is emitted is dependent on the temperature of the body.
35)Therefore, by measuring the infrared radiation emitted by the skin surface, the temperature can be determined.
Recently, ET has emerged as a promising diagnostic toot for patients with chronic orofacial pain.
20,21,27,28)In addition, ET has been used to evaluate a variety of orofacial conditions, including TMJ disorders,
10,30-33,50,55)maxillary sinus disease, and inferior alveolar nerve damage (traumatic neuralgia) subsequent to orofacial trauma or surgery.
24)Other conditions assessed by facial ET include: parotid gland diseases,
11,36)facial skin diseases,
48,56)facial burns,
12,46)malignant diseases of the maxillofacial region,
1,42)thyroid diseases
43,44)and headache.
40)Gratt et al.
29)assessed infrared thermography (IRT) as a diagnostic modality for internal derangement of the TMJ and found its sensitivity and specificity to be 86% and 78%, respectively. In 1990, Weinstein et al.
64)demonstrated that facial temperature symmetries were within 0.5℃.
To date, the literature describes the normal facial thermogram in only a limited manner.
23,32,64)These
reports suggest that the majority of asymptomatic adult subjects demonstrate a high level of thermal symmetry of selected points on the face.
64)An objective instrument to record skin surface temperature could be useful in evaluation of TMJ disorders, as has been proposed previously.
4-6,39)However, before the technique can be introduced for practical use in the clinic, its reliability must be studied.
This study is aimed at elucidating inter- and intra-examiner reliability of digital infrared thermographic imaging (DITI) on the skin surface over the TMJ, temporalis anterior and superficial masseter muscles in normal individuals and at investigating the effectiveness of marker used in this study to locate a palpation point on the skin.
Ⅱ. MATERIALS AND METHODS 1. Subjects
Ten dental students of Dankook University who granted informed consent for study were examined;
all of them were male, having a mean age of 24.5 years. Criteria for selection as normal subjects included a negative history for facial trauma, facial pain, headaches, sinus disease and temporo- mandibular joint symptoms, in addition to the absence of prominent facial scars or blemishes. Furthermore, to be considered normal, all subjects had to pass a dental examination, demonstrating normal dental occlusion, no TMJ sounds, and no facial or TMJ tenderness on palpation.
22,57)2. Reference points for temperature measurement
The palpation points(latent trigger points)
recommended by previous researchers
38)were used
for the present Study. Followings are the muscles
(Fig. 1) and the methods used to locate the palpation
points in the current study for infrared thermographic
imaging:
Fig. 1. Location of the areas examined. (J=TMJ;
Ta=temporalis anterior; Ma=masseter anterior; Mi=masseter inferior).
1. TMJ: The area 1 cm anterior to the tragus of ear 2. Anterior temporal muscle: The subject is asked to clench and relax to help identify the muscle. The fibers above the infratemporal fossa and immediately above the zygomatic process are palpated.
3. Anterior masseter muscle: The subject is asked to clench while the masseter is observed for the location. Fibers of the anterior border are palpated immediately below the zygomatic arch.
4. Inferior masseter muscle: The area 1 cm superior and anterior to the angle of the mandible is palpated.
3. Thermography equipment
Digital infrared thermal imaging was performed using DTI-16-DOREX21 (DOREX Inc., U.S.A.).
Components of digital infrared thermal imaging (DITI) systems included an infrared scanner, control unit, thermal image computer, software, cables, stands, supports and color monitor, which may be coupled to a video printer to produce hard copy images(Fig. 2). The scanner is a long-wave, cryogenically cooled system utilizing a mercury cadmium telluride detector with a spectral response of 8-12 nm and a sensitivity of 0.1℃. The scanner is controlled by a dedicated system controller which
Fig. 2. Digital infrared thermographic imaging system, including a scanner, with control unit, a monitor, and computer used for producing non-contact telethermograms. Subject taking a lateral thermogram with DITI system.
runs software specifically for thermal image analysis.
Room conditions included a draft-free environment (closed door and closed windows with curtains), comfortable temperature control(19-23℃), variable lighting, a swivel chair for patient positioning.
19)4. Facial imaging
Color thermograms of the face were taken with right and left lateral projections, at 0.1℃ sensitivity by 2 well trained dentists. Before the examination, each subject s face was cleared of hair (tied back), and TM joint and three palpation points of the face including anterior temporalis and anterior and inferior masseters were wiped with a alcohol sponge then dried with natural air(Fig. 1).
7,8,19,37)Each patient was asked to sit quietly, without touching the face, for 15 minutes to allow for facial thermal equilibration with ambient room temperature.
25)
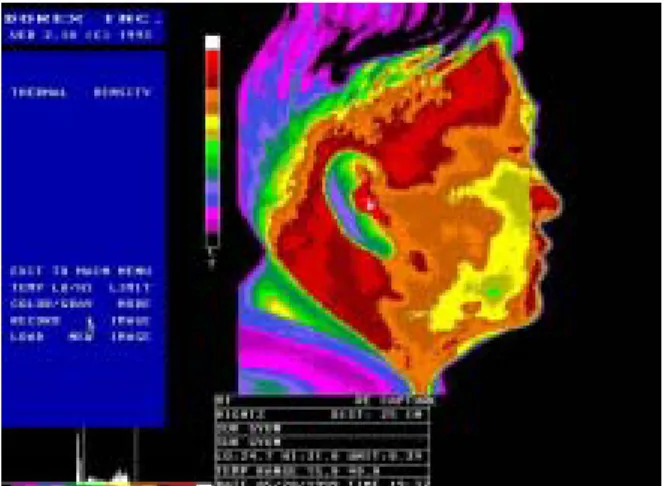
The scanner unit was positioned at a distance of 1 m perpendicular to the each side of the face, allowing maximum coverage of the area of interest (Fig. 2). Facial thermograms also were displayed on a color video monitor, enabling viewing and computer-aided temperature measurements of selected anatomic zones(Fig. 3, 4, 5). Following a
TaJ Ma
Mi
discussion of the location of palpation points in this study, ten subjects were examined by two examiners.
Inter and intra-examiner reliability were tested by the use of multiple examinations of subjects on the same and on different days. For determination of inter-examiner reliability, 10 subjects were examined in one day by two examiners, each blind to the other examiners measurements of temperatures, who were chosen based on their experience in taking and evaluating DITI.
For testing of intra-examiner reliability, all subjects were examined once again by one examiner blind to his first measurements of temperatures. Four days separated the first and second examinations by
Fig. 3. Subject attaching markers on the face.
Fig. 4. Normal lateral thermogram of a subject.
the examiner, in order to minimize the memory of the first measurements. All measurements were examined in the monitor. It was, however, difficult for us to locate the palpation points in the monitor. In this study, therefore, markers were attached on the skin of palpation points and then DITI was performed for an examiner to locate the palpation points in the monitor with ease and fast. The marker is a ring-shape adhesive tape of which a thickness is 1 mm and internal and external diameters are 1 cm and 1.5 cm respectively.
5. Statistical analysis
To determine the statistical significant for the difference of skin temperatures between palpation points, multiple comparison t-test was used. For each of the 4 facial regions, the mean and standard deviation(SD) were determined for the following values: the skin temperatures of palpation points in the right side of the face; the temperatures of palpation points in the left side of face; absolute difference in TP temperatures from side to side;
absolute difference in TP temperatures from first to second examination. To compare the measurements of the palpation points paired t-test was used and to test the intra- and inter-reliability correlation coefficients were determined.
Fig. 5. Lateral thermogram of a subject, attaching ring-shaped markers on the skin of palpation points.
Ⅲ. RESULTS
Table 1 presents the means and standard deviations of temperatures in lateral projection for each of the 80 facial areas. Multiple comparison t-test are also given to identify statistically significant mean temperature differences between palpation points. In the table 2, statistically significant differences were found among palpation points, except between masseter anterior and inferior. The skin temperature of palpation point in temporalis anterior was the highest in this study.
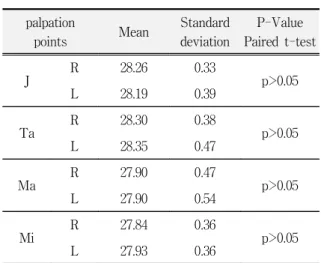
Lateral projected thermograms of this study were found to have a high level of thermal symmetry, with all 4 palpation points having mean temperatures within 0.1℃ of the opposite side (Table 3).
Table 4 and 5 shows the mean temperatures and correlation for intra-examiner reliability. The correlations of skin temperatures between first and second examinations for palpation points were partly positive(temporalis anterior and masseter anterior).
Two examiners also showed considerable differences of skin temperatures in some palpation points between 1st and 2nd examinations. This means that there was a lack of reliability between skin temperatures measured at different periods.
Table 6 and 7 shows the mean skin temperatures and the correlation coefficients for inter-examiner reliability. The correlation of skin temperatures in
Table 1. Mean and standard deviations of skin temperatures measured on the facial palpation points.(℃)
palpation points (n=80)
temperature
mean standard deviation
J 28.22 0.36
Ta 28.32 0.43
Ma 27.90 0.50
Mi 27.89 0.38
(J=joint; Ta=temporalis anterior; Ma=masseter anterior;
Mi=masseter inferior)
inter-examiner reliability for temporalis anterior, masseter anterior and masseter inferior were positive in the control and marker groups. The correlation of skin temperatures between the first and second examiner for the marker group were more significantly positive than the control group. In addition, there were some differences of skin temperatures between two examiner in control group (table7). This means that there were higher inter-examiner reliability using marker in palpation points, although there were also significant inter-examiner reliability in control group.
Table 2. Results of multiple comparison t-test for skin temperatures of all groups.
palpation points
J 28.22
Ta 28.32
Ma 27.90
Mi 27.89 J
Ta <0.05
Ma <0.0001 <0.0001 Mi <0.0001 <0.0001 -
(J=joint; Ta=temporalis anterior; Ma=masseter anterior;
Mi=masseter inferior)
Table 3. Comparison of mean skin temperatures of palpation points in the right side vs left side and results of praied t-test.
palpation
points Mean Standard
deviation
P-Value Paired t-test
J R 28.26 0.33
p>0.05
L 28.19 0.39
Ta R 28.30 0.38
p>0.05
L 28.35 0.47
Ma R 27.90 0.47
p>0.05
L 27.90 0.54
Mi R 27.84 0.36
p>0.05
L 27.93 0.36
(J=joint; Ta=temporalis anterior; Ma=masseter anterior;
Mi=masseter inferior; R=right; L=left)
Ⅳ. DISCUSSIONS
A myofascial trigger point is specified as an area of hyperirritability which, when compressed, is exquisitely tender and may give rise to referred pain, referred autonomic phenomena, and distortion of proprioception.
59)Most physicians distinguish between active and latent trigger points; while both are tender to palpation, latent trigger points do not weaken the muscle or prevent lengthening nor do they produce referred autonomic phenomena.
Fisher
17)argued that the role which trigger points played in acute and chronic pain had been underestimated because of a lack of objective methods for their documentation. He believed that medical thermography was the first diagnostic test
which documents soft tissue pathology. In an initial thermographic investigation, Fisher and Chang
18)observed the presence of 'hot spots' which they maintained were compatible with the location of active and latent trigger points. These hot spots were usually discoid in shape with a diameter of 5-10 cm.
The hot spots were between 0.5 ℃ and 1.0 ℃ warmer than the opposite side of the body or the circumambient region.
Weinstein and Weinstein
63)also claimed to have developed a thermography protocol which documents the presence of both active and latent trigger points.
They argued that temperature, rather than the presence or absence of pain, distinguishes whether a hot spot represents an active or latent trigger point.
Hot spots associated with active trigger points are at
Table 4. Means and standard deviations of skin temperature measured twice by Dr.1 on the facial palpation pointsof the control and marked groups and results of paired t-test and correlation test.(n=10) palpation
points 1st exam 2nd exam P-Value of
paired t-test
Correlation coefficients
P-Value of Correlation
J
R C 26.19 0.60* 28.99 0.43 - 0.644 0.0429
M 28.19 0.38 28.18 0.37 - 0.139 -
L C 29.12 0.26 28.99 0.49 <0.0001 0.475 -
M 28.01 0.40 28.04 0.36 0.0063 0.701 0.0213
Ta
R C 29.16 0.57 29.01 0.48 0.0211 0.764 0.0078
M 28.18 0.34 28.15 0.33 - 0.695 0.0234
L C 29.21 0.57 28.93 0.76 - 0.841 0.0012
M 28.25 0.44 28.24 0.43 - 0.295 -
Ma
R C 28.62 0.63 28.45 0.55 - 0.709 0.0193
M 27.85 0.47 27.86 0.48 - 0.613 -
L C 28.62 0.60 28.50 0.62 0.0183 0.617 -
M 27.77 0.58 27.75 0.55 - 0.669 0.0323
Mi
R C 28.82 0.62 28.76 0.80 - 0.577 -
M 27.74 0.46 27.74 0.42 - 0.609 -
L C 28.91 0.51 28.58 0.74 0.0239 0.841 0.0012
M 27.87 0.35 27.88 0.31 - 0.420 -
(J=joint; Ta=temporalis anterior; Ma=masseter anterior; Mi=masseter inferior; R=right; L=left; C=subject without markers; M=
subject with markers; *=mean standard deviation)
least 1.5℃ warmer than the circumambient area, while latent trigger point-hot spots are 1.0℃ warmer than the surrounding territory. Although Weinstein and Weinstein showed that trigger point-hot spots are common, they reported that some hot spots were irrelevant artifacts arising from the thermal emission of arteriovenous shunts.
Swerdlow and Dieter
57)evaluated the thermo- graphic protocols to study the documentation of trigger points. They studied whether the practicing physician, using standard thermographic equipment, has a sensitive and specific diagnostic modality for the imaging of active trigger points. They failed, however, to support the argument that circumscribed thermographic hot spots are the location of active trigger points in the upper back, because they located
the trigger points in the patient s body and the hot spots in the monitor respectively. They proposed that a reliable technique for locating trigger points should be required to use electronic thermography as a diagnostic tool for temporomandibular disorders. In this study ring like markers were used in the latent trigger points(palpation points) to detect them obviously in the monitor.
Consequently it can be seen that there was significant correlation between two examiner. In the study of intra examiner reliability, however, there were no significant correlations between the measurements of 2 examinations which an identical examiner investigated and there were significant differences of skin temperatures in all latent trigger points between 2 examinations. This means that skin
Table 5. Means and standard deviations of skin temperature measured twice by Dr.2 on the facial palpation pointsof the control and marked groups and results of paired t-test and correlation test.(n=10) palpation
points 1st exam 2nd exam P-Value of
paired t-test
Correlation coefficients
P-Value of Correlation
J
R C 28.99 0.43* 29.05 0.44 - 0.707 0.0198
M 28.18 0.37 28.32 0.31 - 0.500 -
L C 28.99 0.49 29.21 0.46 - 0.502 -
M 28.04 0.36 28.35 0.34 0.0058 0.699 0.0221
Ta
R C 29.01 0.48 29.29 0.42 0.0146 0.798 0.0039
M 28.15 0.33 28.46 0.33 0.0029 0.734 0.0131
L C 28.93 0.76 29.23 0.54 - 0.651 0.0396
M 28.24 0.43 28.49 0.39 - 0.578 -
Ma
R C 28.45 0.55 28.84 0.59 0.0066 0.814 0.0026
M 27.86 0.48 27.98 0.47 - 0.640 0.0450
L C 28.50 0.62 28.97 0.50 0.0081 0.706 0.0199
M 27.75 0.55 28.03 0.51 - 0.715 0.0175
Mi
R C 28.76 0.79 28.96 0.67 - 0.727 0.0158
M 27.74 0.43 27.96 0.36 0.0378 0.746 0.0107
L C 28.58 0.74 29.03 0.59 - 0.400 -
M 27.88 0.31 27.98 0.39 - 0.439 -
(J=joint; Ta=temporalis anterior; Ma=masseter anterior; Mi=masseter inferior; R=right; L=left; C=subject without markers; M=
subject with markers; *=mean standard deviation)
temperatures are not constant with time and may be due to the increased thermal changes of body with time. It can be concluded, therefore, that ET is useful to compare the temperatures of adjacent trigger points in an identical examination and to detect a hot spot through symmetric color comparison in the monitor although there are some problems to compare them with time.
In a previous study, evaluating 102 asymptomatic adults, they measured normal temperature values of the face, and found a high degree of thermal symmetry from side-to-side. Using frontal and lateral ET projections, the mean temperature of 25 selected right-versus-left-side anatomic zones were within 0.1℃(±0.1℃) of each other. Of greatest
importance, the right-versus-left-side thermal difference (ΔT temperature values) for individual subjects was less than 0.4℃(± 0.1℃).
58)The results of this study demonstrated a high level of thermal symmetry over the face in normal subjects, with an overall average temperature difference from side-to-side (zone ΔT) of 0.1℃. This finding agrees with a number of reports in the literature demonstrating, that thermal symmetry is present over the body (especially in the regions of the forehead, the trunk, the limbs, and the face), with an overall average temperature difference from side-to-side of 0.3 ℃.
1,14,26,42-44)These normal findings give promise:
57)to the use of ET as a diagnostic test,
22)and for the use of zone delta T values of more
Table 6. Means and standard deviations of skin temperature measured at the first examination by two examinerson the facial palpation points of the control and marked groups and results of paired t-test and correlation test.(n=10)
palpation
points Dr1 Dr2 P-Value of
paired t-test
Correlation coefficients
P-Value of Correlation
J
R C 29.16 0.60* 28.99 0.43 - 0.284 -
M 28.19 0.38 28.18 0.37 - 0.965 <0.0001
L C 29.12 0.26 28.99 0.49 - 0.685 0.0267
M 28.01 0.40 28.04 0.36 - 0.972 <0.0001
Ta
R C 29.16 0.57 29.01 0.48 - 0.898 0.0001
M 28.18 0.34 28.15 0.33 - 0.970 <0.0001
L C 29.21 0.57 28.93 0.76 - 0.835 0.0014
M 28.25 0.44 28.24 0.43 - 0.974 <0.0001
Ma
R C 28.62 0.63 28.45 0.55 - 0.754 0.00094
M 27.85 0.47 27.86 0.48 - 0.988 <0.0001
L C 28.62 0.60 28.50 0.62 - 0.812 0.0027
M 27.77 0.58 27.75 0.55 - 0.988 <0.0001
Mi
R C 28.82 0.62 28.76 0.80 - 0.890 0.0002
M 27.74 0.46 27.74 0.42 - 0.985 <0.0001
L C 28.91 0.51 28.58 0.74 0.0189 0.893 0.0001
M 27.87 0.35 27.88 0.31 - 0.982 <0.0001
(J=joint; Ta=temporalis anterior; Ma=masseter anterior; Mi=masseter inferior; R=right; L=left; C=subject without markers; M=
subject with markers; *=mean standard deviation)
or less than 0.4℃ being used as an normal vs abnormal criteria.
26)Thermography is based on the normal thermore- gulatory processes in the body. These mechanisms for core temperature are controlled by biofeedback mechanisms controlled by the hypothalamus.
34)These temperature control mechanisms, which operate principally via sympathetic neural control of vasoconstriction, affect both sides of the body bilaterally and simultaneously. It is, therefore, reported that ET is useful in characterizing several pain-provoking conditions in the orofacial region. ET appears to be especially promising in demonstrating the underlying cause of chronic toothache, a complex clinical problem.
The normal thermoregulatory processes in the body are dependent on the external factors such as outside temperature. It is, therefore, believed that the intraexaminer correlation between different periods should have been less significant than the interexaminer correlation during identical period in this study. This inference is different from previous suggestion.
34)From the results of this study it is suggested that skin temperatures should be dependent on the internal factors such as emotional stress, physical fatigue and kinds of foods taken before examination as well as external factors remarked previously.
The thermographic procedure was tolerated well by all patients. It is non-invasive, painless and is
Table 7. Means and standard deviations of skin temperature measured at the second examination by two examinerson the facial palpation points of the control and marked groups and results of paired t-test and correlation test.(n=10)
palpation
points Dr1 Dr2 P-Value of
paired t-test
Correlation coefficients
P-Value of Correlation
J
R C 29.05 0.44* 29.36 0.25 0.0153 0.669 0.0323
M 28.32 0.31 28.35 0.29 - 0.513 -
L C 29.21 0.46 29.65 0.23 0.0163 0.187 -
M 28.35 0.34 28.34 0.36 - 0.971 <0.0001
Ta
R C 29.29 0.42 29.49 0.52 - 0.712 0.0183
M 28.46 0.33 28.41 0.47 - 0.894 0.0001
L C 29.23 0.54 29.36 0.45 0.0390 0.956 <0.0001
M 28.49 0.39 28.43 0.61 - 0.901 <0.0001
Ma
R C 28.84 0.59 28.93 0.50 - 0.803 0.0034
M 27.98 0.47 27.92 0.51 - 0.988 <0.0001
L C 28.97 0.50 29.08 0.55 - 0.893 0.001
M 28.03 0.51 28.05 0.53 - 0.990 <0.0001
Mi
R C 28.96 0.67 29.08 0.63 - 0.950 <0.0001
M 27.96 0.36 27.93 0.37 - 0.790 0.0046
L C 29.03 0.59 29.15 0.40 - 0.697 0.0225
M 27.98 0.39 28.00 0.42 - 0.949 <0.0001
(J=joint; Ta=temporalis anterior; Ma=masseter anterior; Mi=masseter inferior; R=right; L=left; C=subject without markers; M=
subject with markers; *=mean standard deviation)
completed in less than 30 minutes. It will be, there- fore, helpful to differentiate abnormal conditions in orofacial region, since this is the first diagnostic test that actually verified their complaint of orofacial pain.
In conclusion, electronic thermography has promise as an aid in the development of differential diagnoses of patients with orofacial pain, especially constant chronic facial pain and in the evaluation of prognosis of treatment. The dental literature does not yet indicate the full range of facial thermographic findings in health and disease. Thermography is not useful in assessing some common dental problems, such as periapical granuloma.
51)Promising reports, however, support its use in the diagnosis of neuralgias and atypical odontalgia,
13,28)TMJ,
2,37,41,58)and in evaluating local dental anesthesia.
16)Unfortunately, few if any of these studies were properly designed or conducted, limiting current attempts to define the value of thermography in dentistry, can only be considered an investigational procedure. More research will clarify the precise contribution of thermography to dental problems and orofacial pain.
Ⅴ. CONCLUSIONS
The use of infrared thermography in dentistry has been minimal, principally due to technological inadequacies of previous thermal imaging systems.
However, with the everdeveloping advancement in technology, current systems are capable of producing real-time, highly sensitive digitized thermal images.
This development has led to an increase use of infrared imaging within dental research. This study evaluated the reliability of digital infrared thermographic imaging for the assessment of latent myofascial trigger points in the face. In conclusion, thermographic assessment of the latent trigger points in the orofacial region has some promise as a diagnostic aid in the evaluation of orofacial pain, especially attaching the marks on the skin of reference points. Additional, more extensive studies are needed before thermographic diagnosis of orofacial pain is accepted clinically.
REFERENCES
1. Afanaseve, V.V., Romacheva, I.F., Iudin, L.A.: Diagnosis of malignant tumors of the maxillofacial area using thermogrpahy. Stomatologiia (mosk) ,62: 52-4,1983.
2. Akerman, S., Kopp, S., Nilner, M., et al:. Relationship between clinical, radiologic and thermometric findings of the temporomandibular joint in rheumatoid arthritis.
Report Series No. 41. Odontologiska Kliniken, 1-30, 1987.
3. Baillie, A.J., Biagioni, P.A., Forsyth, A., Garioch, J.J., McPherson, D.: Thermographic assessment of patch-test responses. Br J dermatol., 122: 351-60,1990.
4. Berry, D.C., Yemm, R.: Changes in facial skin temperature associated with unilateral chewing. J Oral Rehabil., 1: 127-9,1974.
5. Berry, D.C., Yemm, R.: A further study of facial skin temperature in patients with mandibular dysfunction. J Oral Rehabil., 1: 255-64,1974.
6. Berry, D.C., Yemm, R.: Variations in skin temperature of the face in normal subjects and in patients with mandibular dysfunction. Br J Oral Surg., 8:242-7,1971.
7. Biagioni, P.A., Longmore, R.B., McGimpsey, J.G., Lamey, P.J.: Infrared thermography. Its role in dental research with particular reference to craniomandibular disorders. Dentomaxillofac Radiol., 25:119-24,1996.
8. Biagioni, P.A., McGimpsey, J.G., Lamey, P.J.: Electronic infrared thermography as a dental research technique.
British Dental Journal, 180:226-30,1996.
9. BRS Colleague. An electronic information service. CD Plus Industries, 333 7th Ave, New York 10001.
10. Canavan, D., Gratt, B.M.: Electronic thermography for the assessment of mild and moderate TMJ dysfunction.
Oral Surg Oral Med Oral Pathol Oral Radiol Endod., 79(6): 778-86,1995.
11. Champy, M., Bourjat, P., Schnebelen, J.M.: Thermo- graphic exploration of the parotid region. J Maxillofac Surg., 4: 163-71,1976.
12. Dittmar, A., Marichy, J., Delhomme, G., Grippari, J.L.:
Measurement by heat clearance of skin blood flow of healthy, burn and grafted skin. Prog Clin Biol Res., 107:
413-20,1982.
13. Drummond, P.D.: Vascular changes in atypical facial pain. Headache 28: 121-3,1988.
14. Drummond, P.D., Lance, J.W.: Facial temperature in migraine, tension-vascular and tension headache.
Cephalalgia, 4: 149-48,1984.
15. Engel, J.M., Cosh, J.A., Cosh, J.A., Ring, E.F.J., Page
Thomas, D.P., Van, W.P., Schoenfeld, D.:
Thermography in locomotor diseases. Recommended procedure locomotor diseases group. The Anglo-Dutch Thermographic Society, 299-306,1978.
16. Ernst, M., Lee, M.H.M.: Sympathetic vasomotor changes induced by manual and electrical acupuncture of the Hoku point visualized by thermography. Pain, 21:
25-33,1985.
17. Fisher, A .A. and Chang, C. H.: Temperature and pressure threshold measurements in trigger points, Thermology, 1 (1986b) 212-215.
18. Fisher, A. A. and Chang, C. H.: Thermographic documentation of trigger points: corroboration by pressure threshold measurement. In: M. Abernathy and S. Uematsu (Eds.), Medical Thermography, Am. Acad.
Thermog., Georgetown University Medical Center, Washington, DC, 115-119,1986a.
19. Future applications of electronic thermography. JADA, Vol. 122, May 1991.
20. Graff- Radford, S.B., Ketalaer, M-C., Gratt, B.M., Solberg, W.K.: Thermographic assessment of neuropathic facial pain: A pilot study. J Orofac Pain, 9:
138-46,1995.
21. Graff- Radford, S.B., Solberg, W.K.: Atypical odon- talgia. J Calif Dent Assoc. 14: 27-32,1986.
22. Gratt, B.M., Graff-Radford, Shetty, V., Solberg, W.K., Sickles, E.A.: A 6-year clinical assessment of electronic facial thermography. Dentomaxillofac Radiol., 25:247- 55,1996.
23. Gratt, B.M., Pullinger, A., Sickles, E.A.: Electronic thermography of normal facial structures: A pilot study. Oral Surg Oral Med Oral Pathol., 68: 346- 351,1989.
24. Gratt, B.M., Shetty, V., Saiar, M., Sickles, E.A.:
Electronic thermography for the assessment of inferior alveolar nerve deficit. Ora surg Oral Med Oral Pathol Oral Radiol Endod., 80: 153-60,1995.
25. Gratt, B.M., Sickles, E.A.: Thermographic Characteri- zation of the Asymptomatic Temporomandibular Joint.
J Orofacial Pain, 7:7-14,1993.
26. Gratt, B.M., Sickles, E.A.: Electronic facial thermo- graphy: an analysis of asymptomatic adult subjects. J Orofac Pain, 9: 255-65,1995.
27. Gratt, B.M., Sickles, E.A.: Electronic thermography of the face: Future applications in dentistry. J Am Dent Assoc., 122: 28-36,1991.
28. Gratt, B.M., Sickles, E.A., GRaff-Radford, S.B., Solberg, W.K.: Electronic thermography in the diagnosis of atypical odontalgia: A pilot study. Oral Surg Oral Med
Oral Pathol Oral Radiol Endod., 68:472-81,1989.
29. Gratt, B.M., Sickles, E.A., Ross, J.B.: Electronic thermo- graphy in the assessment of internal derangement of the temporomandibular joint. A pilot study. Oral Surg Oral Med Oral Pathol., 71: 364-70,1991.
30. Gratt, B.M., Sickles, E.A., Ross, J.B.: Thermographic characterization of an internal derangement of the temporomandibular joint. J Orofac Pain, 8: 197- 206,1994.
31. Gratt, B.M., Sickles, E.A., Ross, J.B., Wexler, C.E., Gornbein, J.A.: Thermographic assessment of craniomandibular disorders: diagnostic interpretation versus temperature measurement analysis. J Orofac Pain, 8: 278-88,1994.
32. Gratt, B.M., Sickles, E.A.: Thermographic characteri- zation of the asymptomatic temporomandibular joint. J Orofacial Pain, 7: 7-17,1993.
33. Gratt, B.M., Sickles, E.A., Wexler, C.A.: Thermographic characterization of osteoarthrosis of the temporoman- dibular join. J Orofac Pain, 7: 345-53,1993.
34. GroBKlaus, R., Bergmann, K. E.: Physiology and regulation of body temperature. In Engel J-M, Flesch U, Stuttgen G (eds). Thermological methods. 1st ed. pp 11-20. Weinheim: VCH, 1985.
35. Houdas, Y., Ring, E.F.J. (eds) In: Human body temperature: its measurement and regulation, 1st edn.
New York: Plenum, 33-55,1982.
36. Hubacek, J., Smolan, S.: Thermography in parotid tumors. Ceska Otolaryngol , 32: 345-47,1983.
37. Johansson, A., Kopp, S., Haraldson, T.: Reproducibility and variation of skin surface temperature over the temporomandibular joint and masseter muscle in normal individulals. Acta Odontol Scand., 43: 309-13,1985.
38. J.R. Fricton, E.L. Schiffman.: Reliability of a cranioman- dibular index. J Dent Res., 65;1359-64,1986.
39. Kopp, A., Haraldson, T.: Skin surface temerature over the temporomandibular joint and masseter muscle in patients with mandibular dysfunction. Gothenburg, Dept. of Stomatognathic Physiology, Gothenburg University, 1981; Report Series no. 37.
40. Kopp, S.: Constancy of clinical signs in patients with mandibular dysfunction. Community Dent Oral Epidemiol., 5:94-8,1977.
41. Kopp, S., Haraldson, T.: Normal variation in skin surface temperature over the temporomandibular joint and masseter muscle. Scand J Dent Res., 91:308- 11,1983.
42. Kosut, V., Gegava, J., Stavratjev, M.: Experience with the use of infrared thermography in tumors of the jaws.
Ceska Stomatol., 82:3-8 (Eng. Abstr.) (Cz.),1982.
43. Kuzmichev, A.S.: Thermography in the diagnosis of thyroid neoplasms. Vopr Onkol., 27: 33-7 (Eng. Abstr.) (Rs.),1981.
44. Lejska, V., Stavratjev, M., Stavratjevova, A., Drasilova, L.: Infrared thermovision in the diagnosis of carcinoma of the thyroid gland in childhood. Ceska Otolaryngol., 32: 204-6 (Eng. Abstr.) (Cz.),1983.
45. Lindstrom, J., Branemark, P-I., Hansson, B., Eriksson, E., Line, V., Vainio, V.: Jonsson I. Intraarticular temperature under normal and pathological conditions.
Stockholm, Sweden: Fifth European Congress on Rheumatic Diseases, 1963.
46. Mason, Br., Graff, A.J., Pegg, S.P.: Colour thermography in the diagnosis of the depth of burn injury. Burns, 7:
197-202,1980.
47. McHugh, N.J., Elvins, D.M., Ring, E.F.J.: Elevated anticardiolipin antibodies in a patient with vibration white finger, valvular heart disease and psoriatic arthritis. Clin Rheumatol., 12: 70-3,1993.
48. Miki, Y., Matsuda, K., Matsui K.: Infra-red thermo- graphy in dermatology. Acta Thermographica, 7:
45-50,1982.
49. Mohr, F.W., Matloff, J., Grudfest, W. et al.: Thermal coronary angiography: a method of assessing graft patency and coronary anatomy in coronary by-pass surgery. Ann Thorac Surg., 47:441-9,1989.
50. Pogrel, M.A., Erbez, G., Taylor, R.C., Dodson, T.B.:
Liquid crystal thermography as a diagnostic aid and objective monitor for TMJ dysfunction and myogenic facial pain. J Craniomandib Disord., 3: 65-70,1989.
51. Pogrel, M.A., Yen, C.K., Taylor, R.C.: Infrared thermo- graphy in oral and maxillofacial surgery. Oral Surg Oral Med Oral Pathol., 67: 126-31,1989.
52. Ring, E.F.J., Engel, J-M.: Infrared thermography and thermal clearance of the skin. In: Engel, J.M., Ring, E.F.J., eds. Applied thermogological methods. Deerfield Beach, F.L.: VCH Publishers, 133-41,1985.
53. Seifalian, A.M., Stansby, G., Jackson, A., Howell, K., Hamilton, G.: Comparison of laser doppler perfusion imaging, laser doppler flowmetry and thermographic imaging for assessment of blood flow in human skin.
Eur J Vasc Surg., 8:65-9,1994.
54. Song, T.Y., Kim, K.S.: Reliability of skin temperature over the trigger points of temporalis and masseter muscles in normal individuals. J Korean Academy of Oral Medicine, 22:137-43,1997.
55. Steed, P.A.: The utilization of liquid crystal thermography in the evaluation of themporomandibular dysfunction. J Craniomandib Pract., 9: 120-28,1991.
56. Stuttgen, G.: Thermographic evaluation of the benign diseases and reactive changes of the skin. Prog Clin Biol Res., 107: 397-411,1982.
57. Swerdlow, B., Dieter, J.N.: An evaluation of the sensitivity and specificity of medical thermography for the documentation of myofascial trigger points. Pain, 48:205-13,1992.
58. Tegelberg, A., Kopp, S.: Skin surface temperature over the temporomandibular and metacarpophalangeal joints in individuals with rheumatoid arthritis. Report Series No. 31. Odontologiska Kliniken,1-31,1986.
59. Travell, J. G., Simons, D. G.: Myofascial pain and dysfunction. The trigger point manual, Williams and Wilkins, Baltimore, MD, pp. 1-4,1983.
60. Uematsu, S., Baden, E., Brelsford, K. et al.: Reproduci- bility of skin temperature symmetry during a one-year period. In: Abernathy M, Uematsu S, eds. Medical Thermology. Washington DC: American Academy of Thermology, 99-114,1986.
61. Vestergaard- Christensen, L.: Some effects of experimental hyperactivity of the mandibular locomotor system in man. J Oral Rehabil., 2:169-78,1974.
62. Vestergaard- Christensen, L., Moseman, G.: Om den funkionsbetingede myoeses aetiologi, patofysiologi och patoanatomi. Tnadlaegebladet, 71:230-7,1967.
63. Weinstein, S. A., Weinstein, G.: Computerized electronic thermography in the evaluation of muscle pain, Acad.
Neuro-Muscular Thermog. Clin. Proc., 38-48,1989.
64. Weinstein, S.A., Gelb, M., Weinstein, G., Weinstein, E.L.: Thermophysiologic anthropometry of the face in homo sapiens. J Craniomand Pract., 8: 252-257,1990.
65. Wexler, C.E.: Atlas of thermographic lumbar patterns.
Tarzana, CA: Thermographic Services Inc., 1-38,1983.
Corresponding Author : Ki-Suk Kim, Professor,
Department of Oral Medicine, School of Dentistry, Dankook University, San 7-1, Shinbudong, Cheonanm Choongnam 330-716 Korea