선천성 대사질환검사 신빙도조사 결과보고 (2003)
김종원(집필대표)․권계철․김정호․민원기․백병윤․송정한․이수연․이은희․최태윤
대한임상검사정도관리협회 선천성대사질환분과위원회
Annual Report on External Quality Assessment in Inborn Error of Metabolism in Korea (2003)
Jong-Won Kim, Kye Chol Kwon, C.H. Kim, W.K. Min, Byung Yoon Baik, Junghan Song, Soo Youn Lee, Eun Hee Lee, and Tae-Yoon Choi
Inborn Error of Metabolism Subcommittee,
The Korean Association of Quality Assurance for Clinical Laboratory, Seoul, Korea
The trial of external quality assessment for inborn error of metabolism was performed in 2003.
A total 10 specimens for neonatal screening tests were distributed to 43 laboratories with a response rate of 83%. All the control materials were sent as a filter paper form. Each laboratory replied the test result as the screening items they were doing as a rountine test at the reception of the specimen among PKU screening, neonatal TSH, neonatal T4(total/free), galactosemia screen, homocytinuria screen and histidinemia screen. The mean, SD, and CV were analyzed.
Key Words:External quality assurance, Inborn error of metabolism, Neonatal screening
교신저자:김종원
우) 135-230 서울시 강남구 일원동 50 삼성서울병원 진단검사의학과
전화:02)3410-2705, FAX:02)3410-2719
서 론
선천성 대사질환분과위원회에서는 신생아 대사질환선별 검사 신빙도 조사 사업을 1997년도부터 시작하였으며 2003 년도에는 총2회의 신빙도 조사를 시행하였다. 선천성 대사 질환검사를 수행하는 정도관리협회 가입기관에 10종의 정 도관리 검체를 발송하였다. 이들 검사기관에서 검사 수치 및 검사 수치에 대한 정상 및 비정상여부에 대한 판정을 같 이 보고함으로써 이들 검사기관의 정상참고치 등을 같이 알 아볼 수 있도록 하였다.
재료 및 방법
43기관을 대상으로 10개(03-1, 03-2, 03-3, 03-4, 03-5, 03-6, 03-7, 03-8, 03-9 03-10)의 선천성 대사 질환 검사를 위한 정도관리검체를 발송하였다. 정도관리검 체는 Bayer (USA)와 Bio-Rad (USA)사등의 정도관리물
질을 사용하였다. 검사종목은 페닐케톤뇨증(phenylketo- nuria,PKU), 갑상선자극호르몬(thyroid stimulating hor- mone, TSH), 갑상선호르몬(thyroxine, T4 total/free), 갈락토스혈증(galactosemia), 17 hydroxy progesterone (17-OHP), 단풍당뇨증(maple syrup urine disease), 호모시스틴혈증(homocystinuria)과 히스티딘혈증(histidine- mia) 선별검사에 대하여 각 검사기관이 수행하고 있는 종 목에 대해 검사를 수행하여 결과수치와 함께 정상 및 비정 상, 재검 여부 등을 판정하여 회신하도록 하였다. 결과분석 은 같은 검사방법으로 한 응답기관이 10개 이상일 때만 평 균, 표준편차, 변이계수를 구하였고, 응답기관이 3기관 이 상일 때 중간값, 최저치, 최고치를 구하였다. 또한 검사결 과로부터 각 검사기관에서 판독하는 정상 및 비정상, 재검 여부의 판정결과에 대해서 분석하였다.
결 과
신생아 선별검사를 실시하고 있는 43개 기관에 대하여 관리물질을 발송하여 회신율이 83%이었다. 검사방법은 Guthrie 방법과 ICN사 키트, Bio-Rad사 키트, Bayer사 키트를 포함한 면역측정법, 그리고 방사능면역측정법등이
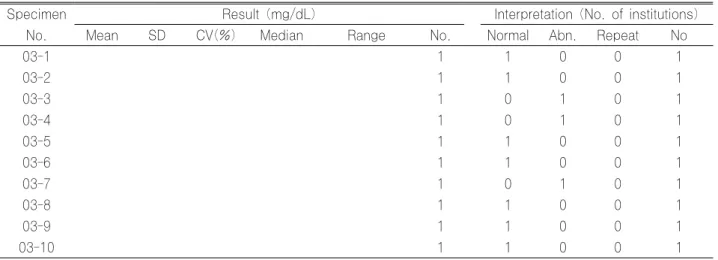
Table 1-1. PKU screen : Guthrie
Specimen Result (mg/dL) Interpretation (No. of institutions)
No. Mean SD CV(%) Median Range No. Normal Abn. Repeat No
03-1 1 1 0 0 1
03-2 1 1 0 0 1
03-3 1 0 1 0 1
03-4 1 0 1 0 1
03-5 1 1 0 0 1
03-6 1 1 0 0 1
03-7 1 0 1 0 1
03-8 1 1 0 0 1
03-9 1 1 0 0 1
03-10 1 1 0 0 1
있었으며, 각 종목별로 검사방법에 따른 검사수치 및 판정 결과는 Table 1-1부터 Table 9에 정리하였다.
고 찰
선천성 대사질환 분과위원회의 정도관리사업은 1997년 에 처음 시행되었으며 1998년에 1회, 1999년 2회, 2000 년 에 2회, 2001년 1회, 2002년 2회 그리고 2003년 2회 에 걸쳐 시행되었다. 회신율은 75%-80%정도로 매년 비슷 하였다.
이번에 사용된 정도관리검체는 환자로부터 직접 얻은 검 체는 아니고, 시약회사에서 제조한 정도관리물질로서, 정상 과 비정상 수치가 모두 포함되도록 하였다. 선천성대사질환 검사는 다른 임상화학 검사의 정도관리사업과 달리. 결과에 대한 정상 및 비정상 판독이 매우 중요하다. 그런데 환자에 서 흔히 보이는 아주 높은 수치가 아니라 측정결과치가 정 상치와 비정상치 부분에 걸쳐있는 경우에는 결과판정에 있 어 불일치가 관찰되었다. 예로 갑상선 호르몬 선별검사 (Total T4, Free T4)의 경우 cutoff에 근접한 결과를 보 이는 03-6, 03-9 검체의 경우 불일치 비율이 높았으며 검 사방법에 따라서도 차이가 있었다. 방사능면역측정법을 이 용한 기관 중 설정된 cutoff가 다른 기관과 차이가 커서 결 과상의 불일치를 보인 경우도 있었다. 히스티딘혈증과 호모 시스틴뇨증은 한 기관을 제외하고는 판정결과가 모두 유사 하였다. 이는 cutoff에 근접치를 보이는 검체가 없고 모든 기관에서 Guthrie 법을 사용하였고 사용하는 cutoff치가 일치하였기 때문이다. 또한 각 기관에서 검사에 사용하는 시약이 다양하고 검사방법에 따른 결과수치의 차이가 클 뿐 아니라, 같은 회사의 시약을 쓰는 경우에도, 정상 및 비정 상을 평가할 참고치가 서로 다른 경우를 발견할 수 있었다.
검사결과 수치를 입력하였으나 정상과 비정상을 판정하지 않은 경우, 소수의 기관이 사용하는 검사방법이 있는 경우, 늦게 검사결과를 보낸 경우 등이 있어 분석하는데 애로사항
이 있었다. 또한 측정한계 이하의 결과를 보이는 경우에는 나온 수치를 그대로 보고하는 대신 ‘측정한계 이하’ 로 보고 하는 것이 바람직할 것으로 사료된다.
검사방법을 살펴보면 호모시스틴혈증과 히스티딘혈증 선 별검사에는 Guthrie법이 주로 이용되고 있었으나, 다른 종 목들에 대해서는 효소면역법이 가장 보편적인 것으로 나타 났다. Guthrie법을 사용해오던 단풍당뇨증의 경우 효소면 역법을 이용한 기관이 현저히 늘어난 추세였고 페닐케톤뇨 증 선별검사에서도 Guthrie법을 이용하는 기관이 한기관 뿐이었다. 각 병원별로 다양한 키트를 사용하고 있어 평균 값, 표준편차, 변이계수등을 구한 항목이 많지 않았다. 페 닐케톤뇨증이나 갑상선호르몬 선별검사에서 부분적으로 변 이계수가 지나치게 큰 경우도 있었지만 결과판정에 직접적 인 영향을 미친다거나 각 검사 방법에 따른 일치율에 뚜렷 한 차이가 있다고 할 수는 없었다. 그러나 정량적인 측정방 법들에서 보이는 이러한 차이들에 대해서는 앞으로 정도관 리 강화를 통한 검사의 신뢰성 향상을 위한 더많은 노력이 요구될 것으로 판단되었다. 이들의 결과는 본 보고회에서 발표될 것이다.
요 약
2003년에도 선천성대사질환검사에 대한 정도관리사업을 2회 시행하였다. 관리물질은 여과지에 적신 정도관리물질을 이용하였고 43기관에 발송하여 시행하였다. 36기관에 회신 하여 83%의 회신율을 보였다. 페닐케톤뇨증, TSH, T4, 갈락토스혈증, 17-OHP, 단풍당뇨증, 호모시스틴뇨증, 히 스티딘혈증 선별검사에 대한 각 기관의 회신 결과를 토대로 정도관리성적을 분석하였다. 이들에 대한 각 기관의 회신 결과를 토대로 정도관리성적을 분석하였다.
Table 1-2. PKU screen : EIA (ICN)
Specimen Result (mg/dL) Interpretation (No. of institutions)
No. Mean SD CV(%) Median Range No Normal Abn. Repeat No
03-1 1.0 0.6 60 0.9 0.1-2.6 18 18 0 0 18
03-2 0.8 0.8 100 0.6 0.01-2.7 18 18 0 0 18
03-3 13.9 1.8 13 14.0 10.4-16.9 18 0 18 0 18
03-4 6.6 1.1 17 6.4 4.9-9.8 18 0 18 0 18
03-5 1.4 0.7 50 1.4 0.5-2.9 18 18 0 0 18
03-6 2.6 4.9 188 1.4 0.1-21.9 18 17 1 0 18
03-7 7.1 1.5 2 7.0 4.9-10.8 18 0 18 0 18
03-8 1.0 0.5 50 1.0 0.1-2.1 18 18 0 0 18
03-9 0.5 0.4 93 0.3 0-1.6 18 18 0 0 18
03-10 0.6 0.4 65 0.6 0.1 18 18 0 0 18
Table 1-3 PKU screen : EIA (Bayer)
Specimen Result (mg/dL) Interpretation (No. of institutions)
No. Mean SD CV(%) Median Range No Normal Abn. Repeat No
03-1 0.5 0.4-1.0 5 5 0 0 5
03-2 1.4 1.0-1.7 5 5 0 0 5
03-3 18.1 15-26 5 0 5 0 5
03-4 9.8 15-26 5 0 5 0 5
03-5 1.0 0.2-1.1 5 5 0 0 5
03-6 03-7 03-8 03-9 03-10
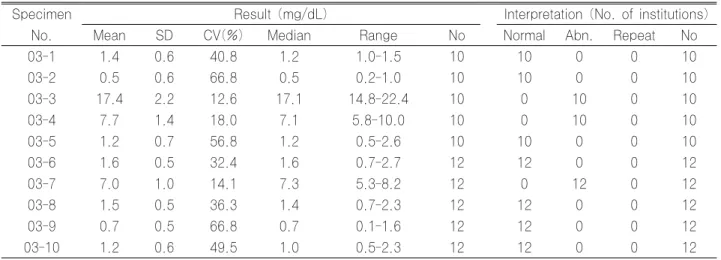
Table 1-4. PKU screen : EIA (Bio-Rad)
Specimen Result (mg/dL) Interpretation (No. of institutions)
No. Mean SD CV(%) Median Range No Normal Abn. Repeat No
03-1 1.4 0.6 40.8 1.2 1.0-1.5 10 10 0 0 10
03-2 0.5 0.6 66.8 0.5 0.2-1.0 10 10 0 0 10
03-3 17.4 2.2 12.6 17.1 14.8-22.4 10 0 10 0 10
03-4 7.7 1.4 18.0 7.1 5.8-10.0 10 0 10 0 10
03-5 1.2 0.7 56.8 1.2 0.5-2.6 10 10 0 0 10
03-6 1.6 0.5 32.4 1.6 0.7-2.7 12 12 0 0 12
03-7 7.0 1.0 14.1 7.3 5.3-8.2 12 0 12 0 12
03-8 1.5 0.5 36.3 1.4 0.7-2.3 12 12 0 0 12
03-9 0.7 0.5 66.8 0.7 0.1-1.6 12 12 0 0 12
03-10 1.2 0.6 49.5 1.0 0.5-2.3 12 12 0 0 12
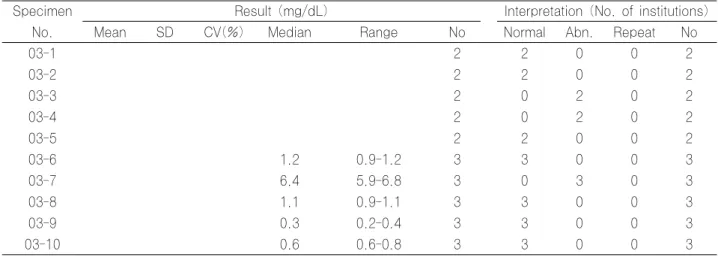
Table 1-5. PKU screen : Others(FIA)
Specimen Result (mg/dL) Interpretation (No. of institutions)
No. Mean SD CV(%) Median Range No Normal Abn. Repeat No
03-1 2 2 0 0 2
03-2 2 2 0 0 2
03-3 2 0 2 0 2
03-4 2 0 2 0 2
03-5 2 2 0 0 2
03-6 1.2 0.9-1.2 3 3 0 0 3
03-7 6.4 5.9-6.8 3 0 3 0 3
03-8 1.1 0.9-1.1 3 3 0 0 3
03-9 0.3 0.2-0.4 3 3 0 0 3
03-10 0.6 0.6-0.8 3 3 0 0 3
Table 2-1. Neonatal TSH : EIA (ICN)
Specimen Result (uIU/mL) Interpretation (No. of institutions)
No. Mean SD CV(%) Median Range No Normal Abn. Repeat No
03-1 58.4 10.8 18.5 57.4 40.9-80.7 17 0 17 0 17
03-2 1.5 2.6 167.0 0.4 0.005-7.2 17 17 0 0 17
03-3 9.8 2.8 28.5 9.8 6.9-14.1 17 17 0 0 17
03-4 9.0 2.5 27.9 8.6 5.27-12.7 17 17 0 0 17
03-6 5.2 4.5 87.0 4.2 1-15.3 17 17 0 0 17
03-7 3.7 2.3 62.3 3.5 1-8.39 17 17 0 0 17
03-8 25.7 3.0 11.8 25.0 23-33.1 17 0 17 0 17
03-9 1.2 1.0 88.8 1.0 0.1-3.4 17 17 0 0 17
Table 2-2. Neonatal TSH : EIA (Bayer)
Specimen Result (uIU/mL) Interpretation (No. of institutions)
No. Mean SD CV(%) Median Range No Normal Abn. Repeat No
03-1 41.7 37.7-47.1 5 0 5 0 5
03-2 0.5 0.5-2.3 5 5 0 0 5
03-3 0.7 0.5-1.6 5 5 0 0 5
03-4 0.5 0.4-1.0 5 5 0 0 5
03-6 2.8 0.3-4.6 3 3 0 0 3
03-7 1.1 0.2-1.3 3 3 0 0 3
03-8 29.0 23.2-33.4 3 0 3 0 3
03-9 1.0 0.2-1.3 3 3 0 0 3
Table 2-3. Neonatal TSH : EIA (Bio-Rad)
Specimen Result (uIU/mL) Interpretation (No. of institutions)
No. Mean SD CV(%) Median Range No Normal Abn. Repeat No
03-1 39.6 31.9-56 5 0 5 0 5
03-2 1.5 1.0-5.2 5 5 0 0 5
03-3 1.8 1.1-4.8 5 5 0 0 5
03-4 1.9 1.0-4.5 5 5 0 0 5
03-6 4.7 0.1-7.9 7 7 0 0 7
03-7 6.2 0.1-9.6 7 7 0 0 7
03-8 28.3 22.8-38.8 7 0 7 0 7
03-9 4.3 0.1-6.3 7 7 0 0 7
Table 2-4. Neonatal TSH : RIA
Specimen Result (uIU/dL) Interpretation (No. of institutions)
No. Mean SD CV(%) Median Range No Normal Abn. Repeat No
03-1 62.5 27.5-122 4 0 4 0 4
03-2 0.5 0.02-1.01 4 4 0 0 4
03-3 1.9 0.54-4.2 4 4 0 0 4
03-4 1.0 0.29-3.4 4 4 0 0 4
03-6 6.9 3.5-10.2 3 3 0 0 3
03-7 9.3 3.7-14.3 3 3 0 0 3
03-8 40.8 24.1-57.6 3 1 2 0 3
03-9 1.8 1.6-3.5 3 3 0 0 3
Table 2-5. Neonatal TSH : Others(FIA)
Specimen Result (uIU/dL) Interpretation (No. of institutions)
No. Mean SD CV(%) Median Range No Normal Abn. Repeat No
03-1 30 28-39.1 3 0 3 0 3
03-2 0.5 0.27-0.5 3 3 0 0 3
03-3 0.77 0.5-0.8 3 3 0 0 3
03-4 0.5 0.5-0.64 3 3 0 0 3
03-6 0.2 0.09-0.3 5 5 0 0 5
03-7 0.3 0.1-0.4 5 5 0 0 5
03-8 16.5 14.7-19.7 5 0 5 0 5
03-9 0.2 0.09-0.5 5 5 0 0 5
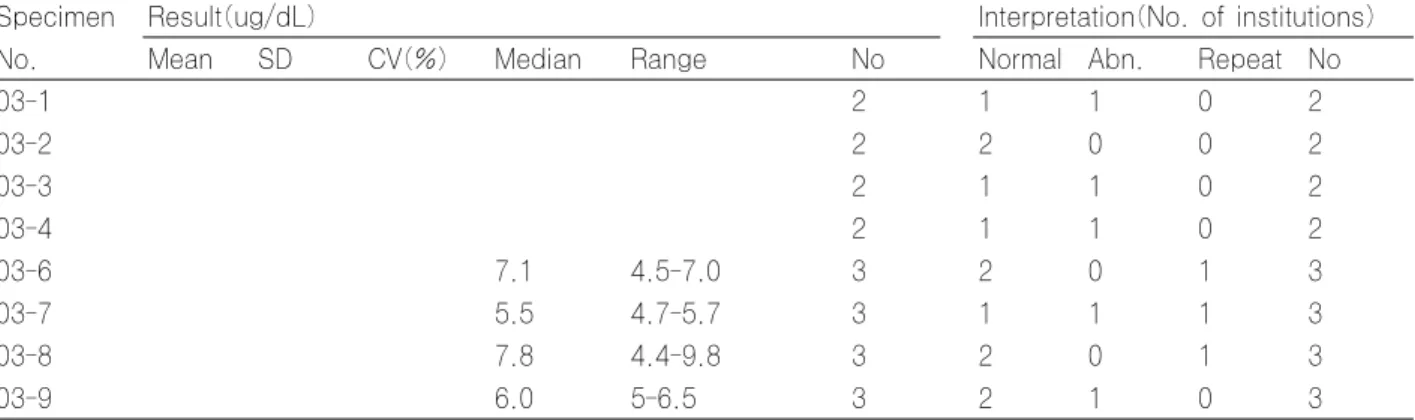
Table 3-1. Neonatal Total T4 : RIA
Specimen Result(ug/dL) Interpretation(No. of institutions)
No. Mean SD CV(%) Median Range No Normal Abn. Repeat No
03-1 2 1 1 0 2
03-2 2 2 0 0 2
03-3 2 1 1 0 2
03-4 2 1 1 0 2
03-6 7.1 4.5-7.0 3 2 0 1 3
03-7 5.5 4.7-5.7 3 1 1 1 3
03-8 7.8 4.4-9.8 3 2 0 1 3
03-9 6.0 5-6.5 3 2 1 0 3
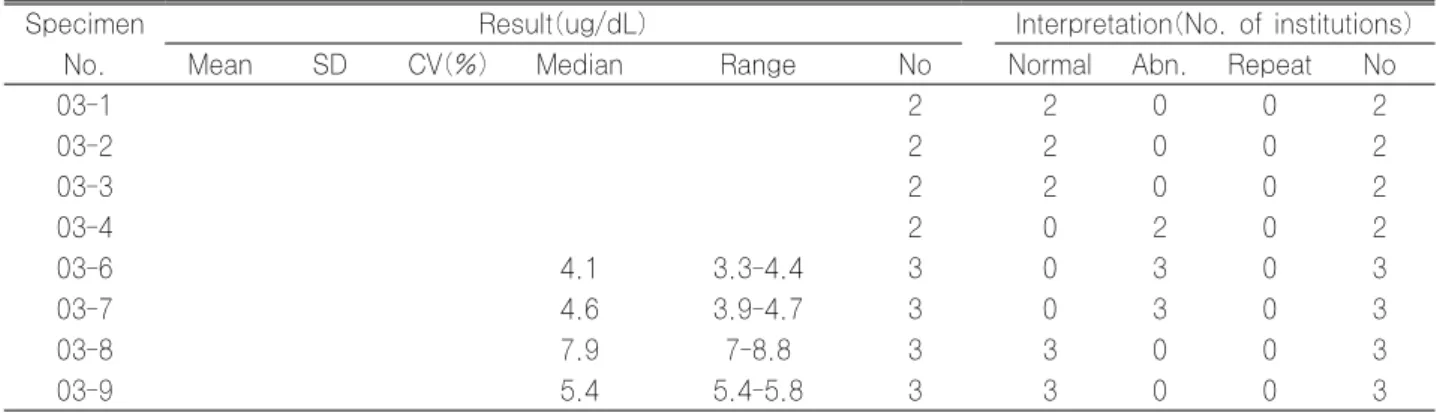
Table 3-2. Neonatal Total T4 : Others(FIA)
Specimen Result(ug/dL) Interpretation(No. of institutions)
No. Mean SD CV(%) Median Range No Normal Abn. Repeat No
03-1 2 2 0 0 2
03-2 2 2 0 0 2
03-3 2 2 0 0 2
03-4 2 0 2 0 2
03-6 4.1 3.3-4.4 3 0 3 0 3
03-7 4.6 3.9-4.7 3 0 3 0 3
03-8 7.9 7-8.8 3 3 0 0 3
03-9 5.4 5.4-5.8 3 3 0 0 3
Table 4-1. Neonatal Free T4 : EIA (Bayer)
Specimen Result(ng/dL) Interpretation(No. of institutions)
No. Mean SD CV(%) Median Range No Normal Abn. Repeat No
03-1 1.5 1.0-1.8 9 9 0 0 9
03-2 2.3 1.1-2.7 9 9 0 0 9
03-3 1.1 0.8-3.3 9 9 0 0 9
03-4 1.1 0.8-1.3 9 9 0 0 9
03-6 0.8 0.6-1.0 9 5 3 1 9
03-7 1.0 0.6-1.1 9 8 0 1 9
03-8 1.4 1.09-1.7 9 9 0 0 9
03-9 0.8 0.6-1.1 9 5 3 1 9
Table 4-2. Neonatal Free T4 : EIA (Bio-Rad)
Specimen Result(ng/dL) Interpretation(No. of institutions)
No. Mean SD CV(%) Median Range No Normal Abn. Repeat No
03-1 1.1 1.1-1.3 4 4 0 0 4
03-2 1.5 0.9-2.0 4 4 0 0 4
03-3 0.9 0.8-1.1 4 4 0 0 4
03-4 0.9 0.4-1.0 4 3 1 0 4
03-6 0.7 0.6-0.7 5 0 4 1 5
03-7 1.0 0.8-1.1 5 4 0 1 5
03-8 1.1 0.9-1.3 5 4 0 1 5
03-9 0.6 0.4-0.6 5 0 4 1 5
Table 5-1. Galactosemia screen : Guthrie test
Specimen Result(mg/dL) Interpretation(No. of institutions)
No. Mean SD CV(%) Median Range No Normal Abn. Repeat No
03-1 2 2 0 0 2
03-2 2 2 0 0 2
03-3 2 0 2 0 2
03-4 2 0 2 0 2
03-5 2 2 0 0 2
03-6 2 2 0 0 2
03-7 2 0 2 0 2
03-8 2 2 0 0 2
03-9 2 2 0 0 2
03-10 2 2 0 0 2
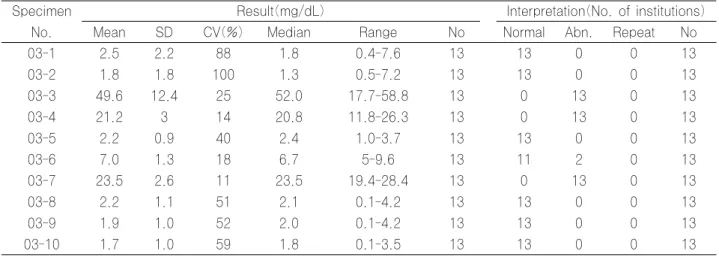
Table 5-2. Galactosemia screen : EIA (ICN)
Specimen Result(mg/dL) Interpretation(No. of institutions)
No. Mean SD CV(%) Median Range No Normal Abn. Repeat No
03-1 2.5 2.2 88 1.8 0.4-7.6 13 13 0 0 13
03-2 1.8 1.8 100 1.3 0.5-7.2 13 13 0 0 13
03-3 49.6 12.4 25 52.0 17.7-58.8 13 0 13 0 13
03-4 21.2 3 14 20.8 11.8-26.3 13 0 13 0 13
03-5 2.2 0.9 40 2.4 1.0-3.7 13 13 0 0 13
03-6 7.0 1.3 18 6.7 5-9.6 13 11 2 0 13
03-7 23.5 2.6 11 23.5 19.4-28.4 13 0 13 0 13
03-8 2.2 1.1 51 2.1 0.1-4.2 13 13 0 0 13
03-9 1.9 1.0 52 2.0 0.1-4.2 13 13 0 0 13
03-10 1.7 1.0 59 1.8 0.1-3.5 13 13 0 0 13
Table 5-3. Galactosemia screen : EIA (Bio-Rad)
Specimen Result(mg/dL) Interpretation(No. of institutions)
No. Mean SD CV(%) Median Range No Normal Abn. Repeat No
03-1 0.8 0.5-3.6 7 7 0 0 7
03-2 0.8 0.5-2.4 7 7 0 0 7
03-3 54.2 40.4-70 7 0 7 0 7
03-4 21.0 20-25.5 7 0 7 0 7
03-5 0.9 0.6-2.0 7 7 0 0 7
03-6 5.6 3.1-7.9 7 7 0 0 7
03-7 21.9 20.4-27.4 7 0 7 0 7
03-8 1.6 0.5-2.6 7 7 0 0 7
03-9 1.7 0.1-2.5 7 6 1 0 7
03-10 1.7 1.2-2.5 7 7 0 0 7
Table 5-4. Galactosemia screen : Others (FIA)
Specimen Result(mg/dL) Interpretation(No. of institutions)
No. Mean SD CV(%) Median Range No Normal Abn. Repeat No
03-1 2 2 0 0 2
03-2 2 2 0 0 2
03-3 2 0 2 0 2
03-4 2 0 2 0 2
03-5 2 2 0 0 2
03-6 4.5 3.3-4.6 3 3 0 0 3
03-7 13.0 12.3-14.6 3 0 3 0 3
03-8 0.4 0.3-0.9 3 3 0 0 3
03-9 0.5 0.5-0.8 3 3 0 0 3
03-10 4.1 2.7-5.4 3 3 0 0 3
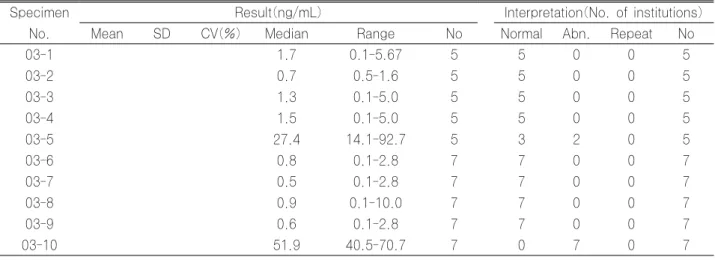
Table 6-1. 17-OH progesterone : EIA (ICN)
Specimen Result(ng/mL) Interpretation(No. of institutions)
No. Mean SD CV(%) Median Range No Normal Abn. Repeat No
03-1 1.7 0.1-5.67 5 5 0 0 5
03-2 0.7 0.5-1.6 5 5 0 0 5
03-3 1.3 0.1-5.0 5 5 0 0 5
03-4 1.5 0.1-5.0 5 5 0 0 5
03-5 27.4 14.1-92.7 5 3 2 0 5
03-6 0.8 0.1-2.8 7 7 0 0 7
03-7 0.5 0.1-2.8 7 7 0 0 7
03-8 0.9 0.1-10.0 7 7 0 0 7
03-9 0.6 0.1-2.8 7 7 0 0 7
03-10 51.9 40.5-70.7 7 0 7 0 7
Table 6-2. 17-OH progesterone : EIA (Bayer)
Specimen Result(ng/mL) Interpretation(No. of institutions)
No. Mean SD CV(%) Median Range No Normal Abn. Repeat No
03-1 1 0.67-1.24 9 9 0 0 9
03-2 0.63 <0.01-1.2 9 9 0 0 9
03-3 0.9 <0.01-1.3 9 9 0 0 9
03-4 1.0 <0.01-1.7 9 9 0 0 9
03-5 55.7 41.53-77.7 9 0 9 0 9
03-6 0.5 0.4-1.6 6 6 0 0 6
03-7 0.4 0.2-0.9 6 6 0 0 6
03-8 0.38 0.2-2.2 6 6 0 0 6
03-9 0.19 0.1-0.46 6 6 0 0 6
03-10 30.1 24.1-33.9 6 0 6 0 6
Table 6-3. 17-OH progesterone : EIA (Bio-Rad)
Specimen Result(ng/mL) Interpretation(No. of institutions)
No. Mean SD CV(%) Median Range No Normal Abn. Repeat No
03-1 1.1 0.1-1.2 5 5 0 0 5
03-2 0.2 0.1-0.9 5 5 0 0 5
03-3 1.1 0.1-1.2 5 5 0 0 5
03-4 1.6 0.1-1.2 5 5 0 0 5
03-5 47.1 44.8-52.5 5 0 5 0 5
03-6 0.8 0.3-1.0 6 6 0 0 6
03-7 0.9 0.3-1.9 6 6 0 0 6
03-8 0.6 0.2-0.8 6 6 0 0 6
03-9 0.6 0.1-1.0 6 6 0 0 6
03-10 31.7 27.2-37 6 0 6 0 6
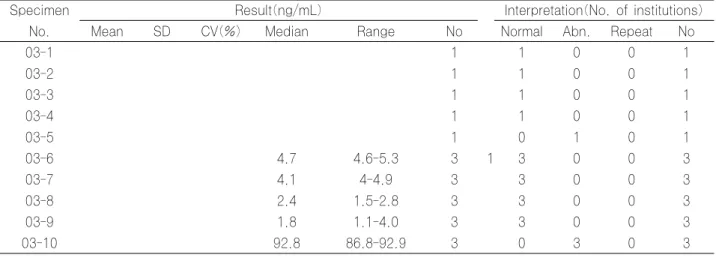
Table 6-4. 17-OH progesterone : Others(FIA)
Specimen Result(ng/mL) Interpretation(No. of institutions)
No. Mean SD CV(%) Median Range No Normal Abn. Repeat No
03-1 1 1 0 0 1
03-2 1 1 0 0 1
03-3 1 1 0 0 1
03-4 1 1 0 0 1
03-5 1 0 1 0 1
03-6 4.7 4.6-5.3 3 1 3 0 0 3
03-7 4.1 4-4.9 3 3 0 0 3
03-8 2.4 1.5-2.8 3 3 0 0 3
03-9 1.8 1.1-4.0 3 3 0 0 3
03-10 92.8 86.8-92.9 3 0 3 0 3
Table 7-1. MSUD screen : Guthrie test
Specimen Result(mg/dL) Interpretation(No. of institutions)
No. Mean SD CV(%) Median Range No Normal Abn. Repeat No
03-1 2 0-2 7 7 0 0 7
03-2 2 1-2 7 7 0 0 7
03-3 2 1-2 7 7 0 0 7
03-4 2 0-2 7 7 0 0 7
03-6 2 1-3 4 4 0 0 4
03-7 2 2 4 4 0 0 4
03-8 2 1-2 4 4 0 0 4
03-9 2 1-2 4 4 0 0 4
Table 7-2. MSUD screen : EIA (Bio-Rad)
Specimen Result(mg/dL) Interpretation(No. of institutions)
No. Mean SD CV(%) Median Range No Normal Abn. Repeat No
03-1 3.5 1.2-4.4 8 8 0 0 8
03-2 0.6 0.4-1.4 8 8 0 0 8
02-3 3.5 1.2-4.1 8 8 0 0 8
03-4 2.0 1.0-2.8 8 8 0 0 8
03-6 2.5 0.8 31.0 2.7 1.3-3.6 10 10 0 0 10
03-7 2.1 0.8 29.6 2.0 1.4-3.5 10 10 0 0 10
03-8 2.5 1.1 44.4 2.5 1.2-4.0 10 10 0 0 10
03-9 1.3 0.3 22.1 1.3 1-1.8 10 10 0 0 10
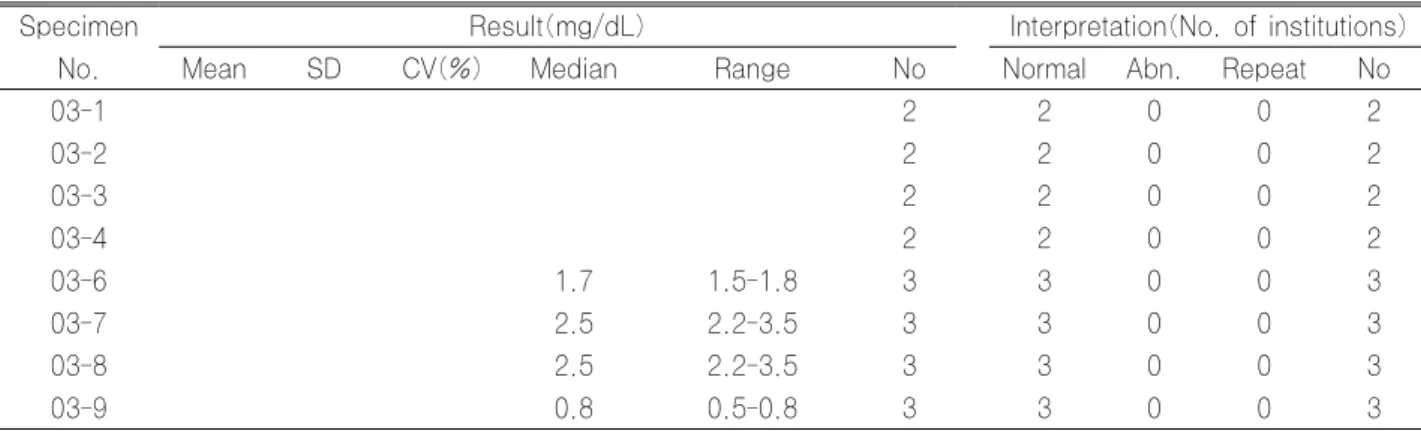
Table 7-3. MSUD screen :Others(FIA)
Specimen Result(mg/dL) Interpretation(No. of institutions)
No. Mean SD CV(%) Median Range No Normal Abn. Repeat No
03-1 2 2 0 0 2
03-2 2 2 0 0 2
03-3 2 2 0 0 2
03-4 2 2 0 0 2
03-6 1.7 1.5-1.8 3 3 0 0 3
03-7 2.5 2.2-3.5 3 3 0 0 3
03-8 2.5 2.2-3.5 3 3 0 0 3
03-9 0.8 0.5-0.8 3 3 0 0 3
Table 8. Homocystinuria screen : Guthrie test
Specimen Result(mg/dL) Interpretation(No. of institutions)
No. Mean SD CV(%) Median Range No Normal Abn. Repeat No
03-1 2 2-4 7 7 0 0 7
03-2 2 2-4 7 7 0 0 7
03-3 2 1-4 7 7 0 0 7
03-4 3 2-4 7 7 0 0 7
03-6 1.0 0 0 1.0 1-<1.5 10 10 0 0 10
03-7 1.0 0 0 1.0 1-<1.5 10 10 0 0 10
03-8 1.0 0 0 1.0 1-<1.5 10 10 0 0 10
03-9 1.0 0 0 1.0 1-<1.5 10 10 0 0 10
Table 9. Histidinemia screen : Guthrie test
Specimen Result(mg/dL) Interpretation(No. of institutions)
No. Mean SD CV(%) Median Range No Normal Abn. Repeat No
03-1 2.5 1-4 6 6 0 0 6
03-2 2.0 1-2 6 6 0 0 6
03-3 2.0 2 6 6 0 0 6
03-4 2.0 1-2 6 6 0 0 6
03-6 2.0 2-4 6 6 0 0 6
03-7 2.0 1-4 6 6 0 0 6
03-8 2.0 1-4 6 5 1 0 6
03-9 2.0 1-4 6 5 1 0 6