https://doi.org/10.9721/KJFST.2019.51.6.584
584
©The Korean Society of Food Science and Technology
Effect of extraction temperature on physicochemical constituents
and antioxidant potentials of Pu-erh tea
Sung-Hee Choi1, Il-Doo Kim2, Sanjeev Kumar Dhungana3, and Kwangsoo Park1,*
1Department of Korean Culture, Wonkwang University
2International Institute of Research & Development, Kyungpook National University 3National Institute of Crop Science, Rural Development Administration
Abstract Of all the various types of tea that are available, Pu-erh tea has attracted much attention because of its health-promoting effects. The objective of this study was to investigate the physicochemical and antioxidant properties of two types of Pu-erh tea, Gushu Pu-erh and typical Pu-erh, extracted at 80 and 100oC, respectively. The Gushu Pu-erh extracts showed lower pH but higher antioxidant potential at both the temperatures, as compared to the typical Pu-erh. The mineral content of the tea extracts was greater at 100oC than at 80oC. Among the seven categories of the flavor compounds that were detected, the peak area of esters was the highest in the Gushu Pu-erh extracts. The type of tea and the extraction temperature significantly affected the physicochemical and functional properties of these tea extracts. This study revealed that Gushu Pu-erh extracted at 100oC for 3 min with 30 s of shaking provides better results in terms of the antioxidant potential and mineral content.
Keywords: Antioxidant potential, Typical Pu-erh, Flavor compound, Gushu Pu-erh
Introduction
As an ancient beverage, tea is one of the most popular drinks in the world. The tea products have been categorized into six groups (green tea, yellow tea, white tea, oolong tea, black tea, and dark tea) based on the processing methods applied (Hilal, 2017). Three types of tea green, yellow, and white undergo minimal processing, other two oolong and black tea products are subjected to oxidizing while the other dark tea, such as Pu-erh tea is fermented. Pu-erh tea is typically prepared via two methods. In the first method, the raw Pu-erh tea is produced by pressing large and unoxidized tea leaves which are then fermented for several years at room temperature. In the other way of Pu-erh tea preparation, teas are ripened for several months using microbes under optimum conditions before subjected for being pressed (Chen et al., 2009). Pu-erh tea has got reddish to brownish red or gray appearance, thick and bright red infusion color, bittersweet taste and a unique moldy odor which becomes more prominent with the fermentation and the leaves aging (Zhou et al., 2004).
Pu-erh tea has already been established as a favorite drink in China and other Southeast Asian countries, and it has also been popular in Japan, USA, Britain and other countries. Pu-erh tea, which is originally produced in the Yunnan Province of China, has attracted much attention because of its unique flavor and potential
health benefits (Ahmed et al., 2010). The multiple health-promoting effects of this functional beverage include anti-oxidative (Fan et al., 2013), antibacterial (Hu et al., 2010), antitumor (Zhao et al., 2011), cholesterol-lowering (Peng et al., 2013), anti-obesity (Oi et al., 2012), and hypoglycemic (Du et al., 2012) activities. Pu-erh are also rich in several mineral elements compared with black tea, green tea, Oolong tea and white tea (McKenzie et al., 2010). In a previous study (Gao et al., 2017), 55 volatile compounds in the essential oil extracted from Pu-erh tea by fully automatic headspace-solid phase microextraction method were identified which were higher than the compounds extracted by other four extraction methods, Soxhlet, ultrasonic-assisted, simultaneous distillation, and steam distillation.
The health benefits of Pu-erh tea also vary with the raw material, processing method, extraction solvent and time and so on. In Chinese ‘Gushu’ means ancient tea trees, and the Pu-erh tea prepared from these trees is highly demanded and expensive as well. Gushu Pu-erh are known to be prepared from the tea leaves obtained from trees of several hundred years old. Pu-erh teas are also prepared from the leaves of cultivated young tea trees, which are, in this study, referred to as typical Pu-erh. There have various studies on Pu-erh tea been published, however, a detailed comparative study on quality and functional properties of Gushu Pu-erh and typical Pu-erh extracted in different temperatures is not well documented. A previous study of our research team (Choi et al., 2018) investigated some of the quality characteristics and antioxidant potential of the two tea types, in which the pH value of Gushu Pu-erh tea was lower than typical Pu-erh. However, Gushu Pu-erh showed higher antioxidant potentials and free amino acid content than the typical Pu-erh. The volatile aroma compounds are important criteria in the evaluation of tea quality (Ho et al., *Corresponding author: Kwangsoo Park, Department of Korean
Culture, Wonkwang University, Jeonbuk 54538, Korea Tel +82-63-850-5341
Fax: +82-63-850-7303 E-mail: [email protected]
Received August 25, 2019; revised October 27, 2019; accepted November 11, 2019
2015). Considering the effect of extracting temperature (Hajiaghaalipour et al., 2016) and age of tea tree on their quality and antioxidant properties, this study was designed to compare the functional property and quality characteristics, including the volatile aromas of Gushu Pu-erh and typical Pu-erh teas. The finding of study could provide useful information for further study on the effect of extraction temperature and source of tea leave on the quality and functional properties of Pu-erh teas.
Materials and Methods
Chemicals and materials
Folin-Ciocalteu phenol reagent, DPPH, ABTS, and pyrogallol were purchased from Sigma-Aldrich (St. Louis, MO, USA). All other reagents used were analytical grade. The tea samples, typical Pu-erh and Gushu Pu-erh manufactured in Yunnan province of China, were obtained for this study. There are mainly two types of Pu-erh teas: raw and ripe. In the present, ripe type of both typical Pu-erh and Gushu Pu-erh tea was considered. Ripe pu-erh leaves are made from black tea leaves. During processing, ripe Pu-erh tea is subjected to controlled post-fermentation, which helps reduce the bitter astringent taste, eliminate the musty odor, and shorten the aging period.
Preparation of tea extracts
Two types of Pu-erh tea were extracted in water at 80 and 100oC and the samples were named as follows: CPE-80: a 1.5-g of dried sample of typical Pu-erh tea was extracted with 150 mL of boiling water and incubated at 80oC for 3 min with gentle shaking for 30 s; GPE-80: a 1.5-g of dried sample of Gushu Pu-erh was extracted with 150 mL of boiling water and incubated at 80oC for 3 min with gentle shaking for 30 s; CPE-100: a dried sample of typical Pu-erh tea (1.5 g) extracted with boiling water (150 mL) and incubated at 100oC for 3 min with gentle shaking for 30 s; GPE-100: a dried sample of Gushu Pu-erh tea (1.5 g) extracted with boiling water (150 mL) and incubated at 100oC for 3 min with gentle shaking for 30 s. The extraction conditions were set to get a similarity to a normal tea brewing.
Determination of pH and titratable acidity
The pH value of the sample extracts was determined using a pH meter (Model 250; Beckman Coulter, Inc., Fullerton, CA, USA). Titratable acidity (lactic acid in g/L) was measured by mixing 5 mL of the extracts and 125 mL of deionized water, followed by titration with 0.1 N sodium hydroxide to an endpoint of pH 8.2. Since the visibly detectable change in the tea extracts was observed at pH 8.2, the pH value was considered as right endpoint. Color measurement
Color measurements of tea extracts were carried out by a Chroma Meter (CR-300, Minolta Corp., Osaka, Japan) and the values were expressed as L* (lightness), a* (redness, + or greenness, −), and b* (yellowness, + or blueness, −). The instrument was standardized using a Minolta calibration plate (YCIE=94.5, XCIE=0.3160, yCIE=0.330) and a Hunter L a b standard plate
(L*=97.51, a*= “0.18, b*= +1.67) with a D65 illuminant as described earlier (Kim et al., 2014).
DPPH radical scavenging activity
DPPH (1,1-Diphenyl-2-picrylhydrazyl) radical scavenging activity was measured following a method described earlier (Dhungana et al., 2015) with some modifications. A 0.8-mL of freshly prepared 0.2 mM DPPH ethanol solution was mixed with 0.2 mL of the tea extracts in micro tubes (1.5 mL) using a vortexer. Similarly, 0.8 mL of the DPPH and 0.2 mL of ethanol was mixed to prepare control. The mixture (0.2 mL) was put into 96-well plate and left to stand for 30 min at room temperature under dark condition, and then the absorbance value was measured at 517 nm using a microplate spectrophotometer (Multiskan GO, Thermo Fisher Scientific, Vantaa, Finland).
Determination of the total polyphenol content
The total polyphenol contents of tea extracts were determined according to the Folin-Ciocalteau method (Singleton and Rossi, 1965). An undiluted Folin-Ciocalteau reagent (250 µL) was mixed with the tea extracts (50 µL). After 1 min, 750 µL of 20% (w/v) aqueous Na2CO3 was added to the mixture and the final volume was made up to 5.0 mL with distilled water. The mixture was incubated for 30 min at room temperature under dark condition and the absorbance value was measured at 760 nm using a microplate spectrophotometer (Multiskan GO, Thermo Fisher Scientific). The amount of polyphenol in the tea samples was calculated based on gallic acid (Sigma-Aldrich, St. Louis, MO, USA) which was used to prepare a calibration curve. The total polyphenol contents were reported as gallic acid equivalents (µg GAE/mL extract). ABTS radical scavenging activity
The ABTS (2,2'-Azino-bis(3-ethylbenzothiazoline-6-sulphonic acid)) radical scavenging activity of tea extracts was analyzed according to the method described by Miller et al. (1993) with a slight modification. The ABTS cation radical was generated by mixing equal amounts of stock solutions of 2.4 mM potassium persulfate and 7 mM ABTS prepared in double distilled water. The reaction mixture was left in the dark at room temperature for 10 min and absorbance value of the reaction mixture was adjusted to 0.7±0.02 at 734 nm by diluting it with double distilled water. The tea extracts (20 µL) and the diluted reaction mixture (180 µL) were mixed in 96-well plate by pipetting and kept in dark for 30 min and the absorbance was measured at 734 nm using a microplate spectrophotometer (Multiskan GO, Thermo Fisher Scientific). The ABTS radical scavenging activity was calculated using the following equation.
ABTS radical scavenging activity (%)=
where AC= absorbance of ABTS radical cation, AS= absorbance of a mixture of ABTS radical solution and tea extracts.
SOD (superoxide dismutase)-like activity
Assessment of the SOD-like activity in the sample extract was 1 AS–AS AC ---⎝ ⎠ ⎛ ⎞ 100× –
carried out according to the method described by Debnath et al. (2011). First of all, a reaction mixture was prepared by adding 1.3 mL of Tris-HCl buffer (50 mM Tris, 10 mM EDTA, pH 8.5) and 100 µL of 7.2 mM pyrogallol and then an aliquot (100 µL) of sample extract was added to it and allowed to react at 25oC in dark for 10 min. After the incubation, 50 µL of 1 N HCl was added into the mixture to terminate the reaction. The amount of pyrogallol oxidised during the reaction by tea samples in relation to a control was measured at an absorbance 420 nm using a microplate spectrophotometer (Multiskan GO, Thermo Fisher Scientific). For control, Tris-HCl buffer was used instead of the tea extracts. The SOD-like activity was determined using the following equation.
SOD-like activity (%) =
Flavonoid content
The flavonoid content of sample extracts was measured following the method described by Mohdaly et al. (2010). A 100-µL of tea extract was diluted with 500 µL of methanol, followed by an addition of 50 µL of AlCl3, 50 µL of 1 M NaOH, and 300 µL of double distilled water. The reaction mixture was allowed to stand in dark for 30 min at room temperature, and 200 µL of mixture was put into 96-well plate to measure the absorbance value at 510 nm using a microplate spectrophotometer (Multiskan GO, Thermo Fisher Scientific). Quercetin was used to plot standard curve and flavonoid content was measured as quercetin equivalent (µg QE/ mL extract).
Mineral content
Mineral content was analyzed following the method described earlier (Skujins, 1998). Sample extract (0.5 mL) and HNO3 (15.0 mL) were mixed. The mixture was diluted with equal volume of distilled water. Mineral concentrations were determined using inductively coupled plasma atomic emission spectrometer (ICP AES, Varian Vista, Victoria, Australia).
Solid phase microextraction (SPME)
SPME parameters were optimized for effective extraction and desorption for Pu-erh tea volatiles. The sample extract (10 mL) was added to a 40-mL glass vial containing a small Teflon-coated stirring bar with a screw top and Teflon-lined septum. After allowing equilibration for 20 min, the volatiles from the extracts were extracted for 30 min at 40oC using a 100 mm 50/30 µm DVB/Carboxen/PDMS SPME fiber (Supelco, Bellefonte, PA, USA). Before each exposure, the fiber was cleaned in a 260oC injection port for 5 min.
Gas chromatography-mass spectrometry (GC-MS) The GC-MS was conducted under the following conditions: Helium as the carrier gas with a constant flow mode of 2 mL/min. The source was kept at 200oC, and the transfer line and injector were kept at 220oC. Compounds were separated at 60 m, 0.25 mm
i.d., 0.5µm DB-Wax column (J&W Scientific, Folsom, CA, USA). The mass spectrometer was operated in the total ion chromatogram at 70 eV. GC-MS (Clarus 500 quadruple, Perkin/Elmer, Shelton, CT, USA) analysis was equipped with a software (Turbo Mass, Perkin/Elmer, Shelton, CT, USA). Data were collected from 40 to 300 m/z. Mass spectra matches were made by comparison of National Institute of Standards and Technology (NIST, Gaithersburg, MD, USA).
Identification of volatile compounds
Initial identifications were based upon the matches made from spectra in the NIST (NIST 2002 standard spectra) library, aroma descriptors, and linear retention index matches from literature or from standards. The final confirmation was based upon the combined matching of retention indices (LRI values), full scan mass spectra values, and aroma descriptions from standards with those observed in the sample (Kim et al., 2017).
Statistical analysis
Data were subjected to analysis of variance using SAS (version 9.4, SAS, Cary, NC, USA). Differences between means at p<0.05 were identified using Tukey test. Average values are presented as mean±standard deviation (SD) unless otherwise mentioned.
Results and Discussion
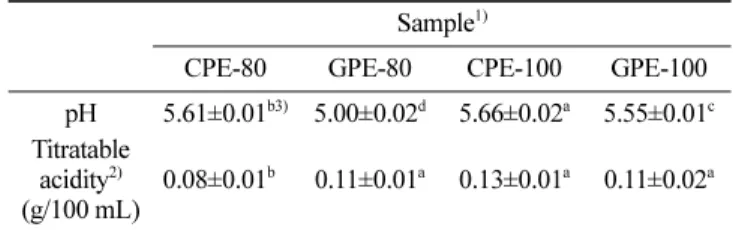
pH and titratable acidity
The general chemical characteristics of the tea extracts were evaluated based on the pH and titratable acidity (TA) values. The type of tea and extraction temperature both significantly affected the pH value of tea extracts. This might be due to variation in the type and amount of phytochemicals extractable at different temperatures. The TA value was significantly lower for CPE-80 (0.08) among the four sample extracts (Table 1). The tea extracts from Gushu Pu-erh were found more acidic compared to the CPEs at both temperatures. The TA value of GPE (0.11) at both temperatures and CPE-100 (0.13) were not significantly different. 1 Absorbance of solution with sample
Absorbance of solution without sample
---⎝ ⎠
⎛ ⎞ 100×
–
Table 1. pH and titratable acidity of typical Pu-erh extract (CPE) and Gushu Pu-erh extract (GPE)
Sample1)
CPE-80 GPE-80 CPE-100 GPE-100
pH 5.61±0.01b3) 5.00±0.02d 5.66±0.02a 5.55±0.01c Titratable
acidity2) (g/100 mL)
0.08±0.01b0 0.11±0.01a 0.13±0.01a 0.11±0.02a 1)CPE-80: dried typical Pu-erh tea (1.5 g) was extracted with boiling water (150 mL) and incubated at 80oC; CPE-100: dried typical Pu-erh tea (1.5 g) was extracted with boiling water (150 mL) and incubated at 100oC; GPE-80: dried Gushu Pu-erh tea (1.5 g) was extracted with boiling water (150 mL) and incubated at 80oC; GPE-100: dried Gushu Pu-erh tea (1.5 g) extracted with boiling water (150 mL) and incubated at 100oC. All the tea samples were incubated for 3 min with shaking for 30 s.
2)As lactic acid.
3)Values are means±SD of triplicate measurements. Values followed by different letters in the same row are significantly different (p<0.05).
The results of this study was in agreement with a previous report (Choi et al., 2018). The value of TA implies an impact of acid content on flavor of food, whereas that of the pH indicates to an environment that affects the ability of a microorganism to grow in a specific food (Je et al., 2005). Therefore, the variation in pH of tea extracts may influence their flavor and shelf-life (Tyl and Sadler, 2017). The lack of a correlation of pH and TA with extraction temperature might be due to a complex acid chemistry in tea extracts, suggesting many acids which exist at an extraction temperature are not (fully) deprotonated at the pH of the extract, and thus do not contribute to the extract’s pH value, but are measured during titration with a base (Gloess et al., 2013). Color measurement
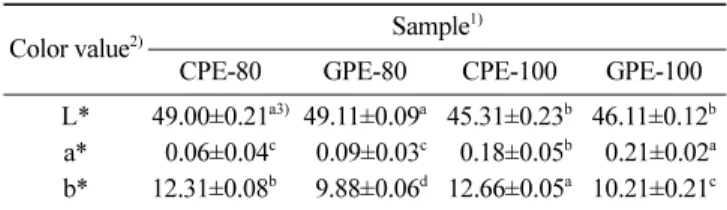
Color of food is a key factor in making decisions by consumers for its acceptability. Consumers also consider the color of food along with its nutritional and functional values. Type of tea and extraction temperature significantly affected Hunter’s color values of the tea extracts (Table 2). The lightness value was significantly higher for the tea extracted at 80oC (49.00 and 49.11) than those extracted at 100oC (45.31 and 46.11). On the other hand, the highest and lowest redness values were measured in GPE-100
(0.21) and CPE-80 (0.06), respectively. The higher redness value of the tea extracted at 100 than at 80oC might be due to more extraction of coloring agents at higher temperature. CPE (12.31 and 12.66) showed greater yellowness value than GPE (9.88 and 10.21) at both temperatures (80 and 100oC). The substantial variation in color value of tea extracts might be due to the effect of extracting temperature (Hajiaghaalipour et al., 2016) that affect extraction efficiency and/or difference in the polyphenol content (Harbowy and Balentine, 1997) of two types of tea.
Antioxidant potential
Antioxidant potential of tea extracts were evaluated through DPPH and ABTS radical scavenging activities, SOD-like activity, and total polyphenol and flavonoid contents. The value of antioxidant potentials observed at 100oC was significantly greater compared to that found at 80oC (Table 3). Similar results with the higher phenolics in the tea extracted at higher temperatures were also observed in previous studies (Choi et al., 2018). Results of this study also showed that GPE possessed higher antioxidant potentials compared to the CPE (Table 3). The higher antioxidant potential obtained with GPE was possibly due to the higher catechin content of the tea leaves obtained from older tea trees (Ahmed et al., 2010). The tea leaves harvested from older trees tastes much bitter, and the bitter taste of the tea leaves is more related to catechin, a group of polyphenol, content (Ahmed et al., 2010). The tea catechins demonstrate a range of cellular mechanisms that have antioxidative, inflammatory, neuro-protective, anti-cancer, anti-microbial, and anti-atherosclerotic activities (Clement, 2009). Phenolic compounds in tea play vital role in physicochemical properties of tea. About 20-40% dry matter of young tea shoots comprises of polyphenols which are responsible for the color, flavor and brightness of tea (Turkmen et al., 2009).
Mineral content
The total mineral content of Pu-erh tea extract was higher at 100oC (11,739.37-11,996.01 mg/kg) than at 80oC (11,295.91-11,176.98 mg/kg) (Table 4). The amount of Fe and Na was significantly higher in CPE than in GPE. Element Ca content was not significantly affected by the tea type and extraction temperature. Elements like Mg, K, and Ca, are reported to have beneficial Table 2. Hunter’s color values of typical Pu-erh (CPE) and
Gushu Pu-erh (GPE) tea extracts
Color value2) Sample
1)
CPE-80 GPE-80 CPE-100 GPE-100
L* 49.00±0.21a3) 49.11±0.09a 45.31±0.23b 46.11±0.12b a* 0.06±0.04c 00.09±0.03c 00.18±0.05b 00.21±0.02a b* 12.31±0.08b0 09.88±0.06d 12.66±0.05a 10.21±0.21c 1)CPE-80: dried typical Pu-erh tea (1.5 g) was extracted with boiling water (150 mL) and incubated at 80oC; CPE-100: dried typical Pu-erh tea (1.5 g) was extracted with boiling water (150 mL) and incubated at 100oC; GPE-80: dried Gushu Pu-erh tea (1.5 g) was extracted with boiling water (150 mL) and incubated at 80oC; GPE-100: dried Gushu Pu-erh tea (1.5 g) extracted with boiling water (150 mL) and incubated at 100oC. All the tea samples were incubated for 3 min with shaking for 30 s.
2)L*, lightness (100, white; 0, black); a*, redness (, green; +, red); b*, yellowness (, blue; +, yellow).
3)Values are means±SD of triplicate measurements. Values followed by different letters in the same row are significantly different (p<0.05).
Table 3. DPPH and ABTS radical scavenging activities, SOD-like activity, and total polyphenol and flavonoid contents of typical Pu-erh (CPE) and Gushu Pu-erh (GPE) tea extracts
Sample1) DPPH
(% Inhibition) ABTS (%) SOD (%)
Total polyphenol (µg GAE2)/mL) Flavonoid (µg QE3)/mL) CPE-80 077.12±0.10d4) 80.31±0.50d 20.30±0.51d 1,532.61±2.19d 237.31±2.23d GPE-80 83.18±0.06c 83.29±0.14c 22.66±0.65c 1,599.28±1.89c 300.15±2.92c CPE-100 91.41±0.21b 94.88±0.10b 29.66±0.15b 1,821.31±2.31b 572.23±5.18b GPE-100 92.11±0.05a 96.90±0.03a 31.00±0.12a 2,022.66±5.51a 621.33±6.00a
1)CPE-80: dried typical Pu-erh tea (1.5 g) was extracted with boiling water (150 mL) and incubated at 80oC; CPE-100: dried typical Pu-erh tea (1.5 g) was extracted with boiling water (150 mL) and incubated at 100oC; GPE-80: dried Gushu Pu-erh tea (1.5 g) was extracted with boiling water (150 mL) and incubated at 80oC; GPE-100: dried Gushu Pu-erh tea (1.5 g) extracted with boiling water (150 mL) and incubated at 100oC. All the tea samples were incubated for 3 min with shaking for 30 s.
2)Gallic acid equivalent. 3)Quercetin equivalent.
health effects in the prevention and treatment of essential hypertension (Houston and Harper, 2008). On the other hand, elements like As, Pb, Cd, and Hg; which are also health hazardous; were not detected in the tea extracts. High-quality teas produced in China have been found to contain high amount of minerals like Zn, Mn, Mg, K, and Ca (Czernicka et al., 2017). Volatile flavor compounds
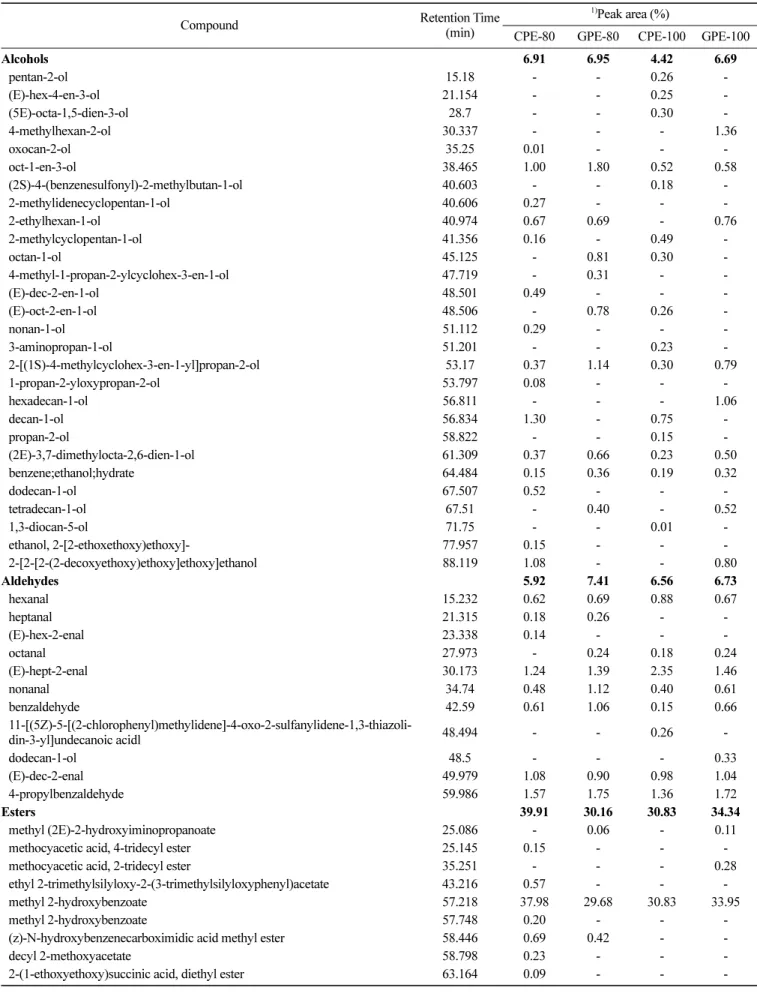
Origin of tea and extraction temperature influenced the volatile flavor compounds of tea extracts (Table 5). A total of 80 volatile compounds, categorized under seven groups (28 alcohols, 11 aldehydes, 9 esters, 11 hydrocarbons, 10 ketones, 4 phenols, and 7 others) were detected according to their mass spectrum and retention time. Total peak area for esters was higher than that of either group. The peak areas of alcohols (6.95 and 6.69%), aldehydes (7.41 and 6.73%), hydrocarbons (3.65 and 3.36%), phenols (7.09 and 7.43%), and others (18.48 and 9.45%) for GPE at 80 and 100oC were higher than those of CPE (6.91 and 4.42%, 5.92 and 6.56%, 3.08 and 2.93%, 6.27 and 5.87%, and 3.85 and 4.21%), respectively. However, the peak areas of ester and ketones was greater for CPE than those for GPE at 80oC.
Quantitative abundance and odor thresholds of the volatile compounds account for the overall aroma of tea (Kraujalytë et al., 2016). Among others, floral aroma of alcohols, stale/musty aroma of methoxyphenolic compounds, and woody or floral aroma of ketones play an important role in the special flavor of Pu-erh ripe tea (Selli and Cayhan, 2009). Oxidative degradation of fatty acids may result into formation of alcohols. Many of the alcohols identified in the present study are also detected in orthodox black tea (Joshi and Gulati, 2015). 1-Octen-3-ol imparts a mushroom odor and has a key role in the overall aroma formation in different foods. This compound was also identified in Pu-erh and Fuzhuan teas (Lv et al., 2014). Branched chain aldehydes are reported being responsible for the malty smell odor and are recognized as key odorants contributing to the aroma of tea (Schuh and Schieberle, 2006). Other two compounds hexanal and 2-hexenal impart a green and fruity odor into tea (Schuh and Schieberle, 2006; Wang
et al., 2008) which is supposedly developed from fatty acids. Oxidative degradation of amino acids phenylalanine might be responsible for the formation of aromatic aldehydes like benzaldehyde and benzeneacetaldehyde (Kumazawa and Masuda, 2002), which contribute for an almond odor in teas (Wang et al., 2008). (E,E)-2,4-Heptadienal is found to impart a fatty odor in teas (Schuh and Schieberle, 2006). The highest amount of peak area was found for methyl salicylate, which was also detected in tea samples previously and has been known as an important compound for overall tea aroma (Lv et al., 2014; Wang et al., 2008). Many of the ketones detected in the present study have possibly been produced from the oxidation/degradation of fatty acids. 2,3-Butanedione exerts a buttery odor in black tea (Schuh and Schieberle, 2006) and green tea (Kumazawa and Masuda, 2002). Linalool and linalool oxides are developed during enzymatic hydrolysis of green tea leaves (Wang et al., 1994). Linalool is considered as one of the vital odorants in black tea leaves and tea infusions (Schuh and Schieberle, 2006), green tea (Kumazawa and Masuda, 2002). It has been reported contributing for citrus and floral odor in teas (Schuh and Schieberle, 2006; Wang et al., 2008; Wang et al., 1994). Similarly, beta-ionone is known to contribute for violet aroma and designated as a complex woody and fruity scent. It is synthesized as a result of oxidative degradation or enzymatic oxidation of carotenoids present in teas. A typical flavor in green tea and oolong tea is supposed to be contributed by beta-ionone (Joshi and Gulati, 2015).
Conclusion
Both origin of tea and extraction temperature significantly affected the chemical and antioxidant potentials of the tea extracts. The extracts from Gushu Pu-erh showed lower pH at both temperatures compared to typical Pu-erh. The antioxidant potentials of tea extracts measured through DPPH, ABTS, and SOD of Gushu Pu-erh was significantly higher at both temperatures compared to those of typical Pu-erh. Similarly, the total polyphenol and flavonoid contents at both extraction temperatures were Table 4. Mineral content (mg/kg) of typical Pu-erh (CPE) and Gushu Pu-erh (GPE) tea extracts
Element Sample
1)
CPE-80 GPE-80 CPE-100 GPE-100
Ca 1420.68±28.11a2) 1407.24±26.14a0 1411.39±19.11a0 1432.12±18.91a0 Cu 06.89±0.01c 06.88±0.01c 09.21±0.01b 10.99±0.01a Fe 105.88±0.40b0 74.20±0.30d 119.77±0.21a0 99.31±0.39c K 8476.40±208.32b 8395.89±185.95b 8862.32±180.21a 8931.27±188.29a Mg 938.02±19.07a 826.36±16.41b 931.99±15.37a 942.12±10.02a Mn 298.96±1.78d0 436.54±7.02b0 332.66±2.02c0 521.33±6.21a0 Na 34.45±0.91b 14.58±0.68d 39.88±0.18a 18.99±1.12c Zn 14.63±0.01d 15.29±0.05c 32.16±0.09b 39.88±0.16a Total 11295.91 11176.98 11739.37 11996.01
1)CPE-80: dried typical Pu-erh tea (1.5 g) was extracted with boiling water (150 mL) and incubated at 80oC; CPE-100: dried typical Pu-erh tea (1.5 g) was extracted with boiling water (150 mL) and incubated at 100oC; GPE-80: dried Gushu Pu-erh tea (1.5 g) was extracted with boiling water (150 mL) and incubated at 80oC; GPE-100: dried Gushu Pu-erh tea (1.5 g) extracted with boiling water (150 mL) and incubated at 100oC. All the tea samples were incubated for 3 min with shaking for 30 s.
Table 5. Volatile flavor compounds detected in the extracts of typical Pu-erh (CPE) and Gushu Pu-erh (GPE)
Compound Retention Time
(min)
1)Peak area (%)
CPE-80 GPE-80 CPE-100 GPE-100
Alcohols 6.91 6.95 4.42 6.69 pentan-2-ol 15.18 - - 0.26 -(E)-hex-4-en-3-ol 21.154 - - 0.25 -(5E)-octa-1,5-dien-3-ol 28.7 - - 0.30 -4-methylhexan-2-ol 30.337 - - - 1.36 oxocan-2-ol 35.25 0.01 - - -oct-1-en-3-ol 38.465 1.00 1.80 0.52 0.58 (2S)-4-(benzenesulfonyl)-2-methylbutan-1-ol 40.603 - - 0.18 -2-methylidenecyclopentan-1-ol 40.606 0.27 - - -2-ethylhexan-1-ol 40.974 0.67 0.69 - 0.76 2-methylcyclopentan-1-ol 41.356 0.16 - 0.49 -octan-1-ol 45.125 - 0.81 0.30 -4-methyl-1-propan-2-ylcyclohex-3-en-1-ol 47.719 - 0.31 - -(E)-dec-2-en-1-ol 48.501 0.49 - - -(E)-oct-2-en-1-ol 48.506 - 0.78 0.26 -nonan-1-ol 51.112 0.29 - - -3-aminopropan-1-ol 51.201 - - 0.23 -2-[(1S)-4-methylcyclohex-3-en-1-yl]propan-2-ol 53.17 0.37 1.14 0.30 0.79 1-propan-2-yloxypropan-2-ol 53.797 0.08 - - -hexadecan-1-ol 56.811 - - - 1.06 decan-1-ol 56.834 1.30 - 0.75 -propan-2-ol 58.822 - - 0.15 -(2E)-3,7-dimethylocta-2,6-dien-1-ol 61.309 0.37 0.66 0.23 0.50 benzene;ethanol;hydrate 64.484 0.15 0.36 0.19 0.32 dodecan-1-ol 67.507 0.52 - - -tetradecan-1-ol 67.51 - 0.40 - 0.52 1,3-diocan-5-ol 71.75 - - 0.01 -ethanol, 2-[2-ethoxethoxy)ethoxy]- 77.957 0.15 - - -2-[2-[2-(2-decoxyethoxy)ethoxy]ethoxy]ethanol 88.119 1.08 - - 0.80 Aldehydes 5.92 7.41 6.56 6.73 hexanal 15.232 0.62 0.69 0.88 0.67 heptanal 21.315 0.18 0.26 - -(E)-hex-2-enal 23.338 0.14 - - -octanal 27.973 - 0.24 0.18 0.24 (E)-hept-2-enal 30.173 1.24 1.39 2.35 1.46 nonanal 34.74 0.48 1.12 0.40 0.61 benzaldehyde 42.59 0.61 1.06 0.15 0.66 11-[(5Z)-5-[(2-chlorophenyl)methylidene]-4-oxo-2-sulfanylidene-1,3-thiazoli-din-3-yl]undecanoic acidl 48.494 - - 0.26 -dodecan-1-ol 48.5 - - - 0.33 (E)-dec-2-enal 49.979 1.08 0.90 0.98 1.04 4-propylbenzaldehyde 59.986 1.57 1.75 1.36 1.72 Esters 39.91 30.16 30.83 34.34 methyl (2E)-2-hydroxyiminopropanoate 25.086 - 0.06 - 0.11
methocyacetic acid, 4-tridecyl ester 25.145 0.15 - -
-methocyacetic acid, 2-tridecyl ester 35.251 - - - 0.28
ethyl 2-trimethylsilyloxy-2-(3-trimethylsilyloxyphenyl)acetate 43.216 0.57 - -
-methyl 2-hydroxybenzoate 57.218 37.98 29.68 30.83 33.95
methyl 2-hydroxybenzoate 57.748 0.20 - -
-(z)-N-hydroxybenzenecarboximidic acid methyl ester 58.446 0.69 0.42 -
-decyl 2-methoxyacetate 58.798 0.23 - -
-significantly higher in Gushu Pu-erh compared to typical Pu-erh. Mineral content in both tea samples extracted at 100oC was higher compared to that at 80oC. Among the 80 volatile compounds, the peak area of esters was higher than that of other groups. This study indicated that production environment and extraction temperatures significantly affects the chemical properties, including polyphenol content of tea samples. Polyphenols have drawn substantial attention because of their natural abundance and remarkable biological activities. The results suggests that Gushu Pu-erh extracted at 100oC for 3 min with 30 s of shaking possesses higher antioxidant potential and mineral content.
Conflict of Interests
The authors have declared no conflict of interest.
References
Ahmed S, Unachukwu U, Stepp JR, Peters CM, Long C, Kennelly E. Pu-erh tea tasting in Yunnan, China: correlation of drinkers’ perceptions to phytochemistry. J. Ethnopharmacol. 132: 176-185 (2010)
Chen HY, Lin-Shiau SY, Lin JK. Pu-erh tea; its manufacturing and health benefits. pp. 9-15. In: Tea and Tea Products: Chemistry and Health-Promoting Properties. Ho CT, Lin JK, Shahidi F (ed). Table 5. Continued
Compound Retention Time
(min)
1)Peak area (%)
CPE-80 GPE-80 CPE-100 GPE-100
Hydrocarbons 3.08 3.65 2.93 3.36 toluene 13.18 0.37 0.43 0.44 0.47 1,4-xylene 20.193 - - 0.66 -1,3-xylene 21.125 0.34 - - -1,3-xylene 21.158 - 0.46 - -1,4-xylene 21.174 - - - 0.41 benzene, 1,3-bis(1,1-demethylethyl)- 36.938 2.03 - - -1,3-ditert-butylbenzene 36.942 - 2.48 1.70 2.48 3-acethylmethylthiophenol 45.266 0.14 - - -2-ethoxy-1,4-dimethyl-benzene 50.07 - 0.28 - -1-methyl-4-propan-2-ylcyclohexa-1,4-diene 61.419 - - 0.13 -4-methyl-1-prop-1-en-2-ylcyclohexene 61.425 0.20 - - -Ketones 1.81 0.83 1.25 1.92 icosane 12.967 0.35 - - 0.48 2-methylheptan-4-one 22.301 0.16 - - -4-methylheptan-2-one 22.734 0.35 0.36 0.33 0.47 4,6-dimethylheptan-2-one 24.976 - - 0.22 -(E)-oct-4-en-3-one 28.772 0.34 - - -hept-1-en-3-one 28.78 - - - 0.41 2,2,6-trimethylcyclohexan-1-one 29.775 0.38 0.47 0.25 -2-methylheptan-4-one 47.555 0.23 - - -decane 21.73 - - 0.22 -tetracosane 47.551 - - 0.23 0.56 Phenols 6.27 7.09 5.87 7.43 2-methoxy-3-methyl-phenol 45.844 0.19 - - -4-(1-hydroxyprop-2-enyl)-2-methoxyphenol 74.761 - - 0.17 -4-methoxy-2,5-dimethyl-phenol 76.125 - 0.50 - 0.44 2,4-ditert-butylphenol 83.296 6.08 6.59 5.70 6.99 Others 3.85 18.48 4.21 9.45 3-(maleimido-2’-yl)-1-methyl-2-(1’-methylindol-2’-yl)indole 20.934 0.09 - - -2-[(2S,5S)-5-ethenyl-5-methyloxolan-2-yl]propan-2-ol 38.008 0.25 0.47 0.20 -2-[(2S,5S)-5-ethenyl-5-methyloxolan-2-yl]propan-2-ol 39.774 0.25 1.00 0.32 0.83 2,4,6,8-tetraoxatetrasilocan-2-ol Auramine 43.212 - 0.58 0.57 0.82 3,7-dimethylocta-1,6-dien-3-ol 44.407 3.26 15.85 3.12 6.89 tetrahydro-2-(methoxymethyl)-Furan 62.867 - - - 0.44 (E)-4-(2,6,6-trimethylcyclohexen-1-yl)but-3-en-2-one 65.985 - 0.58 - 0.47
1)CPE-80: dried typical Pu-erh tea (1.5 g) was extracted with boiling water (150 mL) and incubated at 80oC; CPE-100: dried typical Pu-erh tea (1.5 g) was extracted with boiling water (150 mL) and incubated at 100oC; GPE-80: dried Gushu Pu-erh tea (1.5 g) was extracted with boiling water (150 mL) and incubated at 80oC; GPE-100: dried Gushu Pu-erh tea (1.5 g) extracted with boiling water (150 mL) and incubated at 100oC. All the tea samples were incubated for 3 min with shaking for 30 s.
CRC Press, Boca Raton, FL, USA (2009)
Choi SH, Kim ID, Dhungana SK, Kim DG. Comparison of quality characteristic and antioxidant potential of cultivated Pu-erh and Gushu Pu-erh tea extracts at two temperatures. J. Pure Appl. Microbio. 12: 1155-1162 (2018)
Clement Y. Can green tea do that? A literature review of the clinical evidence. Prev. Med. 49: 83-87 (2009)
Czernicka M, Zagula G, Bajcar M, Saletnik B, Puchalski C. Study of nutritional value of dried tea leaves and infusions of black, green and white teas from Chinese plantations. Roczniki Pañstwowego Zak³adu Higieny 68: 237-245 (2017)
Debnath T, Park PJ, Deb Nath NC, Samad NB, Park HW, Lim BO. Antioxidant activity of Gardenia jasminoides Ellis fruit extracts. Food Chem. 128: 697-703 (2011)
Dhungana SK, Kim BR, Son JH, Kim HR, Shin DH. Comparative study of CaMsrB2 gene containing droughttolerant transgenic rice (Oryza sativa L.) and nontransgenic counterpart. J. Agron. Crop Sci. 201: 10-16 (2015)
Du WH, Peng SM, Liu ZH, Shi L, Tan LF, Zou XQ. Hypoglycemic effect of the water extract of Pu-erh tea. J. Agr. Food Chem. 60: 10126-10132 (2012)
Fan JP, Fan C, Dong WM, Gao B, Yuan W, Gong JS. Free radical scavenging effect of Pu-erh tea extracts and their protective effect on oxidative damage in human fibroblast cells. Food Chem. Toxi-col. 59: 527-533 (2013)
Gao X, Lv S, Wu Y, Li J, Zhang W, Meng W, Wang C, Meng Q. Volatile components of essential oils extracted from Pu-erh ripe tea by different extraction methods. Int. J. Food Prop. 20: S240-253 (2017)
Gloess AN, Schönbächler B, Klopprogge B, Lucio D, Chatelain K, Bongartz A, Strittmatter A, Rast M, Yeretzian C. Comparison of nine common coffee extraction methods: instrumental and sensory analysis. Eur. Food Res. Technol. 236: 607-627 (2013)
Hajiaghaalipour F, Sanusi J, Kanthimathi MS. Temperature and time of steeping affect the antioxidant properties of white, green, and black tea infusions. J. Food Sci. 81: H246-H254 (2016)
Harbowy ME, Balentine DA. Tea chemistry. Crit. Rev. Plant Sci. 16: 415-480 (1997)
Hilal Y. Morphology, manufacturing, types, composition and medici-nal properties of tea (Camellia sinensis). Jourmedici-nal of Basic and Applied Plant Science 1(2): 1-10 (2017)
Ho CT, Zheng X, Li S. Tea aroma formation. Food Science and Human Wellness 4: 9-27 (2015)
Houston MC, Harper KJ. Potassium, magnesium, and calcium: their role in both the cause and treatment of hypertension. J. Clin. Hypertens. 10: 3-11 (2008)
Hu YJ, Jia JJ, Qiao JL, Ge CR, Cao ZH. Antimicrobial activity of Pu-erh tea extracts in vitro and its effects on the preservation of cooled mutton. J. Food Safety 30: 177-195 (2010)
Je JY, Park PJ, Jung WK, Kim SK. Amino acid changes in fer-mented oyster (Crassostrea gigas) sauce with fermentation peri-ods. Food Chem. 91: 15-18 (2005)
Joshi R, Gulati A. Fractionation and identification of minor and aroma-active constituents in Kangra orthodox black tea. Food Chem. 167: 290-298 (2015)
Kim ID, Dhungana SK, Kim HR, Choi YJ, Shin DH. Persimmon leaf and seed powders could enhance nutritional value and accep-tance of green tea. Afr. J. Biotechnol. 16: 1116-1122 (2017) Kim ID, Lee JW, Kim SJ, Cho JW, Dhungana SK, Lim YS, Shin
DH. Exogenous application of natural extracts of persimmon (Diospyros kaki Thunb.) can help in maintaining nutritional and mineral composition of dried persimmon. Afr. J. Biotechnol. 13:
2231-2239 (2014)
Kraujalytë V, Pelvan E, Alasalvar C. Volatile compounds and sensory characteristics of various instant teas produced from black tea. Food Chem. 194: 864-872 (2016)
Kumazawa K, Masuda H. Identification of potent odorants in differ-ent green tea varieties using flavor dilution technique. J. Agr. Food Chem. 50: 5660-5663 (2002)
Lv S, Wu Y, Li C, Xu Y, Liu L, Meng Q. Comparative analysis of Pu-erh and Fuzhuan teas by fully automatic headspace solid-phase microextraction coupled with gas chromatography-mass spectrometry and chemometric methods. J. Agr. Food Chem. 62: 1810-1818 (2014)
McKenzie JS, Jurado JM, De Pablos F. Characterisation of tea leaves according to their total mineral content by means of probabilistic neural networks. Food Chem. 123: 859-864 (2010)
Miller NJ, Rice-Evans C, Davies ML, Gopinathan V, Milner A. A novel method for measuring antioxidant capacity and its applica-tion to monitoring the antioxidant status in premature neonates. Clin. Sci. 84: 407-412 (1993)
Mohdaly AA, Sarhan MA, Smetanska I, Mahmoud A. Antioxidant properties of various solvent extracts of potato peel, sugar beet pulp and sesame cake. J. Sci. Food Agr. 90: 218-226 (2010) Oi Y, Hou IC, Fujita H, Yazawa K. Antiobesity effects of Chinese
black tea (Pu-erh tea) extract and gallic acid. Phytother. Res. 26: 475-481 (2012)
Peng CX, Wang QP, Liu HR, Gao B, Sheng J, Gong JS. Effects of Zijuan Pu-erh tea theabrownin on metabolites in hyperlipidemic rat feces by Py-GC/MS. J. Anal. Appl. Pyrol. 104: 226-233 (2013) Schuh C, Schieberle P. Characterization of the key aroma compounds
in the beverage prepared from Darjeeling black tea: quantitative differences between tea leaves and infusion. J. Agr. Food Chem. 54: 916-924 (2006)
Selli S, Cayhan GG. Analysis of volatile compounds of wild gilthead sea bream (Sparus aurata) by simultaneous distillation-extraction (SDE) and GC-MS. Microchem. J. 93: 232-235 (2009)
Singleton VL, Rossi JA. Colorimetry of total phenolics with phosph-omolybdic-phosphotungstic acid reagents. Am. J. Enol. Viticult. 16: 144-158 (1965)
Skujins S. Handbook for ICP-AES (Varian-Vista). A Short Guide to Vista Series ICP-AES operation. Varian Int. AG, Zug. Version 1.0. Switzerland (1998)
Turkmen N, Sarı F, Velioglu YS. Factors affecting polyphenol con-tent and composition of fresh and processed tea leaves. Aka-demik Gıda 7(6): 29-40 (2009)
Tyl C, Sadler GC. pH and titratable acidity. pp. 389-406. In: Food Analysis. Nielsen SS (ed). Springer Science, Basel, Switzerland (2017)
Wang D, Ando K, Morita K, Kubota K, Kobayashi A. Optical iso-mers of linalool and linalool oxides in tea aroma. Biosci. Bio-technol. Bioch. 58: 2050-2053 (1994)
Wang LF, Lee JY, Chung JO, Baik JH, So S, Park SK. Discrimina-tion of teas with different degrees of fermentaDiscrimina-tion by SPME-GC analysis of the characteristic volatile flavour compounds. Food Chem. 109: 196-206 (2008)
Zhao LJ, Jia ST, Tang WR, Sheng J, Luo Y. Pu-erh tea inhibits tumor cell growth by down-regulating mutant p 53. Int. J. Mol. Sci. 12: 7581-7593 (2011)
Zhou HJ, Li JH, Zhao FL, Han J, Yang XJ, Yang W, Wu XZ. Study on main microbes on quality formation of Yunnan Pu-erh tea dur-ing pile-fermentation process. Journal of Tea Science 24: 212-218 (2004) (in Chinese)